I
UNIVERSITÀ DEGLI STUDI DELLA TUSCIA DI VITERBO
DIPARTIMENTO DI SCIENZE ECOLOGICHE E BIOLOGICHE (DEB) CORSO DI DOTTORATO DI RICERCA
IN GENETICA E BIOLOGIA CELLULARE XXIV Ciclo.
Proteomics and Metabolomics:
New "omics" platform technologies for biological applications
BIO/11
Coordinatore: Prof. Giorgio Prantera
Firma:………..
Tutor: Dott.ssa Anna Maria Timperio
Firma:………...
Dottorando: Federica Gevi
II
“You can never write the word end. As soon as you stop it is time to start again.” (Pablo Picasso)
III
The word „omics‟, is derived from the Greek suffix, „ome‟ (meaning all, every, whole, or complete) and refers to the scientific areas in molecular biology, which aim for a global view on biological systems in order to understand life and its organization as holistic existence. In the mid 1990‟s, rapid evolution and growing knowledge concerning genomes (the complete genetic sequence of an organism) led to a quick development of the full range of „omics‟ approaches (genomics, transcriptomics, proteomics, metabolomics). The „omics‟ approaches are often applied to investigate samples collected from different populations or upon different physiological states (disease vs healthy, treated vs untreated, temperature stressed vs unstressed, etc.), aiming to find molecules that would differentiate between these classes of samples. This PhD thesis focuses on the application of new “omics” sciences to characterized samples of biomedical interest such as pharmaceutical products. The first section is focused on the characterization of important pharmaceutical products used by hemophiliac patients, trough proteomics approaches. The first objective of this study was to compare the heterogeneity and the high purity of three rFVIII commercially available rFVIII concentrates (Advates , Helixate NexGens and Refacto) before and after thrombin digestion. The second object was to extend the same study to plasma derived factor VIII (Beriate and Emoclot). The second part of my PhD project was designed mainly to the development and optimization of a new HPLC-MS method for metabolomics. Metabolomics is defined as the study of metabolome or the complex system of metabolites that, as intermediates of biochemical reactions, play an important role in the connection between the different pathways involved in a living cell. The metabolites can be seen as the end product of gene expression or activity of the protein (enzyme), thus defining the biochemical phenotype of a biological system. In the last part of my research I used this analytical approach to investigate metabolites in blastocoele fluid that is a routine waste product prior to pre-implantation blastocyst vitrification. Generally embryo assessment is currently performed through the analysis of its morphology. The aim of this study was directed to identify a correlation between quali-quantitative profiles of small molecules of metabolic interest and the outcome of embryo transfer through a simple HPLC-MS assay. Finally I used metabolomics approach for investigation of metabolomics changes in red blood cell during storage. The aim of this work was to confirm and expand existing literature about the rapid fall of glycolytic rate and accumulation of glycolysis end products during first 42 days of storage. Proteome and metabolomic approaches, are widely used for studies complex biological systems and can be used for applications in biological areas.
IV
Abbreviations
CE Capillary Electrophoresis
ESI Electrospray ionization FA Formic acid
FIVET Fertilization in Vitri and Embryo Tranfert FTICR Fourier Transform Ion Cyclotron Resonance
HPLC High Performance Liquid Chromatography LC Liquid Chromatography
GC Gas Chromatography
MALDI Matrix Assisted Laser Desorption/Ionization
MRM Multiple Reaction Monitoring
MS Mass Spectrometry
MS/MS Tandem Mass Spectrometry
NMR Nuclear Magnetic Resonance
SRM Single Reaction Monitoring
TOF Time of Flight
V
Index
Chapter 1: Proteomics
1.1Proteomics 01
1.2 Different approaches in proteomics 01
1.3 Separative techniques 03
1.3.1 Two-dimensional gel electrophoresis 03
1.3.2 Liquid chromatography separation 04
1.4 Protein digestion strategies 05
1.4.1 Identification trough mass spectrometry 05
1.4.2 Ion source 05 1.4.32Mass analyzer 06
1.4.4 Mass detector 06
1.5 Proteomic’s application 07
1.6 References 08 Chapter 2: Recombinant clotting factor VIII concentrates: Heterogeneity and high-purity evaluation 2.1 Introduction: 10 2.1.1 Haemophilia A 10 2.1.2 History of Treatment in haemophiliac patient. 10 2.1.3 Factor VIII‟s structure. 13 2.2 Materials and methods 15
2.2.1 rFVIII 15
2.2.2 Digestion of rFVIII with thrombin 15
2.2.3 SDS –PAGE 15 2.2.4 2DE 15 2.2.5 In gel digestion 17 2.2.6 Protein identification by MS/MS 17 2.3 Results 18 2.3.1 Optimization of 2-DE protocol 23 2.3.2 Analysis of FVIII preparation by 2-D IEF-SDSPAGE 24 2.4 Discussions 34
2.5 Conclusion 37
VI
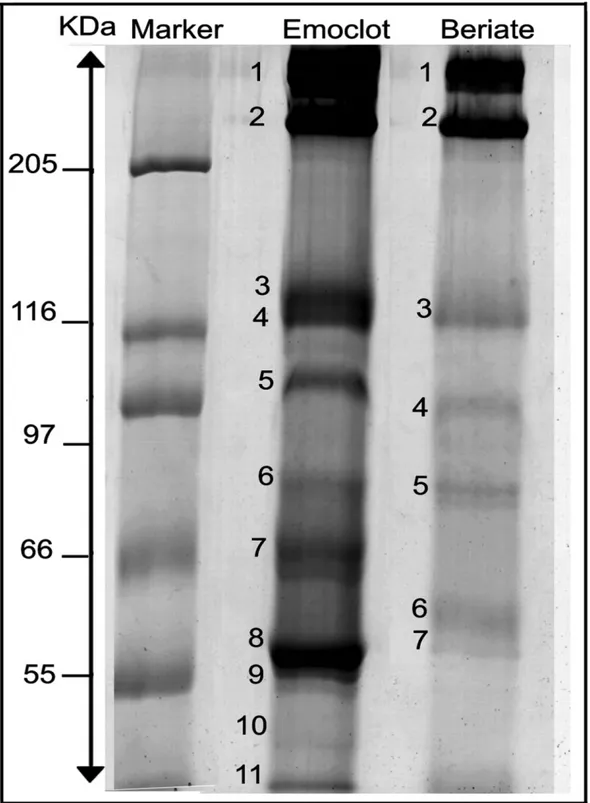
Chapter 3: Comparison among plasma-derived clotting Factor VIII by using monodimensional gel electrophoresis and mass spectrometry
3.1 Introduction 43
3.2 Materials and methods 44
3.2.1 In-gel-digestion 44
3.2.2 RP-nano HPLC mass spectrometry 45
3.3 Results 45
3.4 Discussions 50
3.5 References 52
Chapter 4: Metabolomics: A new Rapid Resolution Reverse-Phase HPLC strategy to investigate various metabolic species in different biological models
4.1 Introduction:metabolomics 55
4.1.2 Coining the term 56
4.1.3Metabolomic‟s approaches:
target analisys and metabolomic profiling 57
4.1.4 Technical evolution of metabolomics: from NMR to MS 59
4.1.5 Mass spectrometry 62
4.1.6 Work flow of metabolomics 65
4.2 Materials and methods 66
4.2.1 Sample preparation 66
4.2.2 Sample extraction and determination of extraction efficiency 68
4.2.3 Rapid Resolution Reverse-Phase HPLC 68
4.2.4 ESI Mass Spectrometry 69
4.2.5 Data elaboration and statistical analysis 65
4.3 Results 71
4.3.1 Extraction efficiency and technical reproducibility 71
4.3.2 Simoultaneously testing of multiple metabolites from the main metabolic pathways through a single strategy on different
biological samples 72
4.4. Discussions 75
4.5 Conclusions 76
VII
Chapter 5:A mass spectrometry-based targeted metabolomics strategy of human blastocoele fluid: a promising tool in fertility research.
5.1 Introduction 79
5.1.1 FIVET : in vitro fertilization and embryo transfert 79
5.1.2 Italian law about assisted reproduction technology 81 5.1.3 Blastocyst 81 5.1.4 Blastocyst grading system 82 5.2 Materials and method 84
5.2.1 Blastocoele fluid collection 85 5.2.2 Metabolite extraction 85
5.2.3 Rapid resolution reversed-phase HPLC 86 5.2.4 ESI mass spectrometry 86 5.2.5 Metabolite analysis and data elaboration: 87 5.3 Results and discussions 87 5.4 Conclusions 93 5.5 References 94 Chapter 6:Alterations of Red Blood Cell metabolome during cold liquid storage of erythrocyte concentrates in CPD-SAGM 6.1 Introduction 97 6.1.2 Red blood cell storage. 97
6.2 Materials and methods 98
6.2.1 Sample collection 98 6.2.2 Metabolite extraction 98
6.2.3 Rapid Resolution Reversed-Phase HPLC 99 6.2.4 Mass Spectrometry: Q-TOF settings 99
6.2.5 Data elaboration and statistical analysis 100
6.3 Results and discussion 100
6.3.1 Glycolytic intermediates were rapidly depleted over the first 100
two weeks, while end-products accumulated 6.3.2 Metabolix fluxes towards the PPP were altered 101
6.4 Conclusion 106
6.5 References 106
1
Chapter 1 1.1 Proteomics
The word ―Proteome‖ was introduced for the first time by Marc Wilkins in 1994 during the scientific meeting ―2D electrophoresis: from protein maps to genomes‖ held at Siena, Italy. The proteome has been defined as the entire complement of proteins expressed by a cell, organism, or tissue type. At the same time the word ―Proteomics‖ appeared, in analogy with ―Genomics‖, to describe the scientific field that studies the proteome using a wide range of separation, analytical and bioinformatics tools to characterize and measure the result of gene expression at one time, under specific conditions, in a cell, tissue or organism (Traini 1998) infact proteomics is defined as : ―The analysis of the entire protein complement expressed by a genome‖ (Wasinger 1995). In general, proteomic approaches can be used:
(a) for proteome profiling,
(b) for comparative expression analysis of two or more protein samples, (c) for the localization and identification of posttranslational modifications, (d) for the study of protein–protein interactions.
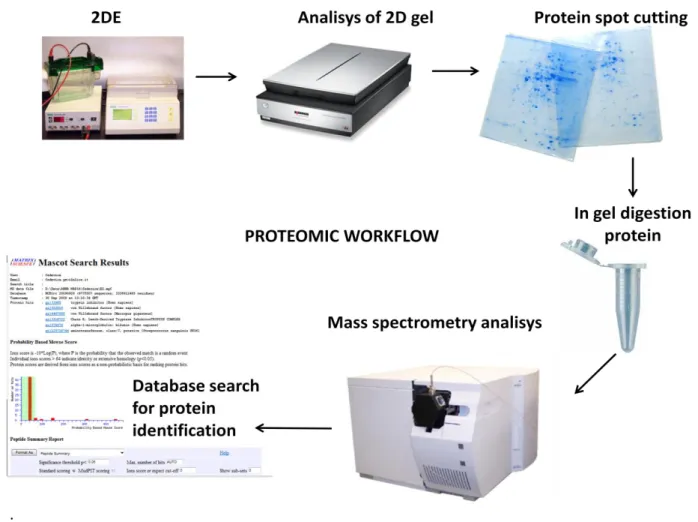
Considering the complexity of the proteome, improved methods of analysis are of critical importance to realize the goals of proteomics. As already mentioned, the methodologies employed in proteomics depending on the objectives of the experiment. The general analysis scheme used to study the proteome is referred to as the proteomics workflow. In my study I use this kind of workflow (Fig 1).
1.2 Different approaches in proteomics
There are two main approaches to protein identification through mass spectrometry: the bottom-up and top-down approach. In bottom-up mass spectrometry, the proteins in the mixture undergo proteolytic digestion before the introduction into the mass spectrometer. Proteolytic digestion is carried out by proteolytic enzymes, such as trypsin, and consists in the cleavage of the whole protein at specific sites known in advance (specificity of the enzyme). Then the sample is ionized, sometimes after a separation stage, and finally analyzed by the spectrometer. This is what characterizes bottom-up proteomics: that the analytes are cleaved peptides. There are two commonly used methodologies: peptide mass fingerprinting and
2
tandem mass spectrometry (MS/MS or MS2). In peptide mass fingerprinting, peptide masses obtained from the MS scan are compared to calculated peptide masses.
.
Figure 1 : Workflow in proteomics: a gel-based approach using protein level separation
followed by visualization and comparison of test and control samples, with in-gel digestion and LC-MS/MS analysis of the extracted peptides.
These masses are obtained by an in silico cleavage of proteins or gene sequences in a database using the appropriate specificity. In tandem mass spectrometry, a peptide ion is isolated in the mass analyzer and subjected to dissociation to produce product ion fragments. These fragments are then analyzed by a second mass spectrometric measurement. With the product ion spectra, different methods can be applied: a de novo analysis of the whole protein, a de novo reconstruction of small peptide sequences that serve as tags for a database search, or a database search based on a cross-correlation analysis. In top-down proteomics, intact protein molecular ions generated by electrospray ionization are introduced into the mass analyzer and are subjected to gas-phase fragmentation for MS analysis. Therefore its difference from the
3
bottom-up approach resides in that charged fragments of the whole protein are analyzed instead of proteolytic digests, and they are usually much larger (104 Daltons is a typical parent mass for a top-down spectrum). As in the bottom-up approach, different methods can be applied to attempt to identify proteins from spectra.
1.3 Separative techniques
The complex nature of the proteome demands the use of different analytical technologies to obtain the global picture of the cell. In particular the analysis of proteins, whether on a small or large scale, requires methods for the separation of protein mixtures into their individual components. The two groups of techniques that have come to dominate proteomics are two-dimensional gel electrophoresis (2DE) and multitwo-dimensional liquid chromatography (LC).
1.3.1 Two-dimensional gel electrophoresis
Electrophoresis is defined as the movement of charged molecules under an electrical field towards the opposite charged electrode. Due to their varying charges and masses, different molecules move with different velocities and became separated into single fractions (Westermeier 2006). Two-dimensional electrophoresis (2DE) was developed two decades before the term proteomics was coined (Klose 1975; O'Farrell 1975). The 2DE entails the separation of complex protein mixtures by molecular charge in the first dimension and by mass in the second dimension. 2DE analysis provides several types of information about the hundreds of proteins investigated simultaneously, including molecular weight, pI and quantity, as well as possible posttranslational modifications. The underlying principle is that electrophoresis is carried out in a pH gradient, allowing each protein to migrate to its isoelectric point, i.e., the point at which its pI value is equivalent to the surrounding pH and its net charge is zero. Proteins with different pI values therefore focus at different positions in the pH gradient. The pH gradient in an IEF gel can be established to use synthetic carrier ampholytes, which are collections of small amphoteric molecules with pI values corresponding to a given pH range. The second dimension separation in 2DE is generally carried out by standard sodium dodecyl sulfate polyacrylamide gel electrophoresis (SDS-PAGE), and separates the proteins according to molecular mass irrespective of charge. The basis of the technique is the exposure of denatured proteins to the detergent SDS, which binds
4
stoichiometrically to the polypeptide backbone and carries a large negative charge. The presence of tens or hundreds of SDS molecules on each polypeptide dwarfs any intrinsic charge carried by the proteins themselves, and stoichiometric binding means that larger proteins bind more SDS than smaller proteins.
1.3.2 Liquid chromatography separation
LC has several advantages over 2DE as a separation method, including its versatility, sensitivity, and the ease with which it can be automated and integrated with downstream analysis by MS. Unlike gel electrophoresis, LC is suitable for the separation of both proteins and peptides, and can therefore be applied either upstream of 2DE to prefractionate the sample, downstream of 2DE to separate the peptide mixtures from single excised spots, or instead of 2DE as the separation technology of choice. LC methods can exploit different separation principles, such as size, charge, hydrophobicity, and affinity for particular ligands. As is the case for electrophoresis, the highest resolution separations are achieved when two or more separation principles are applied one after the other in orthogonal dimensions. In LC methods used in proteomics, the stationary phase is a porous matrix, usually in the form of packed beads that are supported on some form of column. The mobile phase, a solvent containing dissolved proteins or peptides, flows through the column under gravity or is forced through under high pressure Indeed, the individual fractions produced by such methods are usually ‗anonymous‘. Each spot on a 2D gel and each fraction emerging from an HPLC column look very much like any other. In the case of 2DE, even differences in spot size and distribution provide only vague clues about protein identity. The next stage in proteomic analysis is therefore to characterize the fractions and thus determine which proteins are actually present. Currently proteomics may rely on many chromatographic and electrophoresis tools to fractionate the analytes. However, if different approaches are in relation to these techniques of separation, all the strategies have a common essential final step: the mass spectrometry (MS) analysis of peptides or proteins.
5
1.4 Protein digestion strategies
Protein digestion procedures are used to produce a specific pool of peptides from single proteins, or from complex mixtures of proteins, which is then analyzed by MS. Enzymatic digestion of proteins with proteases produces a reproducible pool of peptides suitable for MS analysis. This feature makes this the preferred and most popular method to obtain the peptide fragments for protein identification. Generally, only one enzyme is used for protein digestion, but it has also been reported the use of multiple proteases to improve protein identification and characterization (Swaney 2010). Trypsin is the most used protease in MS-based proteomics studies, due to several factors: (i) high specificity, since it hydrolyses the peptide bond at the C-terminus of lysine and arginine residues, except when a proline follows in the sequence (Rodriguez 2008) (ii) the peptides produced have basic residues at the C-terminus (arginine and lysine) which make them easily ionisable in the mass spectrometer ; and (iii) the mass range of the obtained peptides, between 800 and 4000 Da, provides excellent MS and MS/MS data. In general, protein enzymatic digestion can be performed by three different approaches: (i) in-gel digestion; (ii) in-solution digestion; and digestion with immobilized enzymes. Each one of these approaches, as well as other new methodologies for protein digestion, will be addressed in the next sections.
1.4.1 Identification through mass spectrometry
The recent advances in proteomics were mainly driven by the increasing ability of MS to detect and characterize low levels of proteins. Mass spectrometers consist of three basic components: an ion source, a mass analyzer, and an ion detector (Mann 2001)
1.4.2 Ion source
Electrospray Ionization (ESI) and Matrix-Assisted Laser Desorption/Ionization (MALDI) are the two most commonly employed ion sources for proteins and peptides. ESI ionizes the analytes out of an aqueous solution and is therefore the ideal method for LC-MS setups. The liquid containing the analytes is pushed through a small capillary to which a potential difference is applied (Fenn 1989). This causes a strong electric eld which in turn causes an accumulation of charged molecules at the surface of the liquid. The solvent molecules, which
6
are usually more volatile than the analyte, evaporate and force the analyte molecules into closer vicinity. The molecules repel each other and break up the droplets. The process repeats until all solvent molecules are removed and the analytes form lone ions. An ESI source can be operated in positive or negative ion mode. In positive ion mode, the compounds receive a proton as charged adduct, in negative mode they receive an electron.
1.4.3 Mass Analyzer
The mass analyzer measures the mass-to-charge ratio (m/z) of the ionized analyte. For our purposes, its key parameters are sensitivity, mass resolution and mass accuracy (Aebersold 2003). The sensitivity characterizes the ability of the mass analyzer to detect weak signals. Mass resolution and mass accuracy describe how well the analyzer is able to resolve peaks with similar mass and how accurately it measures this mass, respectively.
In proteomics research, four basic kinds of mass analyzers are currently being used: time-of-flight (TOF),
ion trap, quadrupole
fourier transform ion cyclotron resonance (FTICR) analysers.
All four differ considerably in sensitivity, resolution, mass accuracy and the possibility to fragment peptide ions.
1.4.4 Mass detector
Finally, the mass detector counts the number of ions at each m/z. Possible detectors are photographic plates, faraday cylinders or array detectors. Most detectors need some time to recover after an ion hit. The combination of ion source, mass analyser and detector is usually determined by the application. ESI is most frequently coupled to ion traps (three-dimensional and linear ion traps) and hybrid tandem mass spectrometers like quadrupole time-of-flight (Q/TOF) instruments. In the case of ion traps, the ions are first captured in the centre of the device for a certain time interval and are then scanned from the trap to the detector (Yates 2004).With this type of mass analyser it is not only possible to determine the mass of a given peptide, but also its sequence. Ions with specific m/z ratios can be selected in the ‗trap‘ for fragmentation, induced by collision of the ion with an inert gas or a surface in a process called
7
collision induced fragmentation (CID). This energy causes the peptide ion to fragment at different points, commonly at the peptide bond. The recorded product ions represent the tandem mass spectrum (MS/MS, in particular the application of ESI coupled on-line with high-performance separation techniques such as HPLC, has had a dramatic effect on the sensitivity and the speed with which the primary structure of proteins and peptides can be determined (Aebersold 2001) which contains information on the amino acid sequence. MS-based proteomics has a rowing role in biomedical research where limited sample material is available, as femtomole sensitivity is routinely achieved.
1.5 Proteomic’s application
Since the definition of the concept 15 years ago, proteomics has become a very important discipline among the scientific community with multiple applications. Unlike the classical protein biochemistry science, which studies individual proteins emphasizing on structural, function and complete sequence analysis, proteomics investigates complex biological systems to understand the relation between different proteins and their distinct functions within large networks. By studying these complex systems at the proteome level, scientists can obtain better knowledge about biological functions, understand the changes in cellular regulation mechanisms caused by disease states, identify disease biomarkers and develop new drugs or therapeutic approaches. In recent years, proteomic technologies have led to enormous advances in basic research and medicine. On the clinical side, proteomics is viewed as a promising new approach that will speed the discovery and validation of protein biomarkers that correlate with disease and allow for assessment of therapeutic regimens. Proteomics research is applicable to just about every area of biochemical investigation including health, agriculture, fisheries and forestry. In my thesis I used proteomic analysis to characterized pharmaceutical products and to identified possible contaminations that could cause problems in Haemophiliac patient. In the first study, we have focused our investigation on rFVIII. Recombinant FVIII were first introduced in the early 1990s, as biosynthesized blood coagulation factor prepared using recombinant DNA technology (Wood 1994; Eaton 1987).
8
1.6 References :
Aebersold R., Goodlett D.R. (2001) Mass spectrometry in proteomics. Chem. Rev. 101: 269- 295.
Aebersold R., Mann M. (2003) Mass spectrometry-based proteomics. Nature 422:198-207.
Eaton D.L., Hass P.E., Riddle L., Mather J., Wiebe M., Gregory T., Vehar G. A. (1987) Characterization of factor VIII. Biol. Chem. 262: 3285–3290.
Fenn J. B., Mann M., Meng C. K., Wong S. F., Whitehouse C. M. (1998) Electrospray ionization for mass spectrometry of large biomolecules. Science 246: 64–71.
Yates J. R. Mass spectral analysis in proteomics (2004) Annu. Rev. Biophys. Biomol. Struct. 33: 297–316.
Klose J. (1975) Protein mapping by combined isoelectric focusing and electrophoresis of mouse tissues. A novel approach to testing for induced point mutations in mammals. Human Genetics 26:231–243.
Mann M., Hendrickson R. C., Pandey A., (2001) Analysis of proteins and proteomes by mass spectrometry. Annual Review of Biochemistry 70: 437–473.
O'Farrell P. H. (1975) High resolution two dimensional electrophoresis of proteins. Journal of Biological Chemistry 250:4007–4021.
Rodriguez J., Gupta N., Smith R.D., Pevzner P.A. (2008) Does trypsin cut before proline? J. Proteome Res 7: 300-305.
Swaney D.L., Wenger C.D., Coon J.J. (2010) Value of using multiple proteases for large-scale mass spectrometry-based proteomics. J. Proteome Res. 9:1323-1329.
Traini M., Gooley A.A., Ou K., Wilkins M.R., Tonella L., Sanchez J.C., Hochstrasser D.F., Williams K.L, (1998) Towards an automated approach for protein identification in proteome projects. Electrophoresis, 19:1941-1949.
9
Wasinger V.C., Cordwell S.J., Cerpa-Poljak A., Yan J.X., Gooley A.A., Wilkins M.R., Duncan M.W., Harris R., Williams K.L., Humphery-Smith I . (1995) Progress with gene-product mapping of the mollicutes: Mycoplasma genitalium. Electrophoresis 16:1090-1094.
Westermeier R. (2006) Preparation of plant samples for 2-d electrophoresis. Proteomics 2006 2:56-60.
Wilkins M.R., Williams K.L., Appel R.D., Hochstrasser D.F. (1997) Proteome Research: New Frontiers in Functional Genomics (Principles and Practice). Berlin: Springer 2:35-64.
Wood W.I., Capon D.J., Simonsen C.C., Eaton D.L., Gitschier J., Keyt B., Seeburg P.H., Smith D. H. (1994) Expression of active human factor VIII from recombinant DNA clones. Nature312:330-337.
10
Chapter 2
Recombinant clotting factor VIII concentrates: Heterogeneity and high-purity evaluation.
2.1.1 Introduction: Haemophilia A
Hemophilia is a bleeding disorder caused by a deficiency in one of two blood clotting factors: factor VIII (Haemophilia A) or factor IX (Haemophilia B). Hemophilia affects males much more frequently (1 in 10.000) than females (1 in 100.000.000). This occurs because a critical blood clotting gene is carried on the X chromosome. Since males only carry one X chromosome, if that is defective, hemophilia will immediately show up. Females, on the other hand, carry two X chromosomes. If only one is defective, the other normal X chromosome can compensate. The woman will have normal blood clotting; she will simply be a carrier of the recessive defective gene. This fact will be discovered if some of her children are hemophiliacs. Naturally, women hemophiliacs are rare because it takes two defective X chromosomes in order for the condition to be seen. Hemophilia has played an important role in Europe‘s history, for it suddenly cropped up in the children of Great Britain‘s Queen Victoria. It became known as the ―Royal disease‖ because it spread to the royal families of Europe through Victoria‘s descendants. Queen Victoria had always been worried about the quality of the blood of the British royal family.
2.1.2 History of Treatment in haemophiliac patient
In 1960 the average life expectancy for severe hemophilia A was less than 20 years, and the quality of life was generally devastating from joint bleeding complications or intracranial hemorrhage (Ikkalat 1982; Triemstra 1995). In the late 1950s and much of the 1960s, fresh frozen plasma (FFP) was the mainstay of treatment for hemophilia A and hemophilia B. Then in the early 1980s, the epidemic of HIV devastated the hemophilia community, and by 1985 nearly 75% of the severe hemophilia A patients in the US had acquired HIV. The ironic tragedy was that the source of the HIV infection was the plasma-derived factor VIII products that had promised to be life-saving. As the community dealt with the horrors of HIV, a second epidemic gradually became apparent. Over 95% of severe hemophilia A patients had also acquired hepatitis C infection through plasma-derived preparations of factor VIII (Goedert 2007). So in 1980s the need for safer haemophilia treatments became crucial to the
11
haemophilia community. The successful cloning of the factor VIII gene in 1984 was a major breakthrough, allowing production of recombinant human factor VIII (rfactor VIII). Recombinant FVIII, first introduced in the early 1990s, significantly reduced the risk for pathogen transmission. The FVIII gene is one of the largest proteins to be expressed for therapeutic purposes (Jiang 2002). The gene has been expressed in full length or with the B-domain deleted (Refacto®). Once the gene is selected for transfection it is spliced into a vector during the first part of recombinant product processing. The vector is then inserted into Chinese hamster ovary (CHO) or baby hamster kidney (BHK) cells. (Eriksson 2007; Pipe 1998). An inoculum, meeting strict criteria of viability, sterility, and growth rate, is then fermented in a bioreactor using a batch-refeed process. In culture, the cells then secrete rFVIII into the medium, which is harvested. The rFVIII-rich media undergoes a stepwise purification process (usually unique to the manufacturer), but generally includes multiple chromatography columns. The purification processes are designed to isolate rFVIII and remove or inactivate any remaining contaminants. The bulk processing is designed to ensure consistency in the quantitative and qualitative composition of all preparations. There are a number of different recombinant products in use currently, produced by various pharmaceutical companies. This products referred to as ‗first, second or third generation‘ depending on the way they are manufactured are present.
• The ‗first generation‘ of recombinant products use animal products in the culture medium and contain human albumin (a human blood product) added as a stabilizer. ‗Recombinate‘ was the first generation recombinant factor VIII product manufactured by Baxter.
• ‗Second generation‘ products use animal-derived materials in the culture medium but do not have added albumin and instead use sucrose or other non-human derived material as a stabiliser. Second generation Factor VIII products are ‗Kogenate FS‘ made by Bayer (also labelled as ‗Helixate Nexgen‘ and distributed by ZLB), ‗Refacto®‘ manufactured by
Wyeth.
• ‗Third generation‘ products have no human or animal protein used in their preparation. The new third generation factor VIII products is. ‗Advate®‘, from Baxter.
Helixate NexGens® are produced introducing human FVIII genes into baby hamster kidney (BHK21) cell line while Advate® and Refacto® derived from Chinese hamster ovary (CHO) cells (Gomperts 1992; Jiang 2002; Eriksson 2001; Pipe1998).
The FVIII human gene has been expressed in full length (FLrFVIII), such as Helixate NexGens ® and Advates®, or with the B-domain deleted (BDDrFVIII), like ReFacto®. To this
12
regard, it is worthwhile to remark that initially, the B-domain was believed to have an insignificant function; however, in vitro studies have shown that B-domain interacts with chaperone proteins that have a processing role with ultra-cellular structures, although further investigations are mandatory (Pipe 1998). This might have an impact on the production production of rFVIII, although this should not influence its function in vivo. Indeed, while its biological role is not yet fully understood, B-domain removal has been found to dramatically improve the yield of rFVIII (Dorner 1987). Genetically engineered cell lines secrete rFVIII into a defined cell culture medium. Different methods are used to express, isolate, harvest and purify the rFVIII preparation. In all cases, a multistep purification process, including several chromatographic steps (like monoclonal antibody immunoaffinity chromatography, anion exchange chromatography, gel filtration), is needed for the isolation and the purification of rFVIII from the raw product of fermentation. The purification processes are designed to isolate rFVIII and remove or inactivate any remaining contaminants. The bulk processing is designed to ensure consistency in the quantitative and qualitative composition of all preparations. Single-dose vials are then prepared aseptically, and the liquid is lyophilized to produce a powder, which can be reconstituted with diluents prior to administration. Quality controls of the end product aim at establishing product stability and the absence of contaminants, mainly through SEC-HPLC and 1-D SDSPAGE, but not 2-DE (Kim 2007). So for all this ragion CNS decided to finance a project which premise the characterization of products general in use. In this study, we exploited the 2-DE approach to assess and compare the heterogeneity and the purity grade of commercially rFVIII Helixate NexGens®, Refacto® and Advate® preparation used in the treatment of hemophilia A before and after the thrombin cleavage. In literature are just present this kind of study in fact, Clifton (2009) performed a proteomic characterization of plasma derived FVIII in order to identify eventual impurities. The authors concluded that proteomic investigations are recommended in addition to routine biochemical and functional analyses, as to improve monitoring of production processes. Our data confirm that a proteomic approach can improve the quality assurance process also for different rFVIII concentrates.
13
2.1.3 Factor VIII’s structure
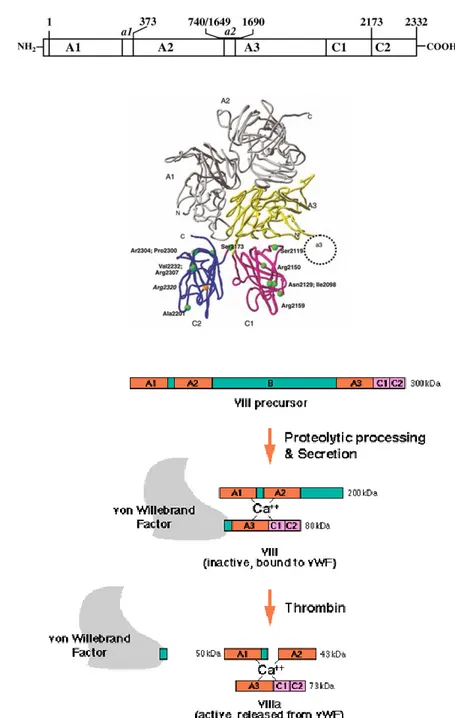
Human clotting factor VIII (FVIII) is a non-enzymatic plasma glycoprotein that plays an essential role in the intrinsic pathway of the blood coagulation cascade (Vehar,1984). Native protein is synthesized as a single polypeptide chain of 2332 amino acids, which is preceded by a 19-residue hydrophobic signal peptide of importance for the secretion. The protein contains six main domains: three A type domains, a central B domain and two C-type domains. In detail, domains can be distinguished as follows: three small acidic peptide regions (30–40 designed by ‗‗a‘‘) join (i) the A1 and A2 domains (residues 337–372); (ii) the A2 and B domains (residues 711–740); and (iii) the last one connects the B domain with the amino terminal of the A3 domain (residues 1649–1689). Therefore, the domain organization order of FVIII is as follows: (NH2)-A1-a1-A2- a2-B-a3-A3-C1-C2 (COOH). (Fig 2) The B domain, which represents 40% of the mass of FVIII, has no recognized function, as it does not appear to contribute to procoagulant activity (Andersson 1986).In plasma, FVIII circulates in an inactive pro-cofactor form in complex with von Willebrand factor, a 2050 amino acid glycoprotein. Interaction with von Willebrand factor stabilizes the FVIII molecule and facilitates the cleavage and activation of FVIII (Fulcher 1983). Under physiological conditions, FVIII is processed to a series of divalent metal ion-linked heterodimers by cleavage at the B-A3 junction: two fragments are generated (i) a variable heavy chain (90– 210 kDa) consisting of the A1-A2 and (ii) a heterogeneous fragment of partially proteolyzed B domains, which is associated with a light chain (80 kDa) consisting of the A3-C1-C2 domains (Fay 1986; Fay 2004). Conversion of profactor FVIII to active FVIIIa by thrombin (or factor Xa) is associated with specific proteolytic cleavages in both the heavy and the light chains (Lenting 1998). When factor VIIl is activated by thrombin, a 41-amino-acid peptide is liberated from the N-terminus of the light chain by cleavage at Arg l689 and removal of the B domain is completed by cleavage al Arg740 followed by cleavage of the heavy chain between the A1 and A2 domains at Arg372 (Eaton 1986; Fay 1986). This results in the formation of the active factor VIIIa molecule comprising in Al/light chaindimer associated with the A2 domain (Fay 1991).
14
Figure 2: A) The protein structure of factor VIII. There are 2332 residues in factor VIII,
composed of 3 distinct domain types in the arrangement (NH2) A1—A2—B—A3—C1—C2 (COOH). B) Activation of Factor VIII by Thrombin.
15
2.2 Materials and methods 2.2.1 rFVIII
We have used two batches of three approved rFVIII preparations obtained from different manufacturers: Helixate NexGen® 1000 UI (CSL Behring, Philadelphia, USA), Refacto® 250 UI (Wyeth Europa, Maidenhead, UK) and Advate® 250 UI (Baxter, Vienna, Austria). We reconstituted the lyophilized rFVIII preparations according to the manufacturers‘ instructions and then we stored at -80°C in 1-mL aliquots. We quantified total protein trough a Bradford assay (Bio-Rad Laboratories, Hercules, CA, USA) using bovine serum albumin (Sigma Aldrich, St. Louis, MO, USA) as standard.
2.2.2 Digestion of rFVIII with thrombin
To cleavage rFVIII with thrombin we prepare a solution with rFVIII preparations (2 mg) and 4 mg thrombin (Sigma Aldrich) in 20 mL of a cleavage buffer containing 50mM Tris (pH 8.0), 150mM NaCl, 2.5mM CaCl and 0.1% 2-mercaptoethanol. Reactions were run at room temperature for 20 min.
2.2.3 SDS-PAGE
SDS-PAGE was performed according to the method of Laemmli (1970). The rFVIII preparations (30 mg), before and after thrombin digestion, were loaded onto a 0.75-mm-thick 5–16% w/v acrylamide gradient gel. The 1-D gel was stained with Blue Silver (Shevchenko,1996). The apparent molecular weight of bands was determined using a wide molecular weight range calibration kit for SDS-PAGE (Sigma Aldrich).
2.2.4 2-DE
Protocol A: Four hundred micrograms of reconstituted sample was precipitated in 80% v/v acetone. After incubation at 41°C for 90 min, the precipitate was pelleted by centrifugation at 12 000 g for 20 min at 41°C. After washing with the same solution, the pellet was air-dried and then solubilized in the focusing solution containing 7M urea, 2M thiourea, 4% w/v
16
CHAPS, 0.5% w/v pH 4–7 carrier ampholyte (Bio-Rad Laboratories), Tris 40mM (pH 8.8), 5mM TBP and 10mM acrylamide. Before focusing, the sample was incubated in this solution for 3 h at room temperature, under agitation. To prevent over-alkylation excess, acrylamide was destroyed by adding an equimolar amount of DTE. Three hundred microliter of the resulting protein solution was then used to rehydrate 17 cm-long IPG 4–7 (Bio-Rad Laboratories) for 8 h. IEF was carried out on a Protean IEF cell (Bio-Rad Laboratories) with a maximum current setting of 50 mA/strip at 20°C. The total product time voltage applied was 80 000 Vh for each strip. For the second dimension, the IPG strips were equilibrated for 30 min in a solution containing 6M urea, 1% w/v SDS, 20% v/v glycerol and 375mM Tris-HCl (pH 8.8), with gentle agitation. The IPG strips were then laid on an 11% T SDS PAGE gel and proteins were visualized by Blue Silver method (Laemmli 1970).Protocol B: After precipitation in 80% v/v acetone, the air-dried pellet was solubilized in 100 mL of 7M urea, 2M thiourea, 4% w/v CHAPS, 0.5% w/v pH 4–7 carrier ampholyte, Tris 40mM (pH 8.8), 5mM TBP and 10mM acrylamide. Dried 17 cm-long IPG 4–7 strips were rehydrated overnight at room temperature with 800 mL of 7Murea, 2M thiourea, 2% w/v CHAPS, 0.5% w/v pH 4–7 carrier ampholyte (pH 6.3). The sample solution (100 mL) was loading into rehydrate IPG strip using the cup-loading method, and IEF was carried out on a Protean IEF cell with a maximum current setting of 50 mA/strip at 201C. After IEF, IPG strips were equilibrated for 30 min in a solution containing 6M urea, 1% w/v SDS, 20% v/v glycerol and 375mM Tris-HCl (pH 8.8), and laid on an 11% T SDS PAGE gel. Proteins were visualized by Blue Silver method. Protocol C: To remove the salt contaminations, the reconstituted sample (400 mg) was precipitated in 80% v/v acetone. The obtained air-dried pellet was than solubilized in 100 mL of 8M urea, 4% w/v CHAPS, 0.5 % w/v pH 4–7 carrier ampholyte, Tris 40mM (pH 8.8), 5mM TBP and 10mM acrylamide. Dried 17 cm-long IPG 4–7 strips were rehydrated with 800 mL of 8M urea, 2M thiourea, 2% w/v CHAPS and 0.5% w/v pH 4– 7 carrier ampholyte (pH 6.3). Cup-loading method was used to load the sample solution (100 mL) into rehydrate IPG strip. After the first dimension step, IPG strips were equilibrated for 30 min in a solution containing 6M urea, 3% w/v SDS, 20% .
17
2.2.5 In gel digestion
Protein spots were carefully excised from blue-silver-stained gels and subjected to in-gel trypsin digestion according to Shevchenko with minor modifications. The gel pieces were swollen in a digestion buffer containing 50mM NH4HCO3 and 12.5 ng/mL of trypsin (modified porcine trypsin, sequencing grade, Promega, Madison, USA) in an ice bath. After 30 min, the supernatant was removed and discarded, 20 mL of 50mM NH4HCO3 was added to the gel pieces and digestion allowed to proceed at 37°C overnight. The supernatant containing tryptic peptides was dried by vacuum centrifugation. Prior to mass spectrometric analysis, the peptide mixtures were redissolved in 10 mL of 5% formic acid (FA).
2.2.6 Protein identification by MS/MS
Peptide mixtures were separated using a nanoflow-HPLC system (Ultimate; Switchos; Famos; LC Packings, Amsterdam, The Netherlands). A sample volume of 10 mL was loaded by the autosampler onto a homemade 2-cm fused silica precolumn (75 mm id; 375 mm od; Reprosil C18- AQ, 3 mm, Dr. Maisch, Ammerbuch-Entringen, Germany) at a flow rate of 2 mL/min. Sequential elution of peptides was accomplished using a flow rate of 200 nL/min and a linear gradient from Solution A (2% ACN; 0.1% FA) to 50% of Solution B (98% ACN; 0.1% FA) in 40 min over the precolumn in-line with a homemade 10 to 15 cm resolving column (75 mm id; 375 mm od; Reprosil C18-AQ, 3 mm, Dr. Maisch GmbH, Ammerbuch-Entringen, Germany). Peptides were eluted directly into a High Capacity ion Trap (model HCTplus, Bruker-Daltonik, Germany). Capillary voltage was 1.5–2 kV and a dry gas flow rate of 10 L/min was used with a temperature of 230°C. The scan range used was from 300 to 1800 m/z. Protein identification was performed by searching the National Center for Biotechnology Information non-redundant database (NCBInr, version 20081128, www.ncbi.nlm.nih.gov) using the Mascot program (in-house version 2.2, Matrix Science London, UK). The following parameters were adopted for database searches: complete carbamido methylation of cysteines and partial oxidation of methionines, peptide mass Tolerance 71.2 Da, fragment mass tolerance 70.9 Da, missed cleavages 2. For positive identification, the score of the result of (10LogP) had to be over the significance threshold level (po05). Although high Mascot scores are obtained with values greater than 60, when proteins were identified with only one peptide, a combination of automated database search and manual interpretation of peptide
18
fragmentation spectra was used to validate protein assignments. In this manual verification, the mass error, the presence of fragment ion series and the expected prevalence of C-terminus containing ions (Y-type) in the high mass range were all taken into account. Moreover, replicate measurements have confirmed the identity of these protein hits Sequencing of A2 cleavage fragments Thrombin digested rFVIII preparations (30 mg) were run on 5–16% w/v acrylamide gradient gel at 50 mA and transferred for 2 h at 100 mA on a Hybond-P PVDF membrane in 10mM CAPS, 10% ethanol (pH 11.0). After staining with Coomassie blue, visible bands (molecular mass between 36.0 and 45.0 kDa) were cut and subjected to N-terminal sequencing for ten cycles, using an automatic protein microsequencer Prosize 492 cLC (Applied Biosystems). Amounts of protein sequenced 0.5 pM were considered significant and above the background level associated with the experimental conditions. All sequences were identified as thrombin cleavage fragments of rFVIII.
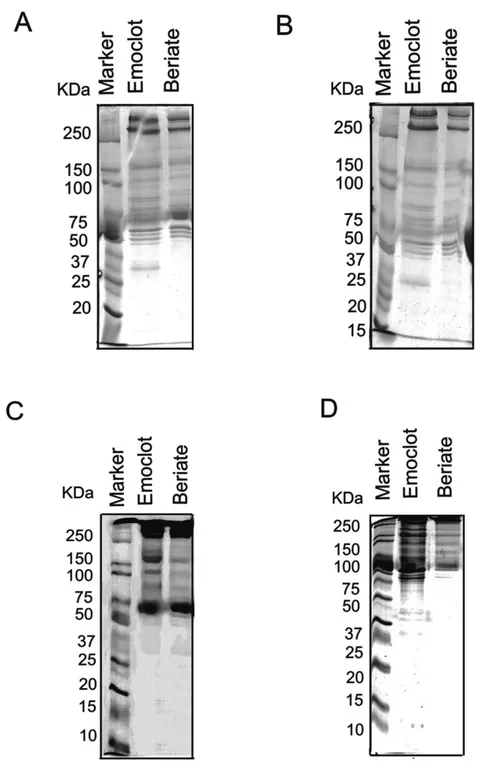
2.3 Results
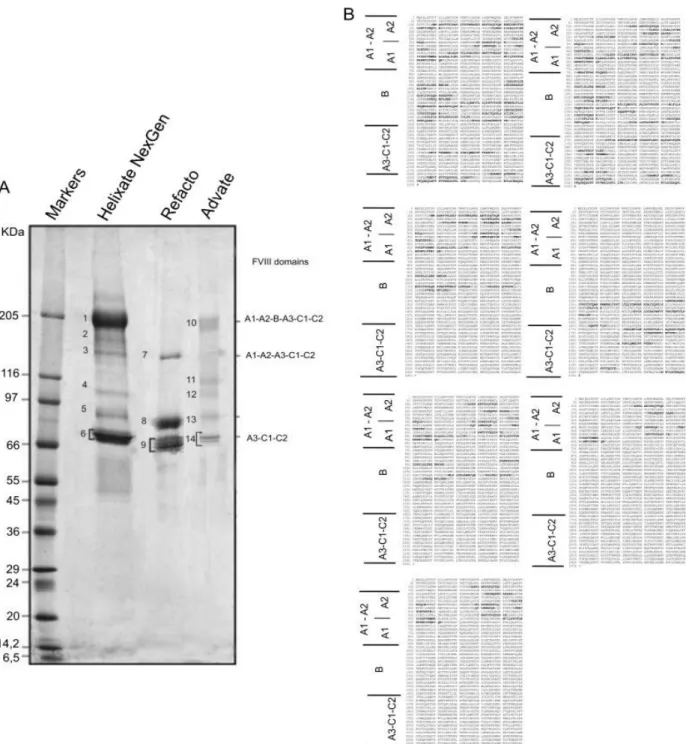
To evaluate the structural heterogeneity, the presence of contaminants in rFVIII samples and the effect of thrombin cleavage, SDS-PAGE was carried out on both intact (Fig. 3) and thrombin-digested (Fig. 4) preparations from three commercial products: Helixate NexGen®, Refacto® and Advate®. 1-D gel of Helixate NexGen® and Advate® (Fig. 3A) showed multiple bands in the region between 180 and 110 kDa (bands 2, 3, 4 and 11, 12). In the case of Refacto®, only one band was observed at 170 kDa (band 7), corresponding, as expected, to the entire protein expressed without B domain and plus the two main bands at 90 and 80 kDa (bands 8, 9). To identify these bands, gel bands were subjected to an in-gel tryptic digestion and the proteins were identified by MS (Table 1) Figure 3B reports in bold the peptides identified by MS/MS in each band; this determined that all the bands observed in Helixate NexGen® and Advate® between 180 and 110 kDa are truncated forms of the full-length protein, where most cleavage occurs in the B domain. The intensity and the number of these bands were predominant in the second generation of FLrFVIII material from BHK cells (Helixate NexGen®) rather than in third generation FLrFVIII material from CHO cells (Advate®). Clearly, these truncated forms are absent in Refacto®, in which the expressed gene is B-domain deleted. Otherwise, FLrFVIII preparations Helixate® and Advate®, showed a similar banding pattern, with a major species at 200 kDa corresponding to the full length protein (A1-A2-B-A3-C1-C2) containing the domain B, (respectively bands 1 and 10), and
19
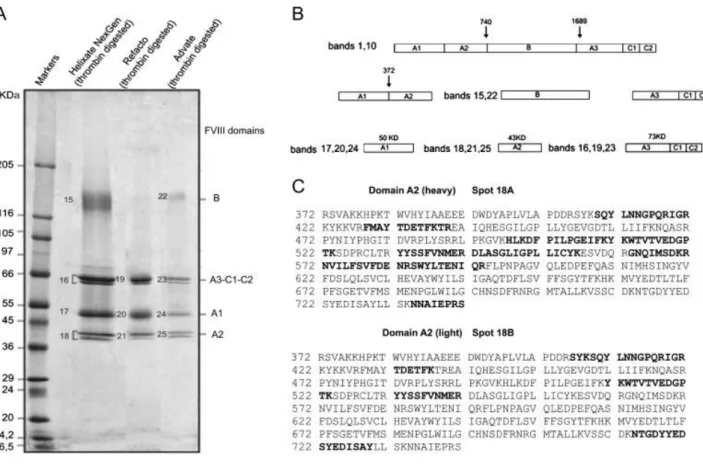
two chains: heavy at 90 kDa (A1-A2, bands 5 and 13) and light at 80 kDa (A3-C1-C2, bands 6 and 14). In Fig. 3A, two bands are recognizable as belonging to A3-C1-C2 domains in all rFVIII (bands 6, 9, 14) that differ in molecular weight of 2.5 kDa. In this case, we hypothesized that the observed bands may be produced upon differential cleavage of the protein or rather result from different glycosylation moieties. The last hypothesis is perhaps more reliable, as it can be supported with observations from literature, such as Shen et al. who identified sites of glycosylation and metal binding in the A3-C1-C2 domains (the ‗‗light chain‘‘) studying the tertiary structure and domain organization of rFVIII. Although SDS-PAGE patterns of the rFVIII apparently differed, they were rather comparable upon thrombin digestion, which yielded similar products (Fig. 4A). Figure 4B is a schematic representation of the fragmentation pattern generated upon thrombin digestion of precursors. In the case of Helixate NexGen® and Advate®, along with the cleavage products of thrombin, which were recorded in the region between 66 and 36 kDa, the isolated B domain (bands 15 and 22) was recovered almost intact at about 135 kDA (bands 15 and 22). Thus, the heterogeneity observed above, belonging to different forms of three rFVIII, is removed upon thrombin treatment and the same final products are obtained. By MS/MS analysis of bands excised from gel, it can be assessed that after thrombin activation the precursor bands at 200 (Helixate NexGen®, Advate®), 170 (Refacto®), 90 (heavy chain) and 80 kDa (light chain) were processed to 73 (bands 16, 19, 23), 50 (bands 17, 20, 24) and 43 kDa (bands 18, 21, 25) polypeptide fragments. Bands 16, 19 and 23 correspond to A3-C1-C2 domain. Bands 17, 20, 24 (A1) and bands 18, 21, 25 (A2) originated from the cleavage of bands 5, 8, 13 (A1-A2). Interestingly, in all rFVII preparations, bands corresponding to the A2 domain were split into two bands, which differed in apparent molecular mass of about 1.5 kDa. Figure 4C reports in bold the peptides recognized by MS in A2 bands. Although MS/MS recognized that the two unexpected bands both belonged to the A2 domain, by using N-terminal sequencing, we could state that the two forms of A2 protein were present that differed in molecular weight of 1254.4 Da, corresponding to a specific peptide sequence (LLSKNNAIEPR). Thrombin digestion of A3-C1-C2 (bands 16, 19, 23 in Fig.4A) confirmed that two forms of this domain are present, even if Mascot results indicated a list of identical peptides for all of them and we were not able to apply Edman sequence, due to intrinsic technical limitation relative to high molecular weight. However, from SDS-PAGE profiles, we could state that two forms of these domains are present in the final product, which are characterized by different molecular weights.
20
*-Figure 3:(A) 1-D SDS-PAGE of three different rFVIII preparations. Forty microgram of each
rFVIII was separated on 5–16% w/vacrylamide gradient SDS gel and visualized by staining with blue silver. (B) Multiple bands in Helixate NexGen® (2, 3, 4) and Advate ® (11, 12), which represent truncated forms of the full-length protein bands 1 and 10, respectively, obtained by Mascot search. The proteins are marked by band number as reported Table 1
21
Figure 4:(A) 1-D SDS-PAGE of three different rFVIII preparations after thrombin activation.
Forty micrograms of each rFVIII was separated on 5–16% w/v acrylamide gradient SDS gel and visualized by staining with blue silver. (B) A schematic representation of the fragmentation pattern generated upon thrombin digestion of precursors. (C) Peptides recognized by MS using Matrix Science (http://www.matrixscience.com) Mascot MS/MS ion search program in A2 bands. The proteins are marked by band number as reported in Table 3.
NEX GEN®
Spot number
Protein name ID Mascot score
% p/M r Number mathced peptides NCBI Accession number 1 Coaugulation Factor VIIItutto 6.51 855 239233 19 gi|119593052 2 coagulation factor VIII [Homo
sapiens]A1A2B
6.95 1427 268250 18 gi|182383 3 coagulation factor VIII, procoagulant
component (hemophilia A), isoform CRA_b [Homo sapiens]A1A2
6.51 1075 239233 34 gi|119593052 4 coagulation factor VIII, procoagulant
component (hemophilia A), isoform CRA_b [Homo sapiens]A1A2B
6.51 843 239233 21 gi|119593052 5 Chain A, Crystal Structure Of Human
Factor VIII B
5.92 664 86866 17 gi|171849087 6 Chain A, Crystal Structure Of Human
Factor VIII B
5.92 301 86866 7 gi|171849087 7 B domain-deleted coagulation factor VIII
[synthetic construct]A1 A2 B
6.36 652 168754 20 gi|157863686 8 Chain B, Crystal Structure Of Human
Factor VIII
7.46 1124 79418 39 gi|171849088 9 Chain B, Crystal Structure Of Human
Factor VIII
22 10 Chain B, Crystal Structure Analysis Of
Coagulation Factor VIII(A3 c1 c2)
7.94 411 89376 gi|183448130
11 coagulation factor VIII, procoagulant component (hemophilia A), isoform
CRA_b [Homo sapiens]A3
6.51 465 239233 13 gi|119593052
12 proapolipoprotein 5.45 95 28944 3 gi|178775
NEX-GEN® digested with thrombin
Spot number
Protein name ID Mascot score % p/M r Number mathced peptides NCBI Accession number
1 coagulation factor VIII [Homo sapiens dominio B
6.95 598 268250 20 gi|182383 2 coagulation factor VIII [Homo sapiens] 435 268250 14 gi|182383 3 coagulation factor VIII [Homo
sapiens]B-A3
7.01 435 268250 14 gi|31499 3 heat shock 70 kDa protein 5 isoform 5.13 360 72493 7 gi|253982049 4 Chain B, Crystal Structure Analysis Of
Coagulation Factor VIII A3 C1-C2
7.94 523 89376 20 gi|183448130 5 factor VIII [Homo sapiens]c2c1 A3 7.01 771 89376 27 gi|182803 6 coagulation factor VIII, procoagulant
component (hemophilia A), isoform CRA_b [Homo sapiens]A1
6.95 1067 239233 41 gi|119593052 7 Chain A, Crystal Structure Of Human
Factor VIIICatena A2
5.92 533 86866 41 gi|171849087 7 haptoglobin [Homo sapiens] 6.27 163 38941 5 gi|1212947 8 coagulation factor VIII [Homo sapiens]
A2
7.01 325 268382 11 gi|31499 9 coagulation factor VIII, procoagulant
component [Homo sapiens]A2
6.95 114 25056 4 gi|150036899 ADVATE®
Spot number
Protein name ID Mascot score % p/M r Number mathced peptides NCBI Accession number 1 Chain B, Crystal Structure Analysis Of
Coagulation Factor VIII tutto
6.51 280 89376 8 gi|183448130 2 coagulation factor VIII [Homo
sapiens]B-C1-C2 A3
6.97 724 268337 16 gi|119593053 3 Chain A, Crystal Structure Of Human
Factor VIII B
5.92 269 86866 7 gi|171849087 4 B domain-deleted coagulation factor A1
A2 6.36
405 168754 10 gi|157863686 5 Chain B, Crystal Structure Analysis Of
Coagulation Factor VIII A3 C1C2
7.46 151 89376 4 gi|183448130 6 coagulation factor VIII, procoagulant
component (hemophilia A), isoform CRAc [Homo sapiens]C2
6.97 149 268337 4 gi|119593053 ADVATE® digested with thrombin
Spot number
Protein name ID Mascot score % p/M r Number mathced peptides NCBI Accession number 1 Chain B, Crystal Structure Analysis Of
Coagulation Factor VIII C1C2
7.94 325 59720 6 gi|183448130 2 Chain A, Crystal Structure Of Human
Factor VIII C1C2A2
5.92 452 86866 13 gi|171849087 3 Structure Of HumanFactor VIII A1
frammento più lungo 5.92
227 86866 6 gi|171849087 4 Chain A, Crystal Structure Of Human
Factor VIII A2
5.92 426 86866 13
gi|171849087 5 Chain A, Crystal Structure Of Human
Factor VIII A2 5.92 385 86866 11 gi|171849087 6 Full=Prothrombin; AltName: Full=Coagulation factor II 5.97 93 71886 3 gi|135806 REFACTO® Spot number
Protein name ID Mascot score % p/M r Number mathced peptides NCBI Accession number
23 1 B domain-deleted coagulation factor VIII
[synthetic construct]tutto 6.36
1006 168754 28
gi|157863686 2 B domain-deleted coagulation factor VIII
[synthetic construct]A1A2
6.36 1141 168754 52 gi|157863686 4 Chain B, Crystal Structure Analysis Of
Coagulation Factor VIII c2
7.94 368 89376 12 gi|183448130 5 Chain B, Crystal Structure Of Human
Factor VIII c2
7.46 1372 79418 43
gi|171849088 6 Chain B, Crystal Structure Analysis Of
Coagulation Factor VIII c2
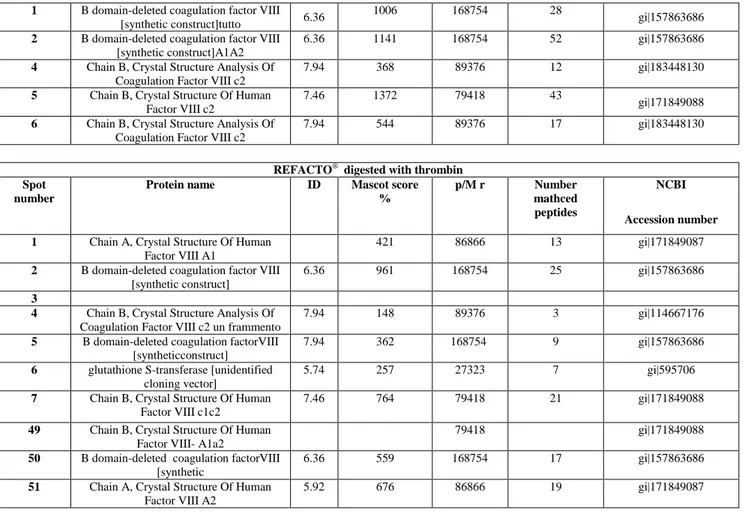
7.94 544 89376 17 gi|183448130 REFACTO® digested with thrombin
Spot number
Protein name ID Mascot score % p/M r Number mathced peptides NCBI Accession number 1 Chain A, Crystal Structure Of Human
Factor VIII A1
421 86866 13 gi|171849087 2 B domain-deleted coagulation factor VIII
[synthetic construct]
6.36 961 168754 25 gi|157863686 3
4 Chain B, Crystal Structure Analysis Of Coagulation Factor VIII c2 un frammento
7.94 148 89376 3 gi|114667176 5 B domain-deleted coagulation factorVIII
[syntheticconstruct]
7.94 362 168754 9 gi|157863686 6 glutathione S-transferase [unidentified
cloning vector]
5.74 257 27323 7 gi|595706
7 Chain B, Crystal Structure Of Human Factor VIII c1c2
7.46 764 79418 21 gi|171849088 49 Chain B, Crystal Structure Of Human
Factor VIII- A1a2
79418 gi|171849088
50 B domain-deleted coagulation factorVIII [synthetic
6.36 559 168754 17 gi|157863686 51 Chain A, Crystal Structure Of Human
Factor VIII A2
5.92 676 86866 19 gi|171849087
Table I: Identification through HPLC-ESI-MS-MS of the band obtained in monodimensional
gel of three commercially rFVIII products (Helixate NexGen®, Refacto® and Advate® before and after thrombin digestion .
2.3.1 Optimization of 2-DE protocol
Protein identification of bands observed in the first electrophoretic dimension did not reveal any contaminants besides the presence of full or truncated forms of rFVIII. Therefore, we performed a 2-DE analysis with the final aim to investigate traces of contaminants present in the three rFVIII preparations. To this regard, although 2-DE has proved to be a valuable method for the analysis of complex protein mixtures, such as blood plasma, the procedures utilized for the preparation of the samples are critical for the acquisition of high-quality results (Kim 2007). Helixate NexGen®, Refacto® and Advate® preparations are not as complex as blood plasma, although they contained recombinant proteins having the same physiochemical properties of the corresponding human plasma proteins. Protocol B differed from protocol A only for sample application method. In B, we used the cap-loading method, which produced the greatest number of detectable spots (Shevchenko1996). However, best
24
results were obtained with protocol C in which in addition to the cap-loading method, we used only 8M urea as a chaotropic agent and equilibrated the IPG strip at pH 6.8 in the presence of 3% w/v SDS. The caploading option provides simple sample loading into rehydrate IPG strip, improving sample uptake of very high molecular-weight proteins (Gorg 2004). The presence of thiourea chaotropic agents enhanced the total spot number, as shown by Pock et al. 1998 especially in the high-molecular-weight range. Our results, however, were focused on contaminants: in this respect, the reduction of pH value from 8.8 to 6.8 inequilibration buffer, increased the quality of isoelectrofocusing and the quantity of total spot number, especially in the range of 45-36 kDa without using thiourea. The low pH value reduced the net negative charge of the acid glycoprotein promoting the SDS binding and facilitating the transfer to the second dimension gel. On the basis of this improvement in 2-D map quality, protocol C was chosen to perform the rFVIII preparations analysis (Fig. 5).
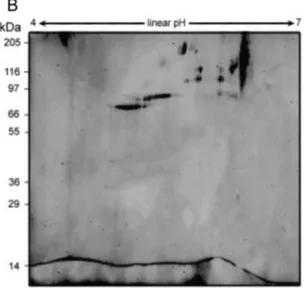
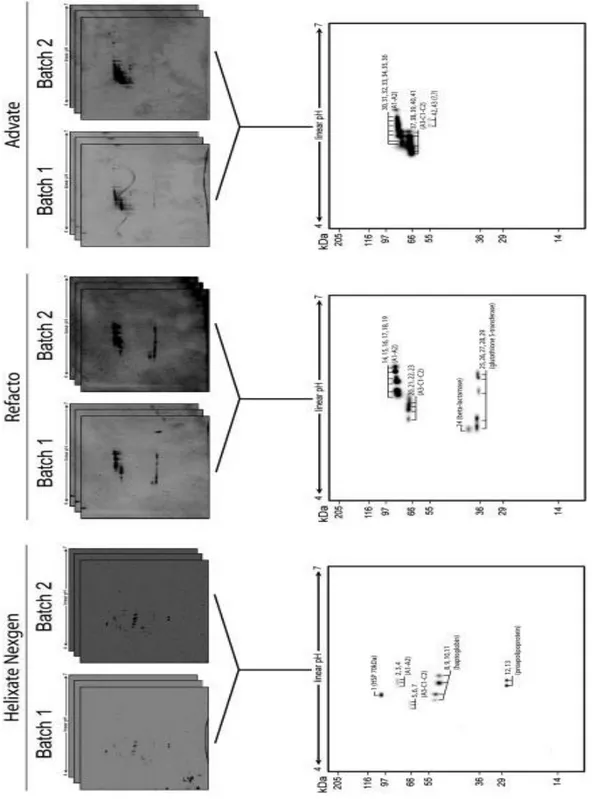
2.3.2 Analysis of FVIII preparation by 2-D IEF-SDS PAGE
Two batches of three approved rFVIII preparations obtained from different manufacturers were analyzed by 2-D IEF-SDS- PAGE (Fig. 6) using the tested protocol C (see above). To evaluate the batch-to-batch reproducibility, three technical replicates were performed for each batch. Image analyses showed a high batch-to-batch reproducibility of the protein composition for all the three rFVIII preparations. The majority of the detected spots (Helixate NexGen®, 98.3%; Refacto®, 99.2%; Advate®, 99.1%) did not differ between the two batches for each of the rFVIII preparation analyzed (Brigulla 2006). A match set was created matching the protein patterns of six replicate gels for each rFVIII preparation including only those spots that were present in at least five technical replicates. Gel spots form Helixate NexGen®, Refacto® and Advate® master maps were subjected to an in-gel tryptic digestion and the proteins contained in each were identified by MS. Comparison of the 2-DE protein
25
Figure 5: Comparison of three different IEF procedures (panels A, B and C) for the 2-DE
analysis of Refacto preparation. The proteins (about 400 mg) were first separated in a linear pH gradient of 4–7, followed by separation in an SDS-PAGE (11%) and Blue Silver staining. For a detailed description of separation protocols.
and the proteins contained in each were identified by MS. Comparison of the 2-DE protein patterns revealed major differences in the protein composition among the three rFVIII preparations obtained from the different manufacturers. In all the three rFVIII preparation 2-DE maps, it was possible to characterize the A1-A2 heavy chain (Helixate NexGens® spots: 2, 3, 4; Refacto® spots: 14, 15, 16, 17, 18, 19; Advate ®spots: 30, 31,32, 33, 34, 35, 36) and the A3-C1-C2 light chain (Helixate NexGen® spots: 5, 6, 7; Refacto® spots: 20, 21, 22, 23; Advate® spots: 37, 38, 39, 40, 41). Curiously, both heavy and light chains showed a different
26
number of isoforms among the rFVIII preparations. Helixate NexGen® 2-DE map showed to contain three protein spots derived from the manufacturing process: (i) spot 1, which was identified as the heat shock protein 70 kDa; (ii) spots 8, 9, 10 and 11 identified as the plasma glycoprotein haptoglobin; and (iii) spots 12 and 13 identified as the plasma lipoprotein proapolipoprotein. All these proteins were identified in Homo sapiens. Some isoforms of the glutathione S-transferase (spots 25, 26, 27, 28 and 29) and the TEM extended spectrum b-lactamase from Escherichia coli were found in Refacto®. On the contrary, it was not possible to identify any anomalous contaminant in the Advate® preparation, although two anomalous spots (42 and 43) from the 2-DE map were not identified.
27
Figure 6:Representative Blue Silver stained 2-D gels of proteins from Helixate NexGens®, Refacto® and Advates®.(A) For each approved rFVIII preparation were analyzed two batches. For each batch were performed three technical replicate. (B) Master maps created matching the proteins that were present in at least five technical replicates on six. The proteins are marked by band number as reported in Table 3.
28 Spo t No. m/z charge state start-end a sequence Mascot Ion Score NCBI Accession Number Protein ID 1 743.98 833.04 600.06 495.06 659.97 2 + 2 + 2 + 2 + 2 + 37-49 57-71 160-171 510-517 540-550 TTPSYVAFTDTER NQVAMNPTNTVFDAKOxidation (M) DAGTIAGLNVLI LSKEDIER NSLESYAFNMKOxidation (M) 50 52 46 28 49
gi|5729877 heat shock 70kDa protein 8 isoform 1 [Homo sapiens] 2 992.00 778.87 821.41 750.96 440.12 717.89 555.26 665.30 777.38 816.96 726.86 2 + 2 + 3 + 2 + 2 + 2 + 2 + 2 + 2 + 2 + 2 + 109-126 127-140 141-161 186-199 233-239 233-245 260-269 345-355 379-391 561-575 591-602 NMASHPVSLHAVGVSYWK ASEGAEYDDQTSQR EKEDDKVFPGGSHTYVWQVLK DLNSGLIGALLVCR NSLMQDROxidation (M) NSLMQDRDAASAR SLPGLIGCHR VDSCPEEPQLR FDDDNSPSFIQIR DLASGLIGPLLICYK NVILFSVFDENR 61 87 50 57 42 57 40 47 60 34 64 gi|119593052
coagulation factor VIII procoagulant component (hemophilia A) isoform CRA_b [Homo sapiens] A1-A2 3 751 665 777 588 634 616 656 816 726 2 + 2 + 2 + 2 + 2 + 2 + 2 + 2 + 2 186-199 345-355 379-391 428-437 447-456 532-542 551-560 561-575 591-602 DLNSGLIGALLVCR VDSCPEEPQLR FDDDNSPSFIQIR SQYLNNGPQR FMAYTDETFK Oxidation (M) WTVTVEDGPTK YYSSFVNMER DLASGLIGPLLICYK NVILFSVFDENR 58 45 59 66 38 56 57 47 58 gi|119593052
coagulation factor VIII, procoagulant component
(hemophilia A), isoform CRA_b [Homo sapiens]
A1-A2 4 778.871 751.024 440.188 484.208 555.232 665.324 777.874 588.816 509.223 2 + 2 + 2 + 3 + 2 + 2 + 2 + 2 + 3 + 127-140 186-199 233-239 233-245 260-269 345-355 379-391 428-437 447-458 ASEGAEYDDQTSQR DLNSGLIGALLVCR NSLMQDR Oxidation (M) NSLMQDRDAASAR Oxidation (M) SLPGLIGCHR VDSCPEEPQLR FDDDNSPSFIQIR SQYLNNGPQR FMAYTDETFKTR Oxidation (M) 93 46 39 47 37 39 69 57 41 gi|182383
coagulation factor VIII [Homo sapiens] A1-A2 5 553.219 555.255 588.813 720.371 704.925 495.228 722.281 2 + 3 + 2 + 2 + 3 + 2 + 2 + 135-143 144-157 160-170 203-214 339-355 678-687 759-770 HYFIAAVER LWDYGMSSSPHVLR Oxidation (M) AQSGSVPQFK AEVEDNIMVTFR Oxidation (M) APCNIQMEDPTFKENYR Oxidation (M) VTGVTTQGVK MEVLGCEAQDLY Oxidation (M) 35 38 34 63 42 46 78 gi|183448130 Chain B Crystal Structure Analysis Of Coagulation Factor VIII
A3-C1-C2 6 525.15 560.92 720.29 722.27 681.75 710.27 479.23 646.32 596.73 683.24 495.21 529.21 848.95 2 + 3 + 2 + 2 + 2 + 3 + 3 + 2 + 2 + 2 + 2 + 2 + 3 + 1741-1750 1769-1783 1784-1795 1853-1864 1907-1916 1920-1936 2092-2104 2156-2166 2247-2255 2256-2268 2259-2268 2269-2277 2301-2323 AQSGSVPQFK GELNEHLGLLGPYIR AEVEDNIMVTFROxidation (M) AWAYFSDVDLEK SWYFTENMER APCNIQMEDPTFKENYROxidation (M) VDLLAPMIIHGIKOxidation (M) HNIFNPPIIAR EWLQVDFQK TMKVTGVTTQGVKOxidation (M) VTGVTTQGVK SLLTSMYVKOxidation (M) VFQGNQDSFTPVVNSLDPPLLTR 46 44 67 54 36 45 41 42 26 35 62 44 41
gi|182803 factor VIII [Homo sapiens] A3C1C2
29 7 826.3090 667.353 553.325 832.415 524.748 1.017.527 560.95 720.37 614.952 722.841 689.835 775.893 836.168 778.784 481.895 898.971 732.844 718.463 646.353 495.263 529.27 848.802 792.944 714.23 3+ 3 + 2 + 2 + 2 + 2 + 3 + 2 + 3 + 2 + 2 + 2 + 3 + 3 + 3 + 2 + 2 + 2 + 2 + 2 + 2 + 3 + 2 + 2 + 5-25 26-41 49-57 58-71 74-83 85-101 102-116 117-128 171-185 186-197 240-249 253-265 270-291 325-344 373-385 386-401 405-417 425-437 489-499 592-601 602-610 634-656 660-672 673-684 TTLQSDQEEIDYDDTISVEMK Oxidation (M) KEDFDIYDEDENQSPR HYFIAAVER LWDYGMSSSPHVLR AQSGSVPQFK VVFQEFTDGSFTQPLYR GELNEHLGLLGPYIR AEVEDNIMVTFR VQHHMAPTKDEFDCK AWAYFSDVDLEK SWYFTENMER APCNIQMEDPTF FHAINGYIMDTLPGLVMAQDQR MALYNLYPGVFETVEMLPSK CQTPLGMASGHIR DFQITASGQYGQWAPK LHYSGSINAWSTK VDLLAPMIIHGIK HNIFNPPIIAR VTGVTTQGVK SLLTSMYVK VFQGNQDSFTPVVNSLDPPLLTR IHPQSWVHQIALR MEVLGCEAQDLY 30 58 43 71 32 65 45 70 31 53 42 64 47 50 65 77 67 35 38 52 36 81 48 77 gi|171849088 Chain B Crystal Structure Of Human Factor VIII A3-C1-C2 8 462.10 471.61 490.57 380.52 862.14 637.64 729.81 673.05 602.11 2 + 2 + 2 + 2 + 2 + 2 + 3 + 2 + 2 + 103-111 195-202 219-227 233-238 239-252 253-263 267-286 321-332 333-342 ILGGHLDAK QKVSVNER.VGln->pyro-Glu (N-term Q) VGYVSGWGR FTDHLK YVMLPVADQDQCIROxidation (M) HYEGSTVPEKK SPVGVQPILNEHTFCAGMSKOxidation (M) SCAVAEYGVYVK VTSIQDWVQK 42 28 51 28 72 42 49 77 52 gi|1212947 haptoglobin [Homo sapiens] 9 462.24 673.25 602.32 2 + 2 + 2 + 101-109 319-330 331-340 ILGGHLDAK SCAVAEYGVYVK VTSIQDWVQK 26 41 54 gi|1212947 Haptoglobin [Homo sapiens] 10 462.02 460.46 471.46 617.64 490.48 862.00 573.47 729.68 673.61 601.97 2 + 2 + 2 + 3 + 2 + 2 + 2 + 3 + 2 + 2 + 103-111 112-119 195-202 203-218 219-227 239-252 253-262 267-286 321-332 333-342 ILGGHLDAK GSFPWQAK QKVSVNERGln->pyro-Glu (N-term Q) VMPICLPSKDYAEVGR.Oxidation (M) VGYVSGWGR YVMLPVADQDQCIR.Oxidation (M) HYEGSTVPEK. SPVGVQPILNEHTFCAGMSK. SCAVAEYGVYVK. VTSIQDWVQK. 36 28 30 26 48 77 27 48 38 49 gi|1212947 haptoglobin [Homo sapiens] 11 462.02 460.46 471.46 617.64 490.48 862.00 573.44 729.68 673.61 601.97 2 + 2 + 2 + 3 + 2 + 2 + 2 + 3 + 2 + 2 + 103-111 112-119 195-202 203-218 219-227 239-252 253-262 267-286 321-332 333-342 ILGGHLDAK GSFPWQAK QKVSVNER VMPICLPSKDYAEVGR VGYVSGWGR YVMLPVADQDQCIROxidation (M) HYEGSTVPEK SPVGVQPILNEHTFCAGMSKOxidation (M) SCAVAEYGVYVK VTSIQDWVQK 36 28 30 26 48 77 27 48 38 49 gi|1212947 haptoglobin [Homo sapiens] 12 700.96 434.47 405.834 2 + 3 + 3+ 52-64 185-195 220 - 230 DYVSQFEGSALGK THLAPYSDELR ATEHLSTLSEK 31 39 26 gi|178777 proapolipoprotein