from 50 GeV to 10 TeV with the Calorimetric Electron Telescope
on the International Space Station
(CALET Collaboration) (Dated: April 6, 2019)
Supplemental material relative to “Direct Measurement of the Cosmic-Ray Proton Spectrum from 50 GeV to 10 TeV with the Calorimetric Electron Telescope on the International Space Station.”
DATA ANALYSIS
We describe the analysis procedure in three steps as follows. Although some of the descriptions are duplicate with the main text, we have included them here for completeness.
Event Selection
The first step is selection of proton candidate events. The selection criteria to select proton events are optimized and defined using MC simulations consisting of protons, helium and electrons. The same criteria are applied to both of the Flight Data (FD) and MC data (MC).
In order to minimize and to accurately separate protons from helium in charge identification, it is important to preselect well reconstructed and well contained events. Furthermore, by removing events not included in the MC samples, i.e., those with incidence from zenith angle greater than 90◦ and mis-reconstructed events, event samples equivalent between FD and MC were obtained to be fed into charge identification. This is the most important purpose of the preselection, which consists of (1) offline trigger confirmation, (2) geometrical condition, (3) track quality cut, (4) electron rejection cut, (5) off-acceptance events rejection cut, (6) requirement of track consistency with TASC energy deposits, and (7) shower development requirement in IMC. Each of the above selections are described in more detail in the following, and finally the charge identification based on CHD and IMC energy deposits is described. For the detailed description of the detector components used in the event selections, readers are referred to the Supplemental Material of Ref. [1] and/or Refs. [2, 3].
(1) Offline trigger confirmation
A first event selection is the onboard high energy shower trigger (HE trigger). This trigger uses a simple trigger condition which selects showering particles above 10 GeV by requiring large energy deposits in the middle of the detector, i.e., energy deposit sums of IMC-X7+X8, IMC-Y7+Y8 and TASC-X1 to exceed certain thresholds in coin-cidence [3]. Since the HE trigger is working onboard, it is affected by position dependence, temperature dependence, and temporal variation of the detector gain. In order to obtain consistency between MC and FD in a simple way by removing such complicated effects, an offline trigger is applied as a first step of preselection, which requires sufficiently severer conditions than the onboard HE trigger. After applying all the calibration, the offline trigger requires that the energy deposit sums of IMC-X7+X8, IMC-Y7+Y8 and TASC-X1 have to be greater than 50 MIP, 50 MIP and 100 MIP, respectively, where one MIP corresponds to the energy deposit of minimum ionizing vertical muons at 2 GeV, i.e. 1.66 MeV for CHD paddle, 0.145 MeV for IMC fiber and 20.47 MeV for TASC log.
When analyzing events triggered by low-energy (LE) trigger which selects showering particles above 1 GeV, the offline trigger confirmation uses lower thresholds, i.e., 5 MIP for IMC-X7+X8, IMC-Y7+Y8 and 10 MIP for TASC-X1.
(2) Geometrical condition
In order to ensure the accuracy of charge selection and energy measurement, it is required that the reconstructed track must pass through the whole detector, i.e., from CHD top to TASC bottom, with 2 cm margin from the sides of the TASC, which is defined as Acceptance A. All the geometrical conditions are summarized in the Supplemental Material of Ref. [4] for reference.
(3) Track quality cut
Combinatorial Kalman Filter (KF) tracking [5] was developed to reconstruct the proton tracks in a highly efficient way, and is used in this analysis. In order to ensure track quality, the algorithm for the tracking is required to be KF tracking or shower fit in X-Z and Y-Z projection, and the χ2 of the fits to be less than 10 in both projections.
(4) Electron rejection cut
In order to reject electrons especially in the lowest energy region, Moliere concentration along the track is defined as follows: for each IMC layer crossed by the track, a Moliere concentration is calculated summing all energy deposits found inside one Moliere radius (±9 fibers) of each fiber matched to the track. Then the energy deposit sum within one Moliere radius is divided by the total energy deposit sum in IMC. By requiring this quantity to be less than 0.7, most of electrons are rejected while keeping very high efficiency for protons.
(5) Off-acceptance events rejection cut
Off-acceptance events are defined as those reconstructed as Acceptance A, but for which the true acceptance does not fulfill the condition of Acceptance A. Rejection of such off-acceptance events are necessary to precisely determine geometrical acceptance. The off-acceptance events consist dominantly of protons and helium. Since off-acceptance helium might not be separated in the charge selection due to the fact that secondaries (mostly pions) have charge one, such helium contamination also needs to be minimized.
The off-acceptance cut uses two discrimination variables. The first variable is the maximum fractional energy deposit in a single TASC layer. It is required to be less than 0.4 to reject laterally incident events. This selection is especially effective for TASC-X1 because it is used for trigger. The second variable is the maximum energy deposit ratio of the edge logs to the maximum log in each layer. Events are rejected if this variable is greater than 0.4. This cut is effective to remove events which exit from the side of TASC. Those selections have very high efficiency while not depending on the track reconstruction.
(6) Requirement of track consistency with TASC energy deposits
In order to further reject mis-reconstructed events, a consistency cut is defined between tracks and centers of gravity of energy deposits in TASC-X1 and TASC-Y1 layers. Energy dependent thresholds are defined using MC simulation to have a constant efficiency of 95% for events that interacted in IMC below the 4th layer, which are suitable for determining charge, energy, and trigger efficiency (hereafter denoted as “target” events).
(7) shower development requirement in IMC
Since a fraction of events triggered by backscattering is not reproduced well by the simulations, rejection of such events is important. For this purpose, the energy deposit sum along the shower axis over ±9 fibers (in total 19 fibers) is used to ensure the existence of a shower core in IMC. This definition differs from the one used for electrons considering the wider lateral spread of hadronic showers. In order to fully exploit the rejection capability of events triggered by backscattering, it is important to set an appropriate threshold as a function of energy. Energy dependent thresholds are defined to get 99% efficiency for “target” events.
Charge identification
Based on the preselected samples, charge identification is performed using the CHD and the IMC [6]. The latter samples the ionization deposits in each layer, thereby providing a multiple dE/dx measurement with a maximum of 16 samples along the track. The interaction point is first reconstructed [7] and only the dE/dx ionization clusters from the layers upstream the interaction point are used. The charge value is evaluated as a truncated-mean of the valid samples with a truncation level set at 70%.
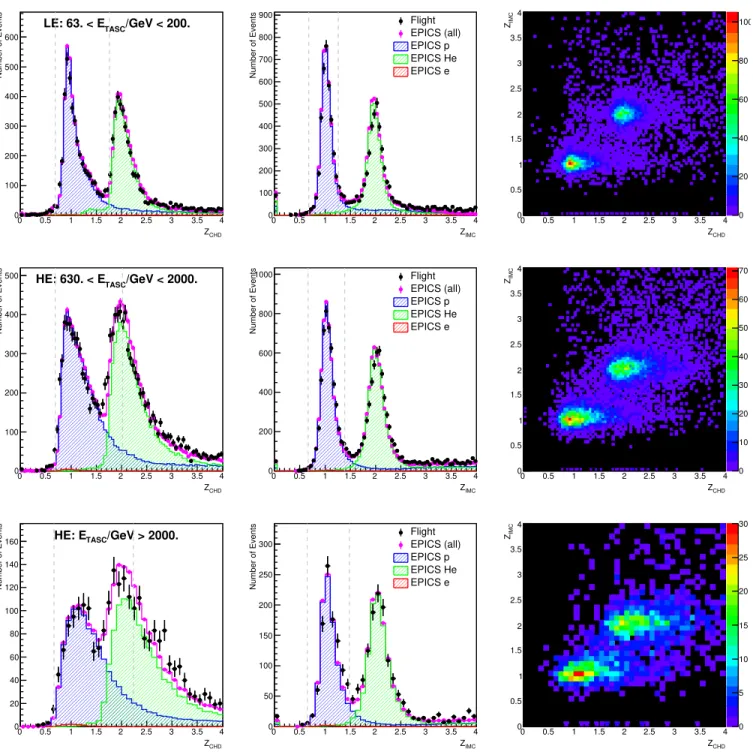
To mitigate the backscattering effects, an energy dependent charge correction to restore the nominal peak positions of protons and helium to Z = 1 and 2 is applied separately to FD, EPICS, FLUKA and Geant4. Charge selection of proton and helium candidates is performed by applying simultaneous window cuts on CHD and IMC reconstructed charges. The resultant charge distributions are exemplified in Fig. 1. For the selection with CHD and IMC, energy dependent thresholds are defined separately to keep 95% efficiency for “target” events.
CHD Z 0 0.5 1 1.5 2 2.5 3 3.5 4 Number of Events 0 100 200 300 400 500 600 /GeV < 200. TASC LE: 63. < E IMC Z 0 0.5 1 1.5 2 2.5 3 3.5 4 Number of Events 0 100 200 300 400 500 600 700 800 900 Flight EPICS (all) EPICS p EPICS He EPICS e CHD Z 0 0.5 1 1.5 2 2.5 3 3.5 4 IMC Z 0 0.5 1 1.5 2 2.5 3 3.5 4 0 20 40 60 80 100 CHD Z 0 0.5 1 1.5 2 2.5 3 3.5 4 Number of Events 0 100 200 300 400 500 /GeV < 2000. TASC HE: 630. < E IMC Z 0 0.5 1 1.5 2 2.5 3 3.5 4 Number of Events 0 200 400 600 800 1000 Flight EPICS (all) EPICS p EPICS He EPICS e CHD Z 0 0.5 1 1.5 2 2.5 3 3.5 4 IMC Z 0 0.5 1 1.5 2 2.5 3 3.5 4 0 10 20 30 40 50 60 70 CHD Z 0 0.5 1 1.5 2 2.5 3 3.5 4 Number of Events 0 20 40 60 80 100 120 140
160 HE: ETASC/GeV > 2000.
IMC Z 0 0.5 1 1.5 2 2.5 3 3.5 4 Number of Events 0 50 100 150 200 250 300 Flight EPICS (all) EPICS p EPICS He EPICS e CHD Z 0 0.5 1 1.5 2 2.5 3 3.5 4 IMC Z 0 0.5 1 1.5 2 2.5 3 3.5 4 0 5 10 15 20 25 30
FIG. S1. Examples of CHD/IMC charge distributions. Left, center and right panels show the CHD charge, IMC charge and correlation between CHD and IMC charges, respectively. From top to bottom, the plots corresponds to events with 63 < ETASC< 200 GeV, 630 < ETASC< 2000 GeV, and ETASC> 2000 GeV, respectively. Gray dashed lines indicate the cut positions at 110 GeV (Top), 1100 GeV (Middle) and 3600 GeV (Bottom).
Background Contamination
Background contamination is estimated from the MC simulation of protons, helium and electrons as a function of observed energy, where the previous observations, i.e., AMS-02 [8, 9] and CREAM-III [10], are used to simulate their spectral shape. Among them, the dominant component is off-acceptance protons except for the highest energy region ETASC∼ 10 TeV, where helium contamination becomes dominant. Overall contamination is estimated below
a few percent, and at maximum ∼5% in the lowest and highest energy region. The correction is carried out before performing the energy unfolding procedure.
In the lower energy region, the mis-reconstruction probability for protons is higher, due to the poorer reconstruction of the TASC shower axis caused by the less prolate shower shapes at these energies. For helium, this mis-reconstruction probability is much lower due to larger energy deposits in each hit produced by a primary track in IMC. This is the main reason behind the higher contamination ratio due to off-acceptance protons in the low energy region. In the higher energy region above 1 TeV, the effect of backscattering gets more and more significant and therefore the helium dominates the total contamination at the highest energy region although it is still sufficiently small not to significantly influence the proton spectrum.
Energy Unfolding
In order to take into account the relatively limited energy resolution, energy unfolding is necessary to correct for bin-to-bin migration effects. For reference, the observed energy fraction is around 35% and the resultant energy resolution is 30–40% in the energy region analyzed here. As an energy unfolding method in this analysis, we used the Bayesian approach implemented in the RooUnfold package [11, 12] in ROOT [13], with the response matrix derived using MC simulation. Convergence is obtained within two iterations, given the relatively accurate prior distribution obtained from the previous observations, i.e., AMS-02 [8] and CREAM-III [10].
Though CALET calorimeter is homogeneous, practically most of calorimeters are non-compensating to a certain degree. Therefore, a correction for electrons is not necessarily the same as for protons. Because of the limited energy resolution, an absolute energy scale calibration using geomagnetic rigidity cutoff used in Refs. [1, 4] could not be performed.
Consistency between LE and HE Analyses
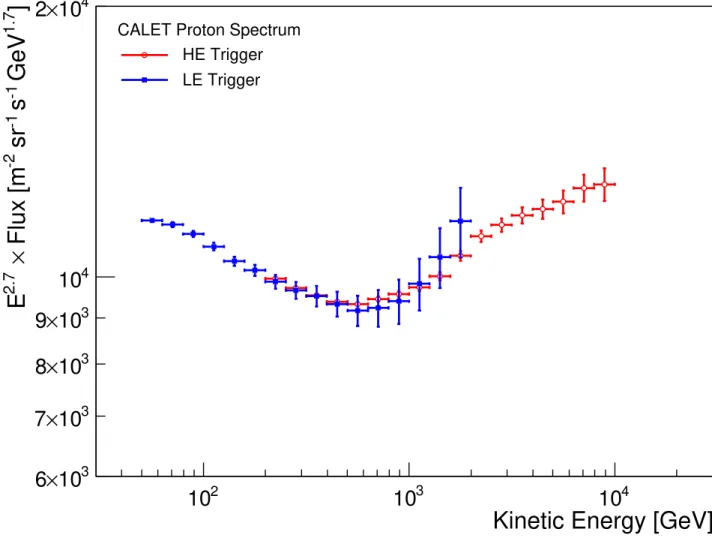
Depending on the on-orbit trigger mode and corresponding offline-trigger threshold, two spectra are obtained with the LE and HE analyses, respectively, as shown in Fig. 2. For E < 200 GeV, the use of LE-trigger analysis is required because an offline trigger threshold higher than in the hardware trigger was found to introduce an efficiency bias in the HE-trigger analysis, which became evident with a scan of the offline-trigger threshold using LE-trigger data. Since both fluxes are well consistent in E > 200 GeV, they are combined around E ∼ 300 GeV, taking into account the different statistics of the two trigger modes.
SYSTEMATIC UNCERTAINTIES
Dominant sources of systematics uncertainties in proton analysis include: (1) hadronic interaction modeling,
(2) energy response,
(3) track reconstruction, and (4) charge identification.
To address these uncertainties, various approaches are used and discussed in the following. An important part of systematics comes from the accuracy of the beam test calibration and its extrapolation/interpolation. The stability of the measured spectrum against variations of several analysis cuts is also a crucial tool to estimate the associated uncertainties.
Most of the systematic uncertainties in normalization are taken from the studies performed for the electron analysis. This uncertainty is estimated as 4.1% based on the electron spectrum paper [1], as the sum in quadrature of the uncertainties on live time (3.4%), radiation environment (1.8%), and long-term stability (1.4%).
Hadronic interaction: The uncertainty in the hadronic interaction affects directly the trigger efficiency and it is also closely connected to the uncertainty in the energy response, as discussed separately in the following. In the low-energy region, the absolute calibration of the trigger efficiency was performed at the beam test. The main source of uncertainty comes from the accuracy of the calibration. In addition to the measurement accuracy, possible systematic
Kinetic Energy [GeV]
210
10
310
4]
1.7GeV
-1s
-1sr
-2Flux [m
×
2.7E
310
×
6
310
×
7
310
×
8
310
×
9
410
410
×
2
CALET Proton Spectrum
HE Trigger
LE Trigger
FIG. S2. Proton spectrum from two data sets corresponding to LE-trigger (blue squares) and HE-trigger (red circles) analyses.
bias due to normalization in the measurements of trigger efficiency was considered as a systematic uncertainty and is estimated as 2.2% and 3.3% for HE and LE analyses, respectively.
In the high-energy region, a non-trivial extrapolation from the maximum available beam energy, i.e. 400 GeV, is necessary. To address this uncertainty, the relative differences between different MC models, i.e., FLUKA and Geant4 versus EPICS were investigated as shown in Fig. S3. In the FLUKA and Geant4 simulation, the same corrections for EPICS were applied, as determined from the beam test data. It should be noted that other effects such as the difference in backscattering treatment and energy responses are also included in this study. Considering that (i) there is good consistency between LE and HE analyses, (ii) EPICS is directly calibrated with beam test data, (iii) backscattering at higher energies is better simulated in EPICS than in Geant4 and FLUKA [1] and (iv) the difference in the energy response among the 3 MC models show only little energy dependence one half of the differences have been included in the energy dependent systematics (see the comments in the caption of Fig. S3). The difference between DPMJET-III (reference) and EPOS was also studied, but it was found to be completely negligible in the energy range considered here, mainly because the use of EPOS is allowed only above 20 TeV.
Energy response: The uncertainty in the energy response is closely related to the uncertainty in the modeling of the hadronic interaction. As in the case of the uncertainty of the trigger efficiency, the absolute calibration of the energy response was performed using the beam test data in the low-energy region. The main source of uncertainty in the energy response comes from the accuracy of the calibration, with dominant contributions from the uncertainty in temperature of±0.5o, which translates into 2.8% energy scale uncertainty.
As in the beam test analysis only 3 TASC logs per layer were used, the difference of the spectrum obtained with energy measurements between 3 TASC logs (the one associated with the track and the two lateral neighbors) and the
whole TASC sum (used in this analysis) is considered as the correction factor. In addition to that, one half of the correction is included as upper and lower systematic error.
In the high-energy region, significant extrapolation from the maximum beam energy, i.e. 400 GeV, is necessary, which is taken into account as MC model dependence.
While the beam test correction basically addresses the relation between the primary energy and the mean shower energy, the effect of energy resolution should also be considered. Separate unfolding procedures with TASC energy sum including the log being hit±2, ±3, and ±5 neighbors are applied and the stability of the spectrum is included in the systematics, where stability is defined as the standard deviation of the relative differences in each energy bin with respect to the reference flux.
Track reconstruction: It is not easy to directly assess the uncertainty in track reconstruction. However, since tracking is the basis of most of the analysis, especially for the track-dependent selection cuts, the effects are evaluated by studying the dependence on the charge cut and some pre-selection cuts, especially (2), (6) and (7). To investigate the uncertainty in the definition of the acceptance, restricted acceptance regions are studied and the resultant fluxes are compared, resulting in negligible differences. Regarding cut (6), efficiencies were varied by ∼ +20%, ∼ +10%,
±0%, ∼ −20%, and ∼ −40% (corresponding to 99%, 97%, 95%, 90% and 85% efficiencies for ”target” events), and
the relative differences with respect to the reference cases were obtained for each energy bin. The standard deviation of the relative differences were considered as systematic uncertainty associated with cut (6). As per cut (7), a tighter cut is used with an efficiency for ”target” events of 95% instead of 99%. The relative differences with respect to the nominal case (99% efficiency) are considered as the systematic uncertainty, which are applied to both positive and negative sides.
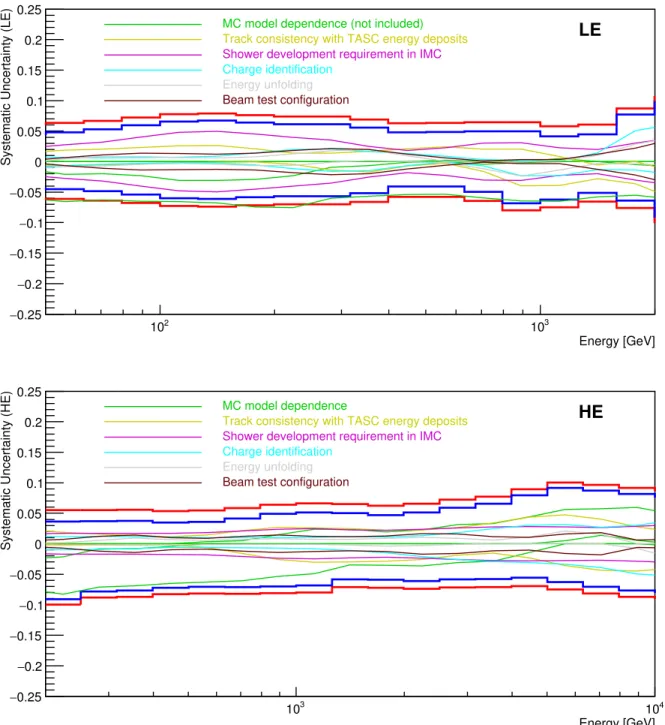
Charge identification: As helium contamination is one of the main uncertainties in the proton spectrum analysis especially in the high energy region, it is very important to study the flux stability against charge cut efficiencies considering that the contamination ratio from helium may depend on the same cuts. The stability against the charge cut efficiency is shown in Fig. S4 for LE- and HE-trigger analyses. They are included in the systematic uncertainty. Total systematic uncertainty: Considering all of the above contributions, blue long-dashed and red solid lines of Fig. S4 show the total systematic uncertainty for LE and HE analyses, respectively, as a function of primary energy in the proton spectrum analysis. For reference, a breakdown of the individual energy dependent systematic uncertainties in LE and HE analyses is shown in Fig. S5.
Kinetic Energy [GeV] 2 10 103 104 Relative Difference 0.5 − 0.4 − 0.3 − 0.2 − 0.1 − 0 0.1 0.2 0.3 0.4 0.5
LE: MC model dependence
FLUKA/EPICS Geant4/EPICS
HE: MC model dependence
FLUKA/EPICS Geant4/EPICS
FIG. S3. Relative difference of the measured flux when different MC simulations are used with respect to the EPICS case. FLUKA/EPICS and Geant4/EPICS are shown as magenta circles and cyan squares, respectively. Open (closed) symbols are used for LE-trigger (HE-trigger) analysis. The upper (lower) bound of the energy region used in LE (HE) analysis is shown by the dashed line on the left (right) side of the picture. The two analyses are combined at 300 GeV as indicated by dotted line. The relatively larger difference between FLUKA and EPICS appears to be caused by different normalization as FLUKA and Geant4 curves are practically parallel. Considering the fact that EPICS has been validated with beam-test measurements in the low-energy region, we have conservatively attributed one-half of the difference between FLUKA/Geant4 and EPICS as energy dependent systematic uncertainty.
Kinetic Energy [GeV] 2 10 103 104 Systematic Uncertainty 0.25 − 0.2 − 0.15 − 0.1 − 0.05 − 0 0.05 0.1 0.15 0.2 0.25
LE: Z-cut dependence ~ +10% ε / ε ∆ ~ +5% ε / ε ∆ ~ -8% ε / ε ∆ ~ -15% ε / ε ∆
HE: Z-cut dependence ~ +10% ε / ε ∆ ~ +5% ε / ε ∆ ~ -8% ε / ε ∆ ~ -15% ε / ε ∆ Systematic Uncertainty HE: Total
HE: Energy Dependent LE: Total
LE: Energy Dependent
FIG. S4. Energy dependence of total systematic uncertainty band (thick lines). Contributions from energy dependent systematic uncertainty are shown as thinner lines of the same color. Blue long-dashed lines and red solid lines correspond to LE- and HE-trigger analyses, respectively. Relative differences of the measured flux in the case of different charge selections with respect to the nominal charge cut (the efficiency variation considered here ranges from ∼ −15% to ∼ +10%) are also shown. The standard deviation of the relative differences is taken as energy dependent systematic uncertainty in each energy bin. The total uncertainty is the quadratic sum of energy dependent and normalization uncertainties. The upper (lower) bound of the energy region used in LE (HE) analysis is shown by the dashed line on the left (right) side of the picture. The two analyses are combined at 300 GeV as indicated by dotted line.
Energy [GeV] 2
10 103
Systematic Uncertainty (LE)
0.25 − 0.2 − 0.15 − 0.1 − 0.05 − 0 0.05 0.1 0.15 0.2 0.25
LE
MC model dependence (not included)
Track consistency with TASC energy deposits
Shower development requirement in IMC
Charge identification
Energy unfolding
Beam test configuration
Energy [GeV] 3
10 104
Systematic Uncertainty (HE)
0.25 − 0.2 − 0.15 − 0.1 − 0.05 − 0 0.05 0.1 0.15 0.2 0.25
HE
MC model dependence Track consistency with TASC energy deposits
Shower development requirement in IMC
Charge identification
Energy unfolding
Beam test configuration
FIG. S5. Summary of energy dependent systematic uncertainties for LE-trigger (upper figure) and HE-trigger (lower figure) analysis, where the energy dependence of total systematic uncertainty bands are shown by the thick red lines, while the thick blue lines isolate the total contribution from systematic uncertainties with an energy dependence. Thin lines with other colors show the contributions from each component as explained in the legend. The energy dependent systematic uncertainty includes the contributions from trigger efficiency which is estimated as 3.3% and 2.2% for LE and HE analyses, respectively.
RESULTS
Kinetic Energy [GeV]
10
10
210
310
410
5]
1.7GeV
-1s
-1sr
-2Flux [m
×
2.7E
310
×
3
310
×
4
310
×
5
310
×
6
310
×
7
310
×
8
410
410
×
2
410
×
3
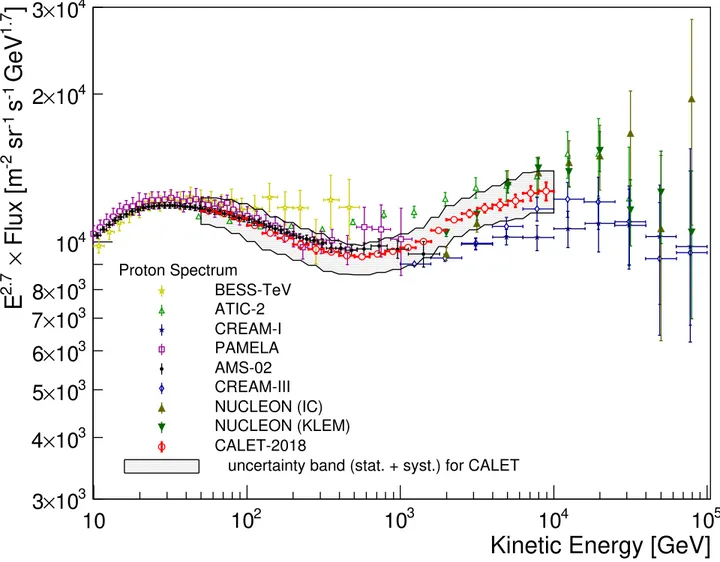
Proton Spectrum BESS-TeV ATIC-2 CREAM-I PAMELA AMS-02 CREAM-III NUCLEON (IC) NUCLEON (KLEM) CALET-2018uncertainty band (stat. + syst.) for CALET
FIG. S6. Cosmic-ray proton spectrum measured by CALET from 50 GeV to 10 TeV using an energy binning of 10 bins per decade. The gray band indicates the quadratic sum of statistical and systematic errors. Also plotted are recent direct measurements in space [14–17] and from high altitude balloons [10, 18–20].
Kinetic Energy [GeV]
210
10
310
4]
1.7GeV
-1s
-1sr
-2Flux [m
×
2.7E
410
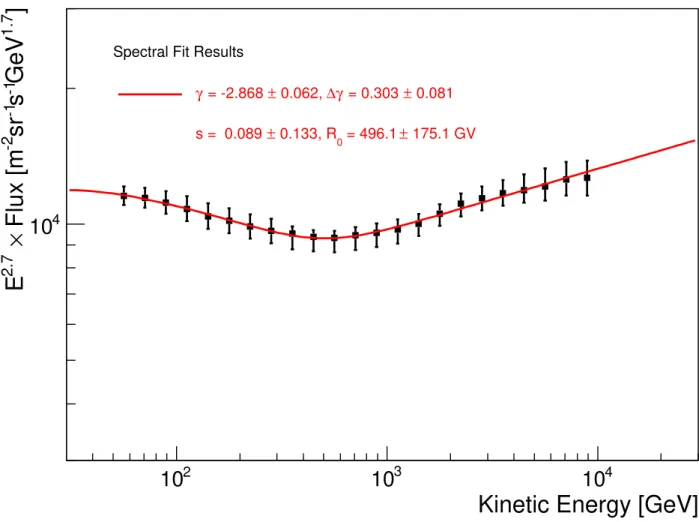
Spectral Fit Results
0.081 ± = 0.303 γ ∆ 0.062, ± = -2.868 γ 175.1 GV ± = 496.1 0 0.133, R ± s = 0.089
FIG. S7. Fit of the CALET proton spectrum with a smoothly broken power-law function as defined in Eq. (3) of Ref. [14]. Statistical errors are shown in quadrature with systematic errors including only energy dependent ones, neglecting to first order possible correlations among different sources of systematic errors and assuming that they are normally distributed. The fit parameters are given in the plot. Since the fit is performed as a function of rigidity, an appropriate change of variables is carried out in the fitting function. The softer value of the spectral index obtained in this smooth fit with respect to the single power-law fit in the 50-500 GeV energy interval is mainly due to the inclusion of a solar modulation potential of 550 MV (fixed) using the force field approximation [21]. The stability of the result versus the choice of the potential has been studied by varying its value from 450 MV to 650 MV. The result has been found to be insensitive within errors, differing at most by 0.01 for γ and ∆γ.
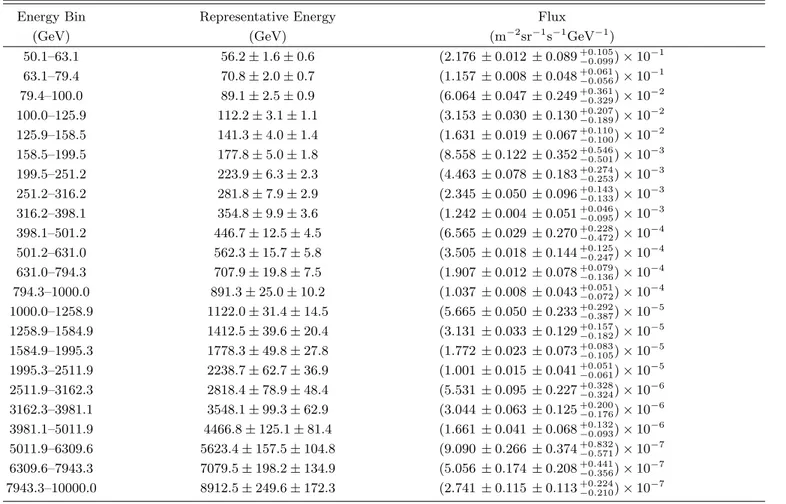
TABLE I. Table of CALET proton spectrum. Energy in each bin is simply represented by geometric mean. The first and second errors associated with mean energy represent systematic error in global energy scale and potentially energy dependent ones, respectively. Energy dependent energy scale error mainly comes from beam test in the lower energy region and energy calibration of lower gain range [2] in the higher energy region. For the flux the first, second and third errors represent the statistical uncertainties (68% confidence level), systematic uncertainties in normalization, and energy dependent systematic uncertainties, respectively.
Energy Bin Representative Energy Flux
(GeV) (GeV) (m−2sr−1s−1GeV−1)
50.1–63.1 56.2± 1.6 ± 0.6 (2.176± 0.012 ± 0.089+0.105 −0.099)× 10−1 63.1–79.4 70.8± 2.0 ± 0.7 (1.157± 0.008 ± 0.048+0.061−0.056)× 10−1 79.4–100.0 89.1± 2.5 ± 0.9 (6.064± 0.047 ± 0.249+0.361−0.329)× 10−2 100.0–125.9 112.2± 3.1 ± 1.1 (3.153± 0.030 ± 0.130+0.207−0.189)× 10−2 125.9–158.5 141.3± 4.0 ± 1.4 (1.631± 0.019 ± 0.067+0.110−0.100)× 10−2 158.5–199.5 177.8± 5.0 ± 1.8 (8.558± 0.122 ± 0.352+0.546 −0.501)× 10−3 199.5–251.2 223.9± 6.3 ± 2.3 (4.463± 0.078 ± 0.183+0.274−0.253)× 10−3 251.2–316.2 281.8± 7.9 ± 2.9 (2.345± 0.050 ± 0.096+0.143−0.133)× 10−3 316.2–398.1 354.8± 9.9 ± 3.6 (1.242± 0.004 ± 0.051+0.046−0.095)× 10−3 398.1–501.2 446.7± 12.5 ± 4.5 (6.565± 0.029 ± 0.270+0.228−0.472)× 10−4 501.2–631.0 562.3± 15.7 ± 5.8 (3.505± 0.018 ± 0.144+0.125 −0.247)× 10−4 631.0–794.3 707.9± 19.8 ± 7.5 (1.907± 0.012 ± 0.078+0.079−0.136)× 10−4 794.3–1000.0 891.3± 25.0 ± 10.2 (1.037± 0.008 ± 0.043+0.051−0.072)× 10−4 1000.0–1258.9 1122.0± 31.4 ± 14.5 (5.665± 0.050 ± 0.233+0.292 −0.387)× 10−5 1258.9–1584.9 1412.5± 39.6 ± 20.4 (3.131± 0.033 ± 0.129+0.157−0.182)× 10−5 1584.9–1995.3 1778.3± 49.8 ± 27.8 (1.772± 0.023 ± 0.073+0.083−0.105)× 10−5 1995.3–2511.9 2238.7± 62.7 ± 36.9 (1.001± 0.015 ± 0.041+0.051−0.061)× 10−5 2511.9–3162.3 2818.4± 78.9 ± 48.4 (5.531± 0.095 ± 0.227+0.328−0.324)× 10−6 3162.3–3981.1 3548.1± 99.3 ± 62.9 (3.044± 0.063 ± 0.125+0.200 −0.176)× 10−6 3981.1–5011.9 4466.8± 125.1 ± 81.4 (1.661± 0.041 ± 0.068+0.132−0.093)× 10−6 5011.9–6309.6 5623.4± 157.5 ± 104.8 (9.090± 0.266 ± 0.374+0.832−0.571)× 10−7 6309.6–7943.3 7079.5± 198.2 ± 134.9 (5.056± 0.174 ± 0.208+0.441−0.356)× 10−7 7943.3–10000.0 8912.5± 249.6 ± 172.3 (2.741± 0.115 ± 0.113+0.224−0.210)× 10−7
[1] O. Adriani et al. (CALET Collaboration), Phys. Rev. Lett. 119, 181101 (2017).
[2] Y. Asaoka, Y. Akaike, Y. Komiya, R. Miyata, S. Torii, et al. (CALET Collaboration), Astropart. Phys. 91, 1 (2017). [3] Y. Asaoka, Y. Ozawa, S. Torii, et al. (CALET Collaboration), Astropart. Phys. 100, 29 (2018).
[4] O. Adriani et al. (CALET Collaboration), Phys. Rev. Lett. 120, 261102 (2018).
[5] P. Maestro, N. Mori, et al. (CALET Collaboration), in Proceeding of Science (ICRC2017) 208 (2017). [6] P. S. Marrocchesi et al. (CALET Collaboration), in Proceeding of Science (ICRC2017) 156 (2017). [7] P. Brogi et al. (CALET Collaboration), in Proceedings of Science (ICRC2015) (2015) p. 585. [8] M. Aguilar et al. (AMS Collaboration), Phys. Rev. Lett. 114, 171103 (2015).
[9] M. Aguilar et al. (AMS Collaboration), Phys. Rev. Lett. 115, 211101 (2015). [10] Y. Yoon et al., Astrophys. J. 839, 5 (2017).
[11] T. Adye, in arXiv:1105.1160v1 (2011).
[12] G. D’Agostini, Nucl. Instrum. Methods Phys Res., Sect. A, 362, 487 (1995).
[13] R. Brun and F. Rademakers, Nucl. Instrum. Methods Phys Res., Sect. A, 389, 81 (1997). [14] M. Aguilar et al. (AMS Collaboration), Phys. Rev. Lett. 114, 171103 (2015).
[15] O. Adriani et al., Phys. Rept. 544, 323 (2014). [16] O. Adriani et al., Riv. Nuovo Cim. 40, 1 (2017). [17] E. Atkin et al., JETP Letters 108, 5 (2018). [18] S. Haino et al., Phys. Lett. B 594, 35 (2004).
[20] Y. Yoon et al., Astrophys. J. 728, 122 (2011).