Ar ticle
The J
our
nal of Exper
imental Medicine
IntroductIonMelanoma cells rely heavily on extracellular signal–regulated kinase (ERK)/MAPK signaling as indicated by hyperactivation of this pathway in up to 90% of melanomas. The MAP KKK BRAF is a prominent oncogene in melanoma (Davies et al., 2002), and inhibitors that target BRAFV600E, the most commonly mutated form, are extremely potent, eliciting high response
rates (Flaherty et al., 2010; Chapman et al., 2011; Sosman et al., 2012). Despite this, durable responses are rare, and most pa-tients relapse within a year after commencement of treatment (Salama and Flaherty, 2013). Significantly longer responses can be achieved by combining BRAF inhibitors (BRAFi’s) and MEK (MAPK/ERK kinase) inhibitors (MEKi’s), yet the development of drug resistance is still the most common out-come (Long et al., 2016). Acquisition of mutations affecting a variety of components of the RTK-RAS-RAF-MEK-ERK pathway, but also parallel pathways including the PI3K-AKT pathway, enable melanoma cells to resist MAPK signaling inhibition. Moreover, subclones of transformed cells from tumors at distinct anatomical sites, but also within a given tumor, possess different resistance-conferring mutations (Shi et al., 2014; Van Allen et al., 2014; Kemper et al., 2015), and
Mitogen-activated protein kinase (MAPK) pathway antagonists induce profound clinical responses in advanced cutaneous melanoma, but complete remissions are frustrated by the development of acquired resistance. Before resistance emerges, adaptive responses establish a mutation-independent drug tolerance. Antagonizing these adaptive responses could improve drug effects, thereby thwarting the emergence of acquired resistance. In this study, we reveal that inflammatory niches con-sisting of tumor-associated macrophages and fibroblasts contribute to treatment tolerance through a cytokine-signaling network that involves macrophage-derived IL-1β and fibroblast-derived cXcr2 ligands. Fibroblasts require IL-1β to produce cXcr2 ligands, and loss of host IL-1r signaling in vivo reduces melanoma growth. In tumors from patients on treatment, sig-naling from inflammatory niches is amplified in the presence of MAPK inhibitors. Sigsig-naling from inflammatory niches coun-teracts combined BrAF/MEK (MAPK/extracellular signal–regulated kinase kinase) inhibitor treatment, and consequently, inhibiting IL-1r or cXcr2 signaling in vivo enhanced the efficacy of MAPK inhibitors. We conclude that melanoma inflamma-tory niches adapt to and confer drug tolerance toward BrAF and MEK inhibitors early during treatment.
An adaptive signaling network in melanoma inflammatory
niches confers tolerance to MAPK signaling inhibition
Helen L. Young,
1Emily J. Rowling,
1Mattia Bugatti,
2Emanuele Giurisato,
1,3Nadia Luheshi,
4Imanol Arozarena,
1Juan-Carlos Acosta,
5Jivko Kamarashev,
6Dennie T. Frederick,
7Zachary A. Cooper,
8Alexandre Reuben,
8Jesus Gil,
9,10Keith T. Flaherty,
7Jennifer A. Wargo,
8William Vermi,
2,11Michael P. Smith,
1* Claudia Wellbrock,
1* and Adam Hurlstone
1*
1Manchester Cancer Research Centre, Faculty of Biology, Medicine, and Health, School of Medical Sciences, Division of Molecular and Clinical Cancer Studies,
The University of Manchester, Manchester M13 9PT, England, UK
2Department of Molecular and Translational Medicine, Section of Pathology, University of Brescia, 25123 Brescia, Italy 3Department of Molecular and Developmental Medicine, University of Siena, 53100 Siena, Italy
4Division of Oncology, MedImmune Ltd, Cambridge CB21 6GH, England, UK
5Edinburgh Cancer Research Centre, Medical Research Council Institute of Genetics and Molecular Medicine, Western General Hospital, Edinburgh EH4 2XR,
Scotland, UK
6Department of Dermatology, University Hospital Zürich, 8091 Zürich, Switzerland 7Department of Medicine, Massachusetts General Hospital Cancer Center, Boston, MA 02114 8Division of Surgical Oncology, University of Texas MD Anderson Cancer Center, Houston, TX 77030 9Medical Research Council London Institute of Medical Sciences, London W12 0NN, England, UK
10Institute of Clinical Sciences, Faculty of Medicine, Imperial College London, London W12 0NN, England, UK 11Department of Pathology and Immunology, Washington University School of Medicine, St. Louis, MO 63110
© 2017 Young et al. This article is available under a Creative Commons License (Attribution 4.0 International, as described at https ://creativecommons .org /licenses /by /4 .0 /).
*M.P. Smith, C. Wellbrock, and A. Hurlstone contributed equally to this paper. Correspondence to Adam Hurlstone: [email protected]; or Claudia Wellbrock: [email protected]
I. Arozarena’s present address is Cancer Signaling group, Navarrabiomed-Fundacion Miguel Servet-IDI SNA, C/Irunlarrea 3, Complejo Hospitalario de Navarra, Pamplona 31008, Spain.
Z.A. Cooper’s present address is MedImmune Ltd, Gaithersburg, MD 20878. Abbreviations used: BRAFi, BRAF inhibitor; CXCR2KD, CXCR2 knockdown; ERK, extra-cellular signal–regulated kinase; Fib-CM, fibroblast-conditioned media; HFF, human foreskin fibroblast; IL-1RA, IL-1 receptor antagonist; MEK, MAPK/ERK kinase; MEKi, MEK inhibitor; Mel-CM, melanoma cell–conditioned media; NHM, normal human melanocyte; qPCR, quantitative PCR; SMA, smooth muscle actin.
this inter- and intratumoral heterogeneity poses a formidable obstacle to the development of any salvage therapy. Conse-quently, focus has recently shifted to defining alterations in intracellular signaling, metabolism, chromatin structure, and gene expression that comprise early (hours to weeks) adap-tive responses of cells to MAPK pathway inhibitors, which are reversible (that is independent of acquired mutations) and contribute to the ability of transformed cells to toler-ate these therapeutic agents before acquired resistance takes hold (Smith and Wellbrock, 2016). Such adaptive responses can occur in a cancer cell–autonomous fashion (Johannes-sen et al., 2010; Nazarian et al., 2010; Villanueva et al., 2010; Poulikakos et al., 2011; Smith et al., 2013; Long et al., 2014). However, it also appears that factors elaborated by stromal and innate immune cells in the tumor microenvironment also enable melanoma cells to tolerate MAPK inhibition (Strauss-man et al., 2012; Smith et al., 2014; Hirata et al., 2015; Wang et al., 2015). Potentially, compared with mutation-driven events, tumors’ adaptive responses to drugs may be more stereotyp-ical; simultaneously targeting adaptive responses and MAPK signaling might greatly diminish the burden of residual trans-formed cells, which could otherwise go on to evolve muta-tions conferring drug resistance (Smith and Wellbrock, 2016). Importantly, in melanoma patients undergoing MAPK inhibitor treatment, we have shown previously that there is a greater macrophage abundance within the tumors compared with pretreatment (Smith et al., 2014). Macrophages are the major producers of the proinflammatory cytokine TNF, and we and others have shown that TNF not only is important for melanoma growth and invasion, but also contributes to tolerance to MAPK inhibition (Katerinaki et al., 2003; Gray-Schopfer et al., 2007; Smith et al., 2014). However, TNF is not the only proinflammatory cytokine produced by macrophages, and the increased number of macrophages during treatment with MAPK inhibitors might impact drug efficacy through additional factors. One such factor that is closely linked to TNF and produced by macrophages in abundance is IL-1. IL-1 exists as two isoforms, α and β, which both signal via the IL-1 receptor (IL-1R) and the transcrip-tion factor NF-κB. However, whereas IL-1α is widely and constitutively expressed and initiates inflammation when pas-sively released from necrotic cells, IL-1β expression is more restricted. Furthermore, unlike IL-1α, the pro-form of IL-1β requires cleavage by caspase 1, which is, in turn, activated by the NLRP3-containing inflammasome, to become active (Garlanda et al., 2013).
Studies on IL-1 expression in established human mel-anoma cell lines are inconsistent, ranging from constitutive IL-1β expression and secretion only in metastases-derived cells (Okamoto et al., 2010) to constitutive IL-1α and IL-1β expression in the majority of melanoma cell lines inde-pendently of disease stage (Qin et al., 2011) and to no IL-1β secretion at all because of lack of expression of one or more inflammasome components (Gehrke et al., 2014). Although these findings do not provide a clear role for IL-1 in isolated
melanoma cells in vitro, immunohistochemistry studies imply that IL-1α is uniformly expressed in naevi, primary tumors, and metastases (Qin et al., 2011; Khalili et al., 2012) and, thus, is unrelated to disease progression. In contrast, IL-1β is unde-tectable in naevi and rarely detected in primary tumors (<10%) but is elevated in metastases (Okamoto et al., 2010; Qin et al., 2011; Khalili et al., 2012; Gehrke et al., 2014). Interestingly, intense IL-1β expression is observed in discrete cells within the tumor, mooted to be melanophages (Gehrke et al., 2014).
A role for host-derived IL-1β, and to a lesser extent IL-1α, in the neovascularization and metastasis of melanoma allografts has been established using recombinant mice (Vor-onov et al., 2003). Considering that the abundance of macro-phages within tumors increases in patients during treatment with MAPK inhibitors and that macrophages can protect melanoma cells from the growth inhibitory effects of MAPK inhibitors (Smith et al., 2014; Wang et al., 2015), we wanted to assess the role of IL-1 signaling in melanoma growth and in the context of MAPK pathway antagonism.
rESuLtS
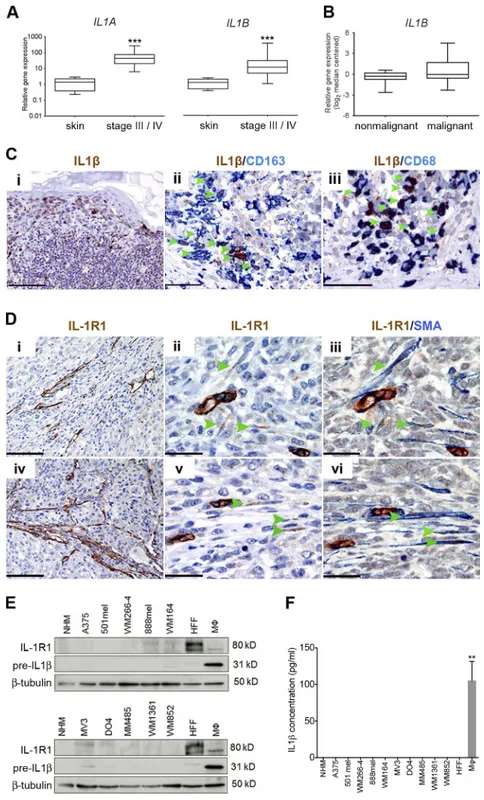
IL-1 and IL-1r1 expression is enriched in the tumor stroma First, we confirmed the presence of an inflammatory micro-environment in melanoma and detected increased IL1A and IL1B expression in stage-III and stage-IV melanoma patient samples (Fig. 1 A). Up-regulation of IL1B in melanoma was corroborated by microarray data (Talantov et al., 2005) ana-lyzed through the Oncomine platform, demonstrating ele-vated expression in primary cutaneous melanoma compared with normal skin and benign nevi (Fig. 1 B).
Next, we performed immunohistochemical analysis to assess which cells in the melanoma microenvironment were responsible for the expression of IL-1β. Confirming previ-ous observations (Gehrke et al., 2014), we observed intense staining within discrete cells dispersed throughout tumors (Fig. 1 C, i). Analyzing these specimens for expression of the macrophage markers CD163 and CD68, in combination with IL-1β, revealed that the majority of cells displaying the strongest expression were macrophages (Fig. 1 C, ii and iii, indicated by arrowheads). On average, 81% of CD163+ cells infiltrating tumors also stained positive for IL-1β (95% confi-dence interval = 77–86%; n = 6).
To determine which cells within the tumor might be responding to IL-1 stimulation, we performed immunohisto-chemical analysis for IL-1R1 expression in specimens taken from patient skin metastases. Importantly, IL-1R1 expression was not detectable in melanoma cells. Instead, we observed receptor expression both in endothelial cells (Fig. 1 D) and in fusiform stromal cells (Fig. 1 D, ii and v, indicated by arrow-heads), which coexpressed α-smooth muscle actin (α-SMA; Fig. 1 D, iii and vi), revealing them to be melanoma-associated fibroblasts. Thus, stromal cells are the principal candidates re-sponding to IL-1 signaling in melanoma.
To corroborate our findings from immunohistochem-ical analyses, we analyzed a panel of human melanoma cell
lines for the expression of both the IL-1β precursor protein and IL-1R1 by Western blot analysis (further details on the mutational status and origin of the melanoma cells used are outlined in Table S1). In agreement with our findings in mel-anoma biopsies, we found that established melmel-anoma cell lines express only very low levels of IL-1R1 if any, whereas human foreskin fibroblasts (HFFs) expressed high levels of IL-1R1 (Fig. 1 E). Furthermore, IL-1β precursor protein expression
in melanoma cells was negligible (Fig. 1 E), and these cells did not secrete the active, cleaved form of the IL-1β protein (Fig. 1 F). Also, fibroblasts did not express or secrete IL-1β (Fig. 1, E and F). However, as expected, activated macro-phages (activated with IFN-γ and LPS) express the precleaved protein (Fig. 1 E) and secrete the active form (Fig. 1 F). This supports the candidacy of macrophages as the primary source of IL-1β in the melanoma microenvironment, in line with
Figure 1. IL-1 and IL-1r1 expression is enriched in the melanoma stroma. (A) Real-time qPCR
anal-ysis of IL1A and IL1B expression in stage-III and stage-IV melanoma tumor samples (n = 39) relative to expression in human skin samples (n = 8). ***, P < 0.001; Mann-Whitney test. (B) Analysis of IL1B expression in normal skin and benign nevi samples (nonmalignant; n = 25) and cutaneous melanoma samples (malignant; n = 45) from an available gene expression dataset (Talantov et al., 2005) accessed through the Oncomine platform. (C) Sections from a case of primary cutaneous melanoma stained for IL-1β, CD163, and CD68 expression as indicated by labels. Bars: (i) 200 µm; (ii) 50 µm; (iii) 33 µm. (D) Serial sections from two skin metastases (i–iii and iv–vi, respectively), stained for IL-1R1 and SMA expression as indicated by the labels. Bars: (i and iv) 200 µm; (ii, iii, v, and vi) 33 µm. (C and D) Arrow-heads indicate cells that are clearly double stained. (E) Western blot analysis of IL-1R1 and IL-1β precur-sor protein expression in a panel of cell lines. Data are representative of three independent experiments. (F) Secreted IL-1β in conditioned media from a panel of melanoma cell lines detected by ELI SA. Data are represented as mean ± SEM for three independent samples in each group. **, P < 0.01; Dunn’s multiple comparisons test. (E and F) Macrophages (Mφ) were stimulated with 100 ng/ml IFN-γ and 20 ng/ml LPS.
our observations in melanoma biopsies. Interestingly, al-though ordinarily undetectable, we observed IL-1β precursor protein expression in melanoma cells infected with myco-plasma (unpublished data). This suggests that, under normal growth conditions, melanoma cells do not produce significant amounts of precleaved IL-1β, and yet, they have the capacity to do so when stressed.
Stromal IL-1–IL-1r1 signaling contributes to melanoma growth
In line with the increase in IL1B observed in stage-III and stage-IV melanoma (Fig. 1 A) and a role for macrophages as the predominant source and fibroblasts as potential recipients of the cytokine signal, we found an increase in expression of the pan-macrophage marker CD68 and the cancer-associated fibroblast marker SMA in patient melanoma samples com-pared with normal skin (Fig. 2 A). Moreover, by analyzing melanoma samples for SMA and both CD163 and CD68 expression using immunohistochemistry, we observed fibro-blasts and macrophages localized together in bands of con-nective tissue traversing melanoma metastases taken from skin and lung (Fig. 2 B). Thus, melanoma tumors appear to contain IL-1β–signaling inflammatory niches, a config-uration where cross talk between macrophages and stromal cells may be optimized.
To test the importance of IL-1 signaling within the host stroma for melanoma growth, we injected 4434 BrafV600E melanoma cells, derived from melanoma-bearing BrafV600E mice (Dhomen et al., 2009), into either syngeneic control mice (Il-1r1fl/fl) or recently generated Il-1r1−/− mice that
lack both IL-1R1 and the truncated isoform IL-1R3 and thereby display total disruption of IL-1 signaling (Abdulaal et al., 2016). Tumors in Il-1r1−/− mice grew significantly slower
than tumors in control mice, resulting in a profound reduc-tion in tumor size at 28 d after injecreduc-tion (Fig. 2 C). This find-ing confirms a role for IL-1 signalfind-ing in melanoma growth (Voronov et al., 2003) and, furthermore, reveals that a major part of the tumor growth support relies on IL-1 signaling in the host stroma. Monocyte numbers were previously shown to be normal in Il-1r1−/− mice (Abdulaal et al., 2016), and
we now show that bone marrow mononuclear cells derived from Il-1r1−/− mice can be induced to differentiate ex vivo
into macrophages comparable with bone marrow mononu-clear cells derived from control mice (Fig. 2 D). We further show that these macrophages both express and secrete levels of IL-1β comparable with macrophages derived from con-trol mice when stimulated with LPS and IFN-γ (Fig. 2 E). Moreover, immunohistochemical analysis to detect IBA1/ AIF1 indicated comparable infiltration by macrophages into tumors that grew in Il-1r1−/− mice as compared with control
mice, as immunohistochemical analysis to detect SMA indi-cated comparable recruitment of fibroblasts (Fig. 2 F). Thus, differences in macrophage and fibroblast recruitment to tu-mors growing in Il-1r1−/− compared with control mice is
not responsible for the difference observed in tumor growth,
implicating a deficiency in stromal IL-1 responsiveness for the reduction in tumor growth.
Melanoma cells induce IL-1β production by macrophages To dissect the cross talk occurring among melanoma cells, macrophages, and fibroblasts in the tumor, we set up an in vitro system using conditioned media from melanoma cells and macrophages (Fig. 3 A). Because we found that mela-noma cells do not produce significant amounts of IL-1β themselves (Fig. 1 E) and melanoma cells have previously been shown to stimulate monocyte differentiation into mac-rophages (Wang et al., 2012), we hypothesized that melanoma cells might trigger IL-1β production and secretion in macro-phages. To test this, we cultured human monocytes isolated from peripheral blood in melanoma cell–conditioned me-dium (Mel-CM) for 7 d (Fig. 3 A). During this time, the morphology of the monocytes became strikingly different to those left untreated, cultured with M-CSF, or cultured in media taken from normal human melanocyte (NHM) cells. In contrast to these control-treated cells that had a typical round fried egg morphology, Mel-CM–treated cells adopted an elongated and dendritic morphology (Fig. 3 B), as de-scribed previously (Wang et al., 2012). Moreover, the macro-phages displayed high expression of both the precleaved and cleaved IL-1β protein 24 h after the end of the 7-d differenti-ation phase in Mel-CM (Fig. 3 C). This correlated with high IL-1β secretion by the macrophages, and both the protein expression and secretion were still detectable 48 h after the 7-d differentiation phase (Fig. 3 C). The persistence in IL-1β production even in the absence of Mel-CM suggests that the macrophages may be permanently differentiated. We also found that mouse bone marrow mononuclear cells treated with M-CSF, and thus differentiated into macrophages, also expressed and secreted IL-1β when incubated for a further 24 h in conditioned media from 4434 mouse melanoma cells (Fig. 3 D), whereas cells incubated in conditioned media from untransformed 3T3 cells expressed and secreted low levels of IL-1β (Fig. 3 D). Notably, this phenomenon was consistent in macrophages from both Il-1r1fl/fl and Il-1r1−/− mice. These
findings point to melanoma cells playing a role in stimulating monocytes to adopt a proinflammatory macrophage pheno-type, which results in IL-1β production, among other factors. Melanoma cells initiate an IL-1–mediated cross
talk between macrophages and fibroblasts that is disrupted by Il-1r1 ablation
With fibroblasts being the potential recipients of the IL-1 signal in the melanoma microenvironment, we wished to as-sess the effects of IL-1R1 activation in fibroblasts. For this, we profiled the secretome of fibroblasts stably overexpress-ing IL-1 usoverexpress-ing a cytokine antibody array and observed pro-foundly increased levels of GROα, IL-6, and IL-8 (Fig. 4 A). In line with these data, when we treated human fibroblasts with recombinant IL-1β over a 6-h time course, we observed up-regulation of GROα, IL-6, and IL-8 proteins,
accom-panied by NF-κB phosphorylation (Fig. 4 B). Because we hypothesized that macrophages trigger IL-1R1 signaling in fibroblasts, we next tested the ability of the Mel-CM–treated macrophages to stimulate these cells (Fig. 3 A). As observed with isolated IL-1β, we found that fibroblasts cultured in con-ditioned media taken from Mel-CM–differentiated macro-phages showed a strong induction in expression of IL-6, IL-8, and GROα (Fig. 4 C). Importantly, this expression was
inhib-ited using an IL-1β–neutralizing antibody, indicating that the induction of IL-6, IL-8, and GROα was dependent on mac-rophage-derived IL-1β. Of note, macrophages that had been cultured in NHM-conditioned media were not able to stim-ulate cytokine production in fibroblasts, doubtless because of the lack of IL-1β production (Fig. 3 C and Fig. 4 C).
These data clearly demonstrate that fibroblasts can re-spond to IL-1β with the production of growth factors such Figure 2. Macrophages and fibroblasts are organized in the melanoma stroma into inflammatory niches to relay an IL-1 signal that fosters tumor growth. (A) Real-time qPCR analysis of CD68 and SMA expression in stage-III and stage-IV melanoma tumor samples (n = 39) relative to expression
in human skin samples (n = 8). ***, P < 0.001; Mann-Whitney test. (B) Sections from two cases of skin (i–iv) and lung (v–viii) metastasis of primary cutaneous melanoma, stained for SMA, CD163, CD68, and SOX10 expression as indicated by the labels. Bars: (i and v) 200 µm; (ii, iv, vi, and viii) 50 µm; (iii and vii) 33 µm. (C) Schematic of BrafV600E-4434 mouse allograft model (left) and growth of individual BrafV600E-4434 allografts in Il-1r1fl/fl (n = 3) and Il-1r1−/− (n = 3; right) mice. **, P < 0.01; unpaired Student’s t test at day 28 after injection. (D) Flow cytometry staining of surface F4/80 and CD115 expression in bone mar-row mononuclear cells collected from Il-1r1fl/fl (left) or Il-1r1−/− (right) mice and cultured in M-CSF–containing medium for 7 d. Data are representative of three independent experiments. (E) Il1b mRNA expression (left) and IL-1β secretion (right) in macrophages generated ex vivo from Il-1r1fl/fl or Il-1r1−/− mice stimulated with 100 ng/ml LPS and 50 ng/ml IFN-γ for 24 h, assayed by RT-PCR and ELI SA, respectively. Gene expression is shown as fold-change relative to expression in unstimulated macrophages (UT) as mean ± SEM from three independent experiments. ELI SA data represent mean ± SEM from two indepen-dent experiments. (F) Sections from tumors isolated from Il-1r1fl/fl and Il-1r1−/− mice stained for IBA1 and SMA expression as indicated by the labels. Bars, 100 µm. Data are representative of three independent tumors.
as GROα, and this response would be abolished in the ab-sence of an intact IL-1R1. In line with this, we found that GROα expression was significantly reduced in tumor sec-tions obtained from Il-1r1−/− mice compared with Il-1r1fl/fl mice (Fig. 4 D, i and ii). Real-time quantitative PCR (qPCR) analysis to measure Groα mRNA expression also
confirmed this result (Fig. 4 E). Additionally, GROα was frequently coexpressed in SMA-expressing cells in Il-1r1fl/fl mice (Fig. 4 D, iii), implicating fibroblasts as the primary source of GROα in melanoma.
IL-1β expression correlates with IL-8 and
Groα expression in melanoma
Altogether, these data provide evidence for a relay of signals among melanoma cells, macrophages, and fibroblasts in the melanoma microenvironment. As IL-6, IL-8, and GROα have already been demonstrated to be important cytokines for melanoma growth and progression (Schadendorf et al., 1993; Bar-Eli, 1999; Haghnegahdar et al., 2000; Huang et
al., 2002; von Felbert et al., 2005; Varney et al., 2006), this provides a link between IL-1 signaling in the stroma and melanoma growth support. In line with this, we observed a marked increase in IL8 and GROα mRNA expression in
human melanoma samples (Fig. 5, A and B). The expression of both IL8 and GROα in primary melanomas correlated
strongly with IL1B expression (Fig. 5, C and D), consistent with their expression being largely dependent on IL1B ex-pression. Immunohistochemical analysis of GROα expression in specimens taken from patient skin metastases revealed that fibroblasts are one of the major producers of GROα in mel-anoma (Fig. 5 E, i–iii), substantiating earlier observations in mouse tumors (Fig. 4 D).
IL-1β–activated fibroblasts confer tolerance to BrAF/MEK combination therapy through nF-κB and BcL2
As mentioned earlier, we had previously detected increased macrophage abundance in BRAFV600E-positive melanomas from patients that had been treated with BRAF and MEKi Figure 3. Melanoma cells initiate an IL-1β signaling cascade that is propagated by macrophages. (A) Schematic of in vitro co-culture assay of
mel-anoma cells, macrophages (Mφ), and fibroblasts. nAb, neutralizing antibody. (B) Morphology of untreated (UT) macrophages, M-CSF–treated macrophages (M-CSF-Mφ), and macrophages cultured in conditioned media (CM) taken from NHM (NHM-Mφ), WM266-4 (WM266-4–Mφ), WM164 (WM164-Mφ), and MM485 (MM485-Mφ) cells, after 7 d differentiation. Bars,100 µm. Images are representative of three independent experiments. (C, top) Represen-tative Western blot analysis of IL-1β (precursor and mature) protein expression in UT-Mφ, M-CSF–Mφ, NHM-Mφ, WM266-4–Mφ, WM164-Mφ, and MM485-Mφ at 24 and 48 h after differentiation for 7 d. (Bottom) IL-1β secretion in these same macrophages treated at 24 and 48 h after differentiation, detected by ELI SA. Data are represented as mean ± SEM from three independent experiments. **, P < 0.01; ***, P < 0.001; Dunn’s multiple comparisons test. Mel-CM–treated samples were compared collectively to controls. (D) Il1b mRNA expression (left) and IL-1β secretion (right) in macrophages generated ex vivo from Il-1r1fl/fl or Il-1r1−/− mice, stimulated with 3T3-conditioned media or 4434 Mel-CM for 24 h, assayed by RT-PCR and ELI SA, respectively. *, P < 0.05; Mann-Whitney test; **, P < 0.01; unpaired Student’s t test. Gene expression is shown as fold-change relative to expression in unstimulated macrophages as mean ± SEM from three independent experiments. ELI SA data represent mean ± SEM from three independent experiments.
for 10–14 d (Smith et al., 2014). As we had identified mac-rophages as a crucial source of IL-1–induced growth support signals, we wanted to analyze IL-1 expression in these pa-tient samples (for further papa-tient details, see Table S2). This analysis revealed a decrease in IL1A expression in patients on treatment compared with pretreatment (Fig. 6 A, left), consistent with previous observations and with IL1A being a MAPK signaling target (Khalili et al., 2012). However, we detected a clear increase in IL1B expression in the majority of samples from patients on treatment compared with pre-treatment (Fig. 6 A, right), consistent with our previous find-ing of increased macrophage abundance in patient tumors on treatment (Smith et al., 2014). Real-time qPCR analysis also demonstrated increased Il1b mRNA in 4434-derived mouse allograft tumors treated with MEKi (Fig. 6 B).
The increase in macrophage abundance and IL1B ex-pression on treatment could contribute to the adaptive re-sponse of melanoma cells that promotes treatment tolerance (Smith and Wellbrock, 2016). However, in contrast to TNF, which has been shown to directly prevent melanoma cell death in the presence of BRAF signaling inhibition, IL-1β cannot prevent cell death when BRAF signaling is inhibited (Gray-Schopfer et al., 2007; Smith et al., 2014). Nonetheless, because macrophage-derived IL-1β can activate fibroblasts to produce cytokines that could hypothetically protect against
MAPK inhibitors, we subsequently examined the ability of melanoma cells exposed to fibroblast-conditioned media (Fib-CM) pretreated with IL-1β (IL-1β–Fib-CM; Fig. 6 C) to tolerate the BRAFi vemurafenib, the pan-RAF inhibitor RAF265, the MEKi selumetinib, or, indeed, a combination of these therapeutics. In line with previously published work and a role for secreted factors in ERK reactivation upstream of MEK (Straussman et al., 2012), we found that A375 cells cultured in medium from unstimulated fibroblasts were pro-tected to an extent against BRAF inhibition, but the factors present in the medium were not sufficient to protect from a combination of BRAF and MEKi treatment (Fig. 6 D). However, A375 cells cultured in IL-1β–Fib-CM were pro-tected not only from BRAF inhibition, but also from BRAF/ MEKi combination (Fig. 6 D). Moreover, IL-1β–Fib-CM also protected A375 cells from pan-RAF inhibition (Fig. 6 E). Similar effects were observed in WM266-4 and 4434 mela-noma cell lines (Fig. 6 F).
BRAF inhibition resulted in loss of ERK phosphoryla-tion, but this was rescued when cells were cultured in media taken from either unstimulated fibroblasts or IL-1β–activated fibroblasts (Fig. 6 D), as previously described (Straussman et al., 2012). However, ERK reactivation was not observed when melanoma cells were treated with BRAF/MEKi com-bination therapy (Fig. 6 D) and, similarly, when treated with Figure 4. the IL-1β signaling cascade is further propagated by fibroblasts. (A) Cytokine array analysis of the normal IMR90 human fibroblast
secre-tome after retroviral transfection with an IL-1A–expressing plasmid. The top ten secreted cytokines are displayed relative to their level in the secresecre-tome of normal IMR90 human fibroblasts transfected with control vector. Values represent a mean of two independent experiments. (B) Western blot analysis of p65, pp65, IL-6, IL-8, and GROα expression in HFF cells treated with 100 ng/ml IL-1β for the stated time points. Data are representative of three independent experiments. (C) Western blot analysis of IL-6, IL-8, and GROα expression in HFF cells cultured in conditioned media (CM) taken from NHM macrophage (NHM-Mφ), WM266-4–Mφ, WM164-Mφ, and MM485-Mφ, with 1 µg/ml normal goat IgG control or 1 µg/ml IL-1β neutralizing antibody (IL1βnAb). Data are representative of three independent experiments. (D) Sections from tumors isolated from Il-1r1fl/fl and Il-1r1−/− mice stained for GROα and SMA expression as indicated by the labels. (iii) Arrowheads indicate cells that are clearly double stained. Bars: (i and ii)100 µm; (iii) 33 µm. Images are representative of three independent tumors. (E) Real-time qPCR analysis of Groα expression in tumors isolated from Il-1r1−/− mice (n = 3) relative to expression in tumors isolated from Il-1r1fl/fl mice (n = 3), at day 28 after injection. Data are represented as mean ± SEM. *, P < 0.05; Mann-Whitney test.
a pan-RAF inhibitor (Fig. 6 E). Thus, our data confirm that fibroblasts can protect melanoma cells from BRAF inhibi-tion through reactivainhibi-tion of the MAPK pathway. However, we demonstrate that, when activated by IL-1β, fibroblasts can protect melanoma cells from MEK inhibition through an ERK-independent mechanism.
To more closely model heterotypic cell interactions in the tumor microenvironment, we cultured A375 and WM266-4 melanoma cells in media taken from fibroblasts that had themselves previously been cultured in conditioned media taken from Mel-CM–differentiated macrophages. We found that the melanoma cells were indeed protected against BRAF and MEK inhibition (Fig. 6 G), although protection was lost if macrophage-conditioned medium was
preincu-bated with IL-1β–neutralizing antibody or IL-1 receptor an-tagonist (IL-1RA; Fig. 6 G), further confirming a role for macrophage secretion of IL-1β in protecting melanoma cells against MAPK inhibitors.
We further confirmed that IL-1β–Fib-CM–induced tolerance to MAPK antagonism is not PI3K dependent, as IL-1β–Fib-CM also protected A375 cells from a BRAF/ MEK/AKT inhibitor combination (Fig. 7 A). This effect was also observed in WM266-4 cells (Fig. 7 B) and 4434 cells (Fig. 7 C). Next, we analyzed how IL-1β–Fib-CM enables melanoma cells to overcome MAPK inhibition in an ERK-independent manner. We found that NF-κB p65 phosphorylation and BCL2 expression were increased in melanoma cells treated with IL-1β–Fib-CM (Fig. 7 D). Im-Figure 5. cXcr2 ligands are up-regulated in human melanomas. (A) Analysis of IL8 and GROα expression in normal skin and benign nevi samples (nonmalignant; n = 25) and cutaneous melanoma samples (malignant; n = 45) generated using an available gene expression dataset (Talantov et al., 2005) accessed through the Oncomine platform. (B) Real-time qPCR analysis of IL8 and GROα expression in stage-III and -IV melanoma tumor samples (n = 39) relative to expression in human skin samples (n = 8). (A and B) ***, P < 0.001; Mann-Whitney test. (C and D) Correlation of IL8 and IL1B (C) and GROα and IL1B (D) expression in cutaneous melanoma samples (n = 45) using an available gene expression dataset (Talantov et al., 2005) accessed through the On-comine platform. Data are represented as a scatter plot with the regression line (blue) and the 95% confidence interval for the regression line (red dashed lines). (E) Representative sections from skin metastases of primary cutaneous melanoma stained for GROα and SMA expression as indicated by the labels. Bars: (i) 100 µm; (ii and iii) 33 µm.
portantly, this was not affected by BRAF/MEKi combination treatment (Fig. 7 D). The fact that an IκB kinase inhibitor (Fig. 7 E) or a BCL2 inhibitor (Fig. 7 F) could overcome the protective effect conferred by IL-1β–Fib-CM suggests that NF-κB activation and BCL2 up-regulation contribute to the survival signals.
IL-1β–activated fibroblasts protect melanoma cells from MAPK inhibition by signaling through the cXcr2 receptor To test the importance of IL-1β–mediated stromal signals in conferring tolerance to MAPK inhibition in vivo, we again injected 4434 into Il-1r1fl/fl and Il-1r1−/− mice and analyzed
tumor growth in the presence of MEKi. Whereas MEK inhi-Figure 6. the IL-1β signaling cascade is augmented by and confers tolerance to MAPK pathway inhibitors. (A) Real-time qPCR analysis of IL1A
(left) and IL1B (right) expression in tumors from BRAFV600E-positive metastatic melanoma patients undergoing treatment with BRAFi alone or a BRAFi and
MEKi combination (n = 10). Each line represents relative gene expression in an individual patient pretreatment and at 10–14 d on treatment, with error bars representing mean ± SD from three repeats. (B) Real-time qPCR analysis of Il1b expression in BrafV600E-4434 allografts from C57J/B6 mice treated
with 25 mg/kg/d PD184352 (MEKi; n = 5) or vehicle (DMSO; n = 5) for 20 d. Unpaired Student’s t test was used. (C) Schematic of in vitro co-culture assay of melanoma cells and fibroblasts using conditioned media from IL-1β–stimulated fibroblasts in combination with MAPK signaling inhibitors (MAPKi). O/N, overnight. (D, top) Growth assay of A375 cells treated with 1% DMSO, 1 µM PLX4032 (BRAFi), or 0.5 µM both PLX4032 and selumetinib (MEKi), cultured in nonconditioned media or conditioned media taken from unstimulated fibroblasts or fibroblasts previously stimulated with IL-1β. UT, untreated. (Bottom) Representative Western blot analysis and quantification of pERK expression in A375 cells treated as just described, for 24 h. (E, top). Growth assay of A375 cells treated with 1% DMSO or 1 µM RAF265 (pan-RAFi), cultured in conditioned media as in D. (Bottom) Representative Western blot analysis of pERK expression in A375 cells treated as just described for 24 h. (D and E) Western blot data are representative of two independent experiments. (F) Growth assay of WM266-4 (left) and 4434 (right) cells treated as in D. (G) Growth assay of A375 (left) and WM266-4 (right) cells treated with 1% DMSO or 0.5 µM both PLX4032 and selumetinib, cultured in nonconditioned media or conditioned media taken from fibroblasts previously cultured in media taken from Mel-CM– treated macrophages supplemented with 1 µg/ml normal goat IgG control, 1 µg/ml IL-1β neutralizing antibody (IL1βnAb), or 1 µg/ml IL-1RA. (D–F) Data are represented as mean ± SEM from at least three independent experiments with a minimum of eight repeats. Tukey’s multiple comparisons test was used. (G) Data are represented as mean ± SEM from at least three independent experiments. Mann-Whitney test was used. For all growth assays, cells were treated for 48 h, and cell number was assayed by crystal violet staining. *, P < 0.05; ***, P < 0.001.
bition in control mice resulted in ∼24% reduction in tumor growth, ∼81% reduction was observed in Il-1r1−/− mice
treated with MEKi (Fig. 8 A), clearly demonstrating that stromal IL-1 signals are important in promoting tolerance to MAPK inhibition in melanoma.
Next, we wished to dissect the stromal signaling that IL-1 induces to promote MAPK inhibitor tolerance. As we have shown that IL-1β stimulates IL-6, IL-8, and GROα produc-tion in fibroblasts, these cytokines could potentially contrib-ute to the stromal-derived tolerance. However, we found that IL-6 induced growth inhibition in melanoma cells (unpub-lished data) and was therefore deemed an unlikely candidate. GROα and IL-8 are both ligands for the CXCR2 receptor, so to assess whether CXCR2 plays a role in the inflamma-tory niche–mediated tolerance, we used A375 cells in which receptor expression is depleted by expression of a CXCR2 targeting shRNA (A375 CXCR2 knockdown [CXCR2KD]
cells; Fig. 8 B). Whereas IL-1β–Fib-CM offered significant protection against BRAF/MEK combination treatment in A375 cells, in A375 CXCR2KD cells, this protection was lost (Fig. 8 C). A375 CXCR2KD cells grew at a slightly slower rate than A375 cells (Fig. 8 C), which could be linked to a basal growth-promoting role of CXCR2 signaling (Schaden-dorf et al., 1993; Singh et al., 1994; Haghnegahdar et al., 2000). Given the potential role for CXCR2 in the inflam-matory niche–mediated tolerance and because IL1B expres-sion was up-regulated in tumor biopsies from patients after 10–14 d of treatment with BRAF and MEKi’s, we analyzed these tumors for CXCR2 and its ligands GROα and IL8.
We observed an increase in CXCR2 and GROα expression
(Fig. 8 D). However, we only found a slight increase in IL8 expression and, in several cases, even a reduction in IL8 ex-pression in patients on treatment (Fig. 8 D), which confirms previous observations (Sanmamed et al., 2014; Wilmott et al., Figure 7. IL1-β–activated fibroblasts me-diate tolerance to BrAF/MEK combina-tion therapy through nF-κB and BcL2. (A)
Growth assay of A375 treated with 1% DMSO or 0.5 µM both PLX4032 and selumetinib and 1 µM MK-2206 (AKTi), cultured in noncondi-tioned media or condinoncondi-tioned media taken from unstimulated fibroblasts or fibroblasts pre-viously stimulated with IL-1β. UT, untreated. (B) Growth assay of WM266-4 (B) and 4434 (C) cells treated as in A. (A–C) *, P < 0.05; **, P < 0.01; ***, P < 0.001; Tukey’s multiple com-parisons test. (D) Representative Western blot analysis and quantification of pp65 and BCL2 expression in A375 cells treated with 1% DMSO or 0.5 µM both PLX4032 and selume-tinib cultured in conditioned media (CM) as in A for 24 h. Data are representative of two independent experiments. (E) Growth assay of A375 cells treated with 1% DMSO, 0.2 µM Bay 11-7082 (IKKi), 0.5 µM both PLX4032 and selumetinib or 0.5 µM both PLX4032 and sel-umetinib, and 0.2 µM Bay 11-7082, cultured in conditioned media as in A. (F) Growth assay of A375 cells as in E but with 0.2 µM obatoclax (BCL2i) instead. (E and F) **, P < 0.01; Tukey’s multiple comparisons test; ***, P < 0.001; un-paired Student’s t test. (A–C, E, and F) Data are represented as mean ± SEM from at least three independent experiments with a minimum of seven repeats. For all growth assays, cells were treated for 48 h, and cell number was assayed by crystal violet staining.
2014). This renders IL-8 an unlikely candidate for the stimu-lation of CXCR2 in the presence of MAPK antagonists. Fur-thermore, qPCR analysis revealed increased Groα mRNA in
MEKi-treated 4434 allografts compared with vehicle-treated controls (Fig. 8 E, left), and specifically, mouse Groα mRNA
and not human GROα mRNA was up-regulated in MEKi-
treated A375 xenografts (Fig. 8 E, right; Smith et al., 2013), confirming the tumor stroma as the source of GROα.
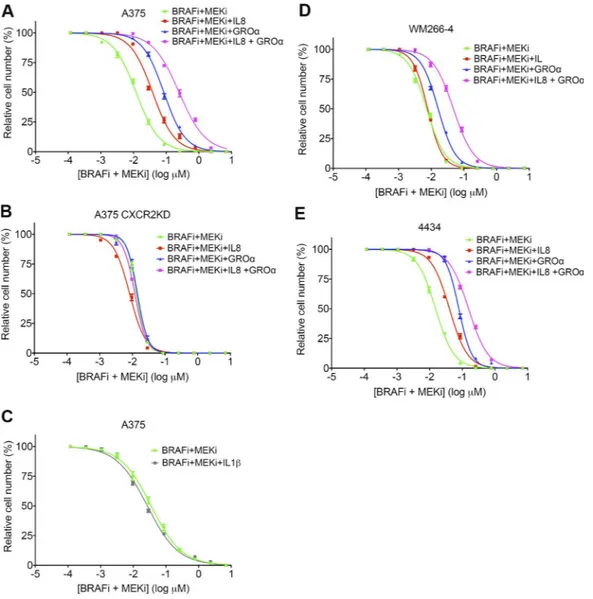
In line with these findings, GROα and IL-8 were able to protect melanoma cells from BRAFi- and MEKi-induced death. Addition of IL-8, GROα, or a combination of both in the presence of BRAFi and MEKi increased the 50% ef-fective concentration by approximately fourfold (from 0.01 to 0.04 µM), ninefold (from 0.01 to 0.09 µM), and 25-fold (from 0.01 to 0.25 µM), respectively, in A375 cells (Fig. 9 A). Therefore, GROα conferred more protection than IL-8,
but the combination of the two cytokines offered the best protection, confirming our finding that GROα is the more likely candidate for the stimulation of CXCR2. This protec-tive effect was lost in A375 CXCR2KD cells (Fig. 9 B). As anticipated, treatment with IL-1β alone did not confer any protection from BRAF/MEKi-induced cell death in A375 cells (Fig. 9 C). GROα, IL-8, and a combination of GROα and IL-8 also protected WM266-4 and 4434 cells with similar effect (Fig. 9, D and E), although IL-8 did not appear to offer any protection to WM266-4 cells.
cXcr2 inhibition synergizes with MEK inhibition in vivo to significantly reduce tumor growth
Our data emphasize that IL-1β cannot directly induce tol-erance to MAPK inhibition in melanoma cells but requires signaling through CXCR2. Furthermore, we found that Figure 8. cXcr2 signaling confers tolerance to MAPK pathway inhibitors. (A) Growth of BrafV600E-4434 allografts in vehicle-treated Il-1r1fl/fl mice
(n = 5), Il-1r1fl/fl mice treated with 25 mg/kg PD184352 (MEKi; n = 5), vehicle-treated Il-1r1−/− mice (n = 6), and Il-1r1−/− mice treated with 25 mg/kg PD184352 (n = 4). Data are represented as mean ± SEM. *, P < 0.05; ***, P < 0.001; Tukey’s multiple comparisons test at day 12 on treatment. (B) Real-time qPCR analysis of CXCR2 expression in A375 CXCR2KD cells relative to expression in A375 cells (n = 4). Data are represented as mean ± SEM. (C) Growth assay of A375 and A375 CXCR2KD cells treated with 1% DMSO or a combination of 0.5 µM both PLX4032 and selumetinib, cultured in nonconditioned media or conditioned media taken from unstimulated fibroblasts or fibroblasts previously stimulated with IL-1β for 48 h, detected by crystal violet staining. Data are represented as mean ± SEM from three independent experiments with nine repeats. ***, P < 0.05; unpaired Student’s t test. UT, untreated. (D) Real-time qPCR analysis of CXCR2, GROα, and IL8 expression in tumors from BRAFV600E-positive metastatic melanoma patients undergoing treatment with
BRAFi alone or a BRAFi and MEKi combination (n = 10). Each line represents relative gene expression in an individual patient pretreatment and at 10–14 d on treatment, with error bars representing mean ± SD from three repeats. (E) Real-time qPCR analysis of Groα expression in BrafV600E-4434 allografts from
C57J/B6 mice treated with 25 mg/kg/d PD184352 (n = 5) or vehicle (n = 5) for 20 d (left) and both human GROα (h-GROα) and mouse Groα (m-Groα) expression in A375 human melanoma xenografts implanted in nude mice treated with 10 mg/kg/d AZD6244 (MEKi; n = 5) or vehicle (n = 5) for 30 d (right). ***, P < 0.05; unpaired Student’s t test.
CXCR2 expression is up-regulated in the majority of tumors in patients on treatment with MAPK inhibitors (Fig. 8 D). Thus, pharmacologically inhibiting CXCR2 signaling rep-resents an attractive therapeutic approach that would prevent IL-1β–activated fibroblasts from protecting melanoma cells from MAPK inhibition. Indeed, using the potent and highly selective CXCR2 inhibitor SB225002 (Bento et al., 2008; Manjavachi et al., 2010) resulted in a significant loss of IL-1β– Fib-CM–mediated protection from BRAF/MEKi combina-tion treatment in A375 (Fig. 10 A), WM266-4 (Fig. 10 B), and also 4434 (Fig. 10 C) cells. In line with this, CXCR2 inhibi-tion blocked the IL-1β–Fib-CM–induced p65 phosphoryla-tion and BCL2 up-regulaphosphoryla-tion (Fig. 10 D). Together, these data
suggest that interfering with CXCR2 signaling could be very effective in improving responses to MAPK inhibitor therapy.
Thus, to test the effect of CXCR2 inhibition in vivo, we again used the 4434 allograft melanoma model. We treated 4434 allograft–bearing mice with an MEKi alone or in com-bination with the CXCR2 inhibitor sch-527123 (navarixin), which has been optimized for clinical use (Holz et al., 2010; Nair et al., 2012). A significant reduction in tumor growth was observed in mice treated with the combination of navarixin and MEKi compared with either treatment alone (Fig. 10 E). This suggests that targeting CXCR2 in combination with MAPK signaling could improve initial responses to MAPK inhibitors in melanoma patients.
Figure 9. cXcr2 ligands protect melanoma cells from BrAF and MEK inhibition. (A and B) Drug dose–response analysis of A375 (A) and A375
CXCR2KD (B) cell survival in response to BRAFi and MEKi, in combination with 100 ng/ml IL-8, 100 ng/ml GROα, or 100 ng/ml IL-8 and GROα for 72 h, detected by crystal violet staining. (C) Drug dose–response analysis of A375 cell survival in response to BRAFi and MEKi, in combination with 100 ng/ml IL-1β for 72 h, detected by crystal violet staining. (D and E) Drug dose–response analysis of WM266-4 (D) and 4434 (E) cell survival in response to BRAFi and MEKi as in A. Data are represented as mean ± SEM from two independent experiments where each treatment was performed on samples in triplicate.
dIScuSSIon
The biggest hurdle yet to be overcome for the treatment of disseminated melanoma using targeted therapies is the emergence of resistant disease. It is clear from our data and previous studies (Straussman et al., 2012; Smith et al., 2014; Hirata et al., 2015; Wang et al., 2015) that innate immune cells and stromal cells of the melanoma microenvironment play a role in this process in allowing melanoma cells to rapidly tolerate MAPK signaling inhibition before genetic mechanisms of resistance are acquired. We show that mac-rophages and fibroblasts are located in inflammatory niches in melanomas and are responsible for elevated IL-1 signaling in the melanoma stroma. We show that cross talk between melanoma cells, macrophages, and fibroblasts initiates an IL-1 signaling cascade that generates a CXCR2-stimulating secretome, which ultimately leads to enhanced melanoma cell survival in the presence of MAPK signaling inhibition, via BCL2 up-regulation (Fig. 10 F). We show that blocking IL-1R1 signaling or CXCR2 signaling synergizes effectively with MEK inhibition in vivo, suggesting this as a means to delay the onset of resistance that presently too frequently occurs in melanoma patients.
Monocyte differentiation into macrophages is regulated by several cytokines, including but not limited to M-CSF/ CSF-1 (Wang et al., 2012). Typically, production and release of IL-1β by macrophages requires activation of NF-κB by cytokine or Toll-like receptor signaling to induce gene ex-pression and, subsequently, activation of the inflammasomes by pathogen-associated or damage-associated molecular pat-terns to stimulate secretion (Garlanda et al., 2013). Analysis of the secretome of melanoma cells has revealed several soluble factors including cytokines such as M-CSF/CSF-1, CCL2, IFN-γ, IL-6, GM-CSF, leukemia inhibitory factor, and vascu-lar endothelial growth factor A, as well as ligands for Toll-like receptors such as high mobility group box proteins and heat shock proteins, which could participate in driving the dif-ferentiation of monocytes to macrophages and/or stimulate IL-1β expression (unpublished data; Ohanna et al., 2011; Wang et al., 2012; Obenauf et al., 2015), whereas reactive oxygen species generated by metabolically active melanoma cells or damage-associated molecular patterns released by dying mel-anoma cells could all potentially activate the inflammasomes of macrophages. The action of the various factors together in a single secretome is very complex, and indeed, they play a re-Figure 10. cXcr2i and MEKi synergizes in vivo to effectively reduce tumor growth. (A–C) Growth assay of A375 (A), WM266-4 (B), and 4434 (C) cells
treated with 1% DMSO, 0.5 µM SB225002 (CXCR2i), 0.5 µM both PLX4032 and selumetinib (BRAFi + MEKi), or 0.5 µM BRAFi, MEKi, and CXCR2i, cultured in nonconditioned media or conditioned media taken from unstimulated fibroblasts or fibroblasts previously stimulated with IL-1β for 48 h, detected by crystal violet staining. Data are represented as mean ± SEM from three independent experiments (A) or two independent experiments (B and C), with a minimum of five repeats. *, P < 0.05; **, P < 0.01; ***, P < 0.001; unpaired Student’s t test. UT, untreated. (D) Representative Western blot analysis and quantification of pp65 and BCL2 expression in A375 cells treated with 1% DMSO or 0.5 µM SB225002 (CXCR2i) cultured in conditioned media (CM) as in A for 24 h. (E) Growth of BrafV600E-4434 allografts in vehicle-treated C57J/B6 mice (n = 8), mice treated with 25 mg/kg PD184352 (MEKi; n = 8), mice treated with 30
mg/kg sch-527123 (CXCR2i; n = 5), and mice treated with 25 mg/kg PD184352 and 30 mg/kg sch-527123 (n = 5). Data are represented as mean ± SEM. ***, P < 0.001; Tukey’s multiple comparisons test at day 14 on treatment. (F) Model of cross talk among melanoma cells, macrophages, and fibroblasts located in inflammatory niches in melanoma tumors, which leads to survival in the presence of MAPK signaling inhibitors.
dundant role in inducing monocyte differentiation; moreover, it appears the expression of individual factors is highly het-erogeneous among individual melanoma cell lines (Wang et al., 2012). Therefore, trying to block IL-1β production thera-peutically would be less practicable than attempting to block IL-1 action by neutralizing antibody or receptor antagonist, which we show antagonize the protective effect conveyed by macrophages against MAPK antagonism (Fig. 6 G).
It is known from previous studies that the cells of the tumor microenvironment are themselves influenced by MAPK signaling inhibition (Hirata et al., 2015; Wang et al., 2015). We have previously observed a marked increase in the number of macrophages in human tumor biopsies from patients on treatment with vemurafenib or a combination of dabrafenib and trametinib, compared with pretreatment (Smith et al., 2014). This may potentially explain the increase in IL-1 signaling we also observed in the tumor biopsies from patients on treatment compared with pretreatment. There-fore, macrophages may be recruited to melanomas upon MAPK inhibitor treatment, which allows for a relatively quick development of drug tolerance through IL-1 signal-ing activation and subsequent stimulation of fibroblasts. This suggests that targeting this mechanism in combination with MAPK inhibitor therapy may result in a much more po-tent response in patients.
Previous work has demonstrated the importance of CXCR2 signaling for growth in mouse transplantation mela-noma models (Singh et al., 2009a,b) and other cancer models (Tazzyman et al., 2011). To our knowledge, however, CXCR2 signaling has not been previously implicated in promoting tolerance to MAPK signaling inhibition in melanoma; thus, we describe a novel mechanism by which cells can tolerate MAPK therapy. IL-8 has been shown in vitro to stimulate neu-roblastoma RAS viral oncogene homolog–mutant melanoma cell invasion in the presence of a BRAFi through paradoxical activation of the MAPK pathway. Yet, this was overcome by inhibiting MEK (Sanchez-Laorden et al., 2014). Interestingly, GROα and GROβ have been implicated in stimulating breast cancer cell metastasis and survival in the presence of che-motherapeutic agents (Acharyya et al., 2012). A combination of chemotherapy and CXCR2 inhibition effectively reduced the development of lung metastases after xenograft injections of human metastatic breast cancer cells into mice compared with either treatment alone (Acharyya et al., 2012).
Altogether, these data demonstrate the potential in ther-apeutically targeting CXCR2 in melanoma. Many CXCR2 inhibitors have been tested in animal and human trials for inflammatory conditions and have demonstrated positive ef-fects and negligible toxicity (Stadtmann and Zarbock, 2012). CXCR2 antagonism has also demonstrated significant anti-tumor activity in a preclinical model for colon cancer (Ning et al., 2012) and slowed growth and antagonized metastasis in a recombinant mouse model of pancreatic adenocarcinoma (Shi et al., 2014). Alone, we found that a 30-mg/kg dose of navarixin in clear excess of that previously shown to inhibit
neutrophil recruitment to sites of inflammation (<5 mg/kg; Chapman et al., 2007) was unable to halt the growth of im-planted 4434 cells unless combined with MEKi. Also, we failed to detect a significant effect of navarixin alone at the doses tested on the growth of established human melanoma cells in culture, although CXCR2 knockdown by RNA in-terference did modestly diminish proliferation of A375 cells. Arguably, therefore, the concentration of navarixin in both in vivo and in vitro contexts was too low to completely ablate signaling. A dose of 100 mg/kg has demonstrated a significant effect on tumor growth in vivo as a single agent (Singh et al., 2009b), supporting this theory. What is clear from our data is the superadditive effect of combining MAPK and CXCR2 inhibitors in contexts where IL-1 signaling is active.
Blockade of IL-1 signaling was even more profound than CXCR2 antagonism at augmenting a growth inhibi-tory effect of MAPK inhibition in vivo and by itself had a marked effect on tumor growth. This might reflect the po-tency of gene ablation compared with drug antagonism or that IL-1 has pleiotropic effects on tumor growth in addition to initiating CXCR2 signaling in melanoma cells. Consistent with IL-1R1 expression on endothelial cells, IL-1 promotes tumor angiogenesis (Voronov et al., 2003), which is critical for tumor growth. IL-1 has also been implicated in immuno-suppression in the tumor microenvironment through PDL1 induction in fibroblasts (Khalili et al., 2012). Therefore, IL-1 signaling could also be a promising candidate to target ther-apeutically. IL-1 blockade is used to treat a multitude of in-flammatory diseases (Dinarello et al., 2012) and is generally well tolerated in patients (Mertens and Singh, 2009; Galloway et al., 2011). Clinical experience with IL-1R1 and CXCR2 antagonists should expedite translation of our findings.
We conclude that host cell activity in the melanoma microenvironment must be considered to develop the most effective therapeutic strategy for treating melanoma. Our study illustrates that a complex web of paracrine signals re-layed between heterotypic cells within the tumor promotes treatment tolerance. We propose that targeting this network in parallel with MAPK inhibition would not only be ex-tremely effective in reducing tumor growth, but also delay relapse in melanoma patients.
MAtErIALS And MEthodS cell culture
All human melanoma cell lines and the 4434 Braf V600E mouse melanoma cell line (Table S1) as well as immortalized HFF cells (a gift from P. Caswell, The University of Manches-ter, ManchesManches-ter, England, UK) were maintained in DMEM with l-glutamine, pyruvate, and sodium bicarbonate (Sigma- Aldrich) supplemented with 10% fetal bovine serum (Thermo Fisher Scientific) and 1% penicillin/streptomycin solution (Sigma-Aldrich). PBMCs from healthy donors were isolated from leukocyte cones (National Institute for Health Research Blood and Transplant) by subjecting to density gra-dient centrifugation using Ficoll Paque Plus (GE Healthcare)
for 50 min at 400 RCF. PBMCs were transferred to flasks in serum-free RPMI 1640 Glutamax medium (Thermo Fisher Scientific) for 1 h at 37°C to allow enrichment of monocytes by adherence to tissue culture plastic. After differentiation to macrophages (see the Monocyte differentiation into macro-phages section), cells were maintained in RPMI 1640 Gluta-max medium (Thermo Fisher Scientific) supplemented with 10% fetal bovine serum and 1% penicillin/streptomycin solu-tion. NHM cells were maintained in medium 254 (Thermo Fisher Scientific) supplemented with 1% human melanocyte growth supplement (Thermo Fisher Scientific). A375 CX-CR2KD cells were generated by transfection (Lipofectamine; Invitrogen) using a previously described shRNA vector (Acosta et al., 2008), and clones were subsequently selected using puromycin. All cells were maintained under standard conditions at 37°C with 5% CO2.
Patient samples
Patients with BRAF V600E-positive metastatic melanoma were treated with either a BRAFi or a combination of BRAFi and MEKi (details outlined in Table S2). All patients gave their consent for tissue acquisition according to an MD Ander-son’s Institutional Review Board–approved protocol. Tumor biopsies were obtained before treatment (day 0), at 10–14 d on treatment, and/or at the time of progression, if applicable. Two commercially available cDNA arrays, MERT101 and MERT102 (OriGene), were analyzed for the expression of various genes in stage-III and stage-IV melanomas. The arrays consisted of cDNA derived from stage-III and stage-IV (n = 39) melanomas, staged according to the revised tumor nodes metastasis classification with minimum stage grouping (Balch et al., 2009), and from normal skin (n = 8). The expression in normal skin was set to one. β-Actin expression in each sample was used to normalize relative gene expression. Both these cDNA samples and the patient pretreatment and on-treat-ment cDNA samples had to be preamplified before qPCR analysis because of the low amount of cDNA provided. The cDNA samples were preamplified using the TaqMan PreAmp Master Mix kit (PN4384267; Applied Biosystems) using the following reaction mix: 25 µl of preamp master mix, 12.5 µl cDNA, and 12.5 µl of pooled primers (2.5 µl of each primer at 3 µM) in a 50-µl total reaction volume. All genes were amplified in the same reaction to ensure consistent pream-plification. Samples were amplified using a G-Storm thermal cycler (GRI Ltd) and the following cycling conditions: 95°C for 15 s and 10 cycles at 60°C for 4 min. After preamplifi-cation, the reaction mix was diluted fivefold to generate a useable stock for qPCR.
rnA isolation and qPcr analysis
RNA was isolated from samples using TRIzol (QIA GEN). cDNA was synthesized from RNA using the Omniscript re-verse transcription kit (QIA GEN) according to the manufac-turer’s instructions. Amplification of specific PCR products was detected using the SensiMix SYBR No-ROX kit
(Bi-oline), an Mx3000P system (Agilent Technologies), and the following cycling conditions: 95°C for 10 min and 40 cycles at 95°C for 30 s, 55°C for 45 s, and 72°C for 45 s.
The following primer sequences were used for qPCR analysis: for human genes β-actin forward, 5′-GCA AGC AGG AGT ATG ACG AG-3′ and reverse, 5′-CAA ATA AAG CCA
TGC CAA TC-3′; IL1A forward, 5′-AAT GAC GCC CTC
AAT CAA AG-3′ and reverse, 5′-TGG GTA TCT CAG GCA
TCT CC-3′; TNFA forward, 5′-TCA GAG GGC CTG TAC
CTC AT-3′ and reverse, 5′-GGA GGT TGA CCT TGG TCT
GG-3′; IL10 forward, 5′-AAG ACC CAG ACA TCA AGG
CG-3′ and reverse, 5′-CAC GGC CTT GCT CTT GTT TT-3′; CD68 forward, 5′-TCA GCT TTG GAT TCA TGC AG-3′ and reverse, 5′-AGG TGG ACA GCT GGT GAA AG-3′; SMA for-ward, 5′-ACC CAC AAT GTC CCC ATC TA-3′ and reverse, 5′-GAA GGA ATA GCC ACG CTC AG-3′; IL8 forward,
5′-GCT CAG TTT TGC CAA GGA GT-3′ and reverse, 5′-CTC
TGC ACC CAG TTT TCC TT-3′; and CXCR2 forward,
5′-GCT CTT CTT CAG GGC ACA CT-3′ and reverse, 5′-ACC
AGT GGA CAT GAG GC-3′; IL1B (Quantitect QT00021385;
QIA GEN) and GROα (Quantitect QT00199752; QIA
GEN). For mouse genes, Gapdh forward, 5′-TCT CCC
TCA CAA TTT CCA TCC CAG-3′ and reverse, 5′-GGG
TGC AGC GAA CTT TAT TGA TGG-3′; Groα (Quantitect
QT00199752; QIA GEN); Il1b forward, 5′-ATG GCA ACT
GTT CCT GAA CTC AACT-3′ and reverse, 5′-CAG GAC
AGG TAT AGA TTC TTT CCT TT-3′.
Gene expression analysis using the oncomine platform The Oncomine dataset used in this study was the Talantov melanoma dataset (Talantov et al., 2005) containing 70 sam-ples: 7 skin, 18 benign melanocytic skin nevi, and 45 cuta-neous melanoma samples. The threshold settings were set as: P-value = 1E−4, fold-change = 2, and gene rank = top 10%. The dataset was exported from Oncomine and analyzed in Prism (GraphPad Software).
Monocyte differentiation into macrophages
After thorough washing, monocytes were incubated for 7 d in RPMI 1640 Glutamax medium with 10% fetal bovine serum and 1% penicillin/streptomycin solution supplemented with 100 ng/ml human M-CSF or Mel-CM to stimulate macro-phage differentiation. To produce Mel-CM, melanoma cells were incubated in RPMI 1640 Glutamax medium for 72 h. Dead cells in the media were pelleted by centrifugation for 5 min at 200 RCF, and the media was subsequently filtered through a 0.45-µm filter. Conditioned media was diluted fourfold in fresh media before adding to culture flasks con-taining monocytes. On day 3 of incubation, 10 ml of fresh media (media supplemented with M-CSF or Mel-CM) was added to the culture flasks. Macrophages were detached by incubating with Accutase solution (Sigma-Aldrich) for 15 min followed by scraping and were subsequently seeded in tissue culture–coated plates. Cells were allowed to recover overnight before beginning assays. For the IFN-γ and LPS
stimulation of macrophages, used as a positive control for IL-1β production in Fig. 1 (E and F), differentiated macro-phages were stimulated with 100 ng/ml of human recombi-nant IFN-γ (PeproTech) for 24 h and then 20 ng/ml bacterial LPS (Sigma-Aldrich) for a further 24 h, which was directly added to the IFN-γ–supplemented media.
ELI SA
The level of IL-1β secretion by Mel-CM–treated macro-phages 24 and 48 h after differentiation (when the cells were no longer in Mel-CM) and also by mouse Mel-CM–treated macrophages 24 h after stimulation was quantified with a Duoset ELI SA (R&D Systems) according to the manu-facturer’s instructions.
IL-1β signaling blockade in fibroblasts and melanoma cell functional assay
HFF cells were cultured in conditioned media taken from
NHM macrophages (NHM-Mϕ), A375-Mϕ,
WM266-4-Mϕ, WM164-Mϕ, and MM485-Mϕ 24 h after the 7-d
differentiation period (when the cells were no longer in con-ditioned media). The media was supplemented with 1 µg/ ml normal goat IgG control (R&D Systems), 1 µg/ml IL-1β neutralizing antibody (R&D systems), or 1 µg/ml IL-1RA (PeproTech) overnight. The next morning, the cells were incubated in fresh media for 5 h, which was subsequently added to melanoma cells plated in 12-well plates with 1% DMSO (Sigma-Aldrich) or 0.5 µM both PLX4032 (Selleck Chemicals) and selumetinib (Selleck Chemicals). Then, HFF cell lysates were taken to analyze the expression of IL-6, IL-8, and GROα. After 48 h, melanoma cell survival was assayed by crystal violet staining (outlined in the Drug dose–response analysis and survival assays section).
Melanoma cell survival assay with Fib-cM
Fully confluent fibroblasts plated in T162 flasks were treated overnight with either fresh media or fresh media supplemented with 100 ng/ml human recombinant IL-1β (PeproTech). The next morning, the cells were incubated in fresh media for 5 h, which was subsequently added to melanoma cells plated in either 6- or 12-well plates for 48 h with various inhibitors. The reagents used for these experiments were 1% DMSO (Sigma-Aldrich), 1 µM PLX4032 (Selleck Chemicals), 1 µM RAF265 (Selleck Chemicals), or 0.5 µM both PLX4032 and selumetinib (Selleck Chemicals). When the duotherapy treat-ment (PLX4032 and selumetinib) was also used in combi-nation with either MK-2206, SB 225002, Bay 11-7082, or obatoclax, the concentration of each drug used was: 1 µM MK-2206 (Selleck Chemicals), 0.5 µM SB 225002 (Alfa Aesar), 0.2 µM Bay 11-7082 (Sigma-Aldrich), and 0.2 µM obatoclax (Selleck Chemicals). These concentrations were also used when these inhibitors were used as single agents. For each drug treatment, melanoma cells were cultured in non-conditioned media, non-conditioned media taken from unstimu-lated fibroblasts, or conditioned media taken from fibroblasts
previously stimulated with IL-1β. Then, cell survival was as-sayed by crystal violet staining (outlined in the next section). drug dose–response analysis and survival assays
For drug dose–responses assays, cells were plated in 96-well plates and treated with serial dilutions of PLX4032 (Selleck Chemicals) and selumetinib (Selleck Chemicals) for 72 h. For the melanoma cell survival assay with Fib-CM, melanoma cells were plated in either 6- or 12-well plates for 48 h with the various inhibitors as indicated in the figure legends. Cell survival was assayed by fixing and staining cells with 0.5% crystal violet in 4% formaldehyde. Survival was quantified by measuring the absorbance of the solubilized dye (in 2% SDS in PBS) at an optical density of 595 nm.
cytokine array
IMR-90 human diploid fibroblasts were transduced with empty MSCV-puro retroviral vector or vector encoding IL-1A as previously described (Acosta et al., 2013). IMR-90 cells were selected with puromycin 48 h after infection at a final concentration of 0.5 mg/ml for 1 wk. For the anti-body array, supernatant was harvested from cells and passed through a 0.2-µm filter to remove cells before being incu-bated with cytokine V arrays (RayBiotech) according to the manufacturer’s instructions. Signal on the membrane was developed using enhanced chemiluminescence and scanned. Scanned images were quantified using ImageJ software (Na-tional Institutes of Health).
Macrophage generation and function in Il-1r1−/− mice
Isolation and stimulation. Il-1r1−/− flox control and
knock-out mice have been previously described (Abdulaal et al., 2016) and were provided by A. Waisman (University of Mainz, Mainz, Germany), W. Muller, and E. Pinteaux (The University of Manchester, Manchester, England, UK). Bone marrow cell suspensions were collected from femurs and tibias of 8–15-wk-old mice by flushing with complete DMEM (10% FBS and 1% penicillin/streptomycin solution) using Myjec-tor U-100 insulin syringes with 29G × 0.5 needles. Cell ag-gregates were resuspended by gentle pipetting, and the solution was passed through a 40-µm nylon web. After cen-trifugation, cells were resuspended in complete DMEM sup-plemented with 15% l-929 cell–conditioned medium (as a source of M-CSF) to induce macrophage differentiation. Cells were seeded on 12- or 6-well ultra-low attachment sur-face plates (Corning) and cultured in a humidified incubator at 37°C and 5% CO2. At day 7, differentiated macrophages were washed and incubated with complete DMEM (control) or 100 ng/ml LPS (Sigma-Aldrich) and 50 ng/ml IFN-γ (Pe-proTech) or with 4434 melanoma– or NIH3T3 fibroblast– conditioned supernatant. After 24 h, cells were washed and incubated with complete DMEM for 24 h. Macro-phage-conditioned media was collected and analyzed by ELI
SA to detect mature secreted IL-1β as