ALMA MATER STUDIORUM - UNIVERSITÀ DI BOLOGNA
FACOLTA’ DI SCIENZE MATEMATICHE FISICHE E NATURALI
Corso di laurea magistrale in BIOLOGIA MARINA
Microsatellite variation and reproductive interactions of common
and Egyptian soles in Mediterranean sympatric demes
Tesi di laurea in Dispersione, Connettività e Struttura delle popolazioni marine
Relatore
Presentata da
Prof.
Fausto Tinti
Serena Montanari
Correlatore
Dott. ssa
Alessia Cariani
CONTENTS
I. ABSTRACT... I
1. INTRODUCTION...1
1.1.The Fish Pop Trace Project ...1
1.2.Target species ...2
1.2.1. Classification and morphology ...2
1.2.2. Species distribution, biology and ecology ...3
1.2.3. Cryptic species ...5
1.3.Molecular markers...5
1.3.1. Microsatellites...6
1.3.2. Internal Transcribed Spacer 1 ...7
2. AIM...9
3. MATERIALS AND METHODS...11
3.1.Sampling ...11
3.2.Lab methods ...12
3.2.1. DNA extraction ...12
3.2.2. Polymerase Chain Reaction (PCR) ...12
3.2.3. Gel and capillary electrophoresis ...12
3.3.Molecular markers and PCR conditions ...14
3.3.1. Microsatellite loci...14
3.3.2. ITS1 ...16
3.4.Microsatellites genetic data analysis ...19
4. RESULTS...23
4.1.Multiplex ITS1 PCR assay...23
4.2.Microsatellites ...26
4.2.1. Genetic diversity ...26
4.2.2. Genetic differentiation between sole species...34
4.2.3. Genetic differentiation within sole species...39
5. DISCUSSION...43
APPENDIX...49
6. REFERENCES...55
Microsatellite variation and reproductive interactions of Common and Egyptian soles in Mediterranean sympatric demes
MSc thesis of Serena Montanari
Advisors: Prof. Fausto Tinti, Dr Alessia Cariani
In the Mediterranean, the common (Solea solea) and Egyptian (S. aegyptiaca) soles are two of the most valuable flatfish fishery resources. In the past, S. aegyptiaca was erroneously synonymised with Solea solea because of the great similarity of the external rough morphology (i.e. cryptic species). Recently, the fish biologists have proven species distinctiveness mainly using mitochondrial DNA markers; however mtDNA-based molecular test can not suitable for detecting reproductive interactions among them. The common and Egyptian soles seem to co-occur in several areas of the Mediterranean forming sympatric demes. This wide sympatric distribution and the close phylogenetic relationship between the two sole species will allow a scenario for potential ecological and evolutionary interactions.
The identification and assessment of ecological and reproductive interactions of cryptic species have important implications for sustainable management and conservation of fishery resources, because different species can differently respond to environmental pressures and changes (Bickford et al., 2006); as well, these goals are important for species already considered endangered or threatened because they might be composed of multiple species that are even more rare than previously supposed (Schönrogge et al., 2002). In addition, the human activities (e.g. aquaculture and breeding programmes) have increased the risks of ecological relationships between wild and domesticated populations, as they might play significant role in the natural process of adaptation, local extinction/recolonization events, hybridization or disrupting natural selection effects. The highlighting of such ecological and genetic interactions between these two sole species in the Mediterranean basin enables the understanding of processes such as population divergence, speciation and hybridization that can create evolutionary novelty.
This thesis is a part of the EU FP7 Project "The Structure of Fish Populations and
Traceability of Fish and Fish Products” (FishPopTrace). The thesis aims to advance in the taxonomic, zoogeographic, ecological and evolutionary knowledge on the Mediterranean soles i) by developing a multiplex PCR test for the rapid screening of the
demes and iii) the possible occurrence of interspecific hybridization and/or allele introgression in mixed populations, using single-locus and multi-locus genetic assignment tests based on nuclear codominant markers as internal transcribed spacer of ribosomal DNA genes and microsatellite loci, respectively.
Sole individuals (N = 179) were collected in 2009, using commercial vessels, from four sampling sites in the Mediterranean: Viareggio, Lagoons of Cagliari (South Sardinia), Akdeniz and Antalya (Turkish coasts), and Alexandria (Egypt). All the specimens were genotyped at eight neutral microsatellite loci and at the Internal Transcribed Spacer 1 locus of the ribosomal RNA genes. Among them, 125 individuals were previously assigned to putative sole species by cytochrome b mtDNA haplotype.
The analysis of species composition in the four population samples revealed that Lagoons of Cagliari and Turkish coasts are mixed demes where the two sole species were sympatric. On the other hand, Viareggio sample was composed uniquely by S.
solea and Alexandria was almost completely formed by S. aegyptiaca (only one S. solea
individual, likely a migrant from the Turkish coasts, was found in this sample). The wider distribution of S. aegyptiaca in the Mediterranean and its frequent sympatry with
S. solea lead to argue that the two species have been frequently misidentified. Further
multidisciplinary data (i.e. combining data from morphology, reproductive biology and life history with genetic data of the same individual) obtained from new and more samples are needed to unravel distribution and ecology of S. aegyptiaca in the Mediterranean and its ecological interactions with the cryptic species S. solea.
All the analytical approaches and microsatellite datasets consistently revealed a clear genetic separation of the two species. The multilocus Fst estimate and almost all
single-locus Fst values were high and significant indicating a complete lacking of gene flow
among taxa. Individual multilocus genotypes were grouped by PCA and clustered by the Bayesian clustering method in two well-distinct groups corresponding to the putative species. These results ruled out definitely the occurrence of any past and present hybridization events between these two sole species at least in the geographical demes I have analysed. These findings were consistent with previous outcomes from Borsa et al. (2001) and She et al. (1987a) that have argued reproductive isolation between Mediterranean S. solea and S. aegyptiaca.
The panel of 8 microsatellite loci which can cross-amplify in the two Solea species can be considered one of the most versatile and powerful set of molecular markers for resolving ecological and evolutionary questions at multiple taxonomic levels (from
species to populations and individuals) in this group of flatfish species. From one to few microsatellite loci were suitable and powerful for the accurate and reliable identification of sole species. Even though the multiplex PCR ITS1 assay didn’t perform completely in the identification of hybrids between S. solea and S. aegyptiaca or viceversa, it has been proven as a rapid, costless and valuable tool for the Solea species identification, being its results 100% consistent with the microsatellite-based species assignment. All in all, using available and newly developed molecular markers (i.e. a panel of microsatellite loci and the ITS1 locus, respectively), this thesis work has improved species identification by developing rapid and discriminating PCR-based tests and the understanding of ecological and evolutionary relationships between these two species. The technological and scientific advances can be used for improving the sustainable exploitation of these two fishery resources in the Mediterranean.
1.
INTRODUCTION
1.1.
The Fish Pop Trace project
This thesis work is a part of the Small or Medium-Sized Research Project "The
Structure of Fish Populations and Traceability of Fish and Fish Products”
(FishPopTrace), an EU FP7 aiming at the development of traceability tools for an aware management of four commercially important fish species of the European seas: herring (Clupea harengus) and cod (Gadus morhua) in the FAO fishery area 27 - NE Atlantic, and hake (Merluccius merluccius) and common sole (Solea solea) in both FAO fishery areas 27 and 37 – Mediterranean and Black Sea (Stockstad, 2010).
Today, the economical activities such as fishery and aquaculture can’t leave aside a responsible management and legal exploitation of the fish stocks. The goal of FishPopTrace is to increase the knowledge of the status of bio-economically important fish species using an explorative research approach.
Human-dominated marine ecosystems are experiencing an accelerated loss of diversity at both population and species levels, with largely unknown consequences (Worm et al., 2006). The FAO estimates that today 80% of marine fish stocks are fully or overexploited worldwide, a dire situation which is further aggravated by the continuously increasing demand of fish and fish products. Additionally the fishing sector is penetrated by an extremely high level of illegal fishing activities (Stockstad 2010). Illegal, unreported and unregulated (IUU) fishing not only threaten marine ecosystems and habitats, obstruct sustainable fisheries and has highly negative socio-economic consequences, but also deeply impedes scientific fisheries assessment. Thus IUU fishing contributes to the overexploitation of fish stocks and is a hindrance to the recovery of fish populations and ecosystems (Stockhausen and Martinsohn, 2009). In fisheries management the concept of “stock” is a key-concept: stock is arbitrary group of fishes large enough to be essentially self-reproducing, with all members, of the same species, having similar life history characteristics and living in the same area (Hilborn and Walters, 1992; King, 1995). Thus, understanding stock structure of harvested species and how fishing effort and mortality are affecting stock features it’s crucial (Grimes et al., 1987) and critical to design appropriate fishery management strategies when multiple stocks are differentially exploited (Ricker, 1981). In fact, fishing is the dominant factor reducing populations and fragmenting habitats of marine
long-lived, slow-growing species and endemic species (Millenium Ecosystem Assesment 2005). Habitat fragmentation (i.e. the reduction of natural cover into smaller and more disconnected patches) compounds the effect of habitat loss (Millenium Ecosystem Assessment 2005). For this reason it is of priority importance to known the present status of the fish stocks, in order to construct management plans that take into account all biological, ecological and taxonomical data of the target species.
1.2.
Target species
1.2.1. Classification and morphology
The common sole Solea solea (Linnaeus, 1758) or Solea vulgaris (Quensel, 1806), and the Egyptian sole Solea aegyptiaca (Chabanaud, 1927) are flatfishes (genus: Solea, family: Soleidae, order: Pleuronectiformes, class: Actinopterygii). As all flatfishes they’re asymmetrical, with a flat-shape body, lying on the bottom on the left side of the body, and, as all species belonging to Soleidae family, with both eyes on the right side. The eyed side has a mimetic pigmented livery from greyish brown to reddish brown, whereas the blind side is white, without any pigmentation.
Solea solea and S. aegyptiaca are cryptic species; the sympatry of both species in some
Mediterranean areas was recently discovered. Solea aegyptiaca was considered by Quignard et al. (1984) to be a distinct species from S. solea based on allozyme polymorphisms. However, several studies based on genetic and morphometric data (i.e. number of anal fin rays, dorsal fin rays and vertebrae) have debated about this distinction (Quignard et al. 1986; Fischer et al. 1987; Goucha et al. 1987; Tinti and Piccinetti 2000; Mehanna 2007). Borsa and Quignard. (2001), using mtDNA variation, have demonstrated that S. aegyptiaca and S.solea are distinct species, and reproductively isolated from each other wherever they were found in simpatry. The Egyptian sole is morphologically identical to the common sole, and the only character
Fig.1.1: Appearance of the Common sole (Solea solea) individual at the ocular right (above) and blind left (below) sides (http://www.fao.org/fishery/species/3367/en)
vertebrae, 39-44 in S. aegyptiaca and 46-52 in S. solea (Fischer et al. 1987; Tinti and Piccinetti 2000).
Solea solea is genetically differentiated from both the closely related species S. aegyptiaca and S. senegalensis (Borsa and Quignard, 2001; Vachon et al., 2008), that
conversely seem to reproductively interact. Using a multivariate analysis of the electrophoretic polymorphism of Mediterranean S. solea, S. aegyptiaca and Atlantic-Mediterranean S. senegalensis populations, She et al. (1987a) documented the occurrence of hybrid individuals between the Egyptian and Senegalese soles, and confirmed that Solea solea is the most differentiated and reproductively isolated ancestral taxon. The reproductive interactions between S. aegyptiaca and S.
senegalensis and the occurrence of hybrids are confirmed also by a more recent work of
Ouanes et al. (2011) that resumed and expanded the work done by She et al. (1987a).
1.2.2. Species distribution, biology and ecology
The two soles species seem to have different distributions (Fig.1.2); S solea is recorded in the continental shelves of the Eastern Atlantic and Mediterranean, with preferences on sandy and muddy bottoms, from the shore down to 300 m (Rijnsdorp and Witthames 2005). S. aegyptiaca seems to be mainly present in the southern and eastern part of the Mediterranean, from the Tunisian to the Turkish and Egyptian coasts (Fisher et al. 1981;
Mehanna 2007), the southern Adriatic coasts and the Gulf of Lions (Borsa and Quignard 2001). Hence, it can be supposed that only in these latter areas, the common and Egyptian soles formed sympatric demes.
Fig.1.2: Distributions of Solea solea (red) and S. aegyptiaca (blue); (from http://www.fao.org/fishery/species/3367/en).
Both species are benthic and sedentary. Soles are carnivorous predators that ground on olfactory senses and have nocturnal habits. The sole diet mostly includes invertebrates (polychaet worms, molluscs, small crustaceans) and small fishes (Tortonese, 1975; Fischer et al., 1987).
S. solea can live up to 26 years, and the maturity is reached after the third year
(www.fishbase.org); the spawning season occurs generally in winter, showing a peak from December to March in the North Adriatic Sea (Vallisneri et al., 2001), but great
variations depending on latitude, photoperiod and temperature (Fig.1.3) are documented by Vinagre et al. (2008) and Vallisneri et al. (2001).
The ecology and life history traits of S. aegyptiaca are less documented and this could be related to the difficult to distinct it from the cryptic species S. solea. The only available work dealing with age determination of S. aegyptiaca was conducted by Ali (1995) along the Alexandria coast, who found the maximum lifespan as 3 years. Length at first sexual maturity was estimated by Mehanna (2007) as 14.2 cm for males and 15.1 cm for females. The spawning season extends from November to May with a peak in January and February (Mehanna, 2007).
From this review, it is apparent that the lack of a clearcut and affordable identification of sole individuals at the species level undermines the reaching of solid and suitable knowledge of the biological and ecological features of these two sole species economically important in the Mediterranean. In addition, because they might be sympatrically distributed in several areas of the Mediterranean, taxonomic uncertainties might lead to record strongly biased fishery data which can prevent correct stock
1.2.3. Cryptic species
Two or more species can be defined “cryptic” when they share rough external morphology, but are genetically clearly distinguishable (Bickford et al., 2006).
Some authors (Palumbi and Lessios, 2005) suggested that a cryptic species can be morphologically identical to the parental one because of the recent evolutionary divergence. Marine environmental factors might impose stabilizing selection of phenotype acting on morphology, reducing or eliminating morphological changes that can accompany speciation, thus bringing some species to morphological stasis and enabling the “origin” of cryptic or sibling species (Bickford et al., 2006). A sibling species is a cryptic sister species, that is morphologically identical to the closest relative species and hasn’t been distinguished taxonomically from that one (Bickford et al., 2006). The cryptic speciation should occur more commonly in those species that based primary biological activities, such as predation and reproductive interactions, on non-visual signals, because changes in these biological features do not necessarily need of parallel morphological changes (Bickford et al. 2006).
As S. solea and S. aegyptiaca are distinct and philogenetically distant species, and as their primary activity are based on non-visual signals, the Bickford theory (2006) could be the best explanation for these two species, that could hypothetically became cryptic because of evolutive convergence.
Identification of cryptic species and cryptic species complexes has important implications for conservation of natural ecosystems and resources management, because different species can differently respond to environmental pressures and changes (Bickford et al., 2006). In addition, species already considered endangered or threatened might be composed of multiple species that are even more rare than previously supposed (Schönrogge et al., 2002).
1.3.
Molecular markers
Molecular markers can give information about dispersal, gene flow, biogeography, kinships and phylogenetic relationships of living organisms (Avise 2004). A basic advantage of molecular markers is that, dealing with cryptic species and unknown species structures, they can make the distinction between analogous (i.e. characters that independently evolved and converged) and homologous traits (i.e. characters that are identical by descent).
Since ecology and evolution necessarily have time components the power of resolution of molecular markers used should match the time scale of interest (Feràl et al, 2002) and the goal of the study.
Molecular markers located in the mitochondrial DNA (mtDNA) are haploid and only maternally inherited, and because of the lack of recombination each haplotype has only one ancestor in the previous generation. Although mtDNA are universal, easy to be isolated and optimized, and highly informative for the reconstruction of evolutionary relationships at multiple taxonomic levels, they are not suitable for solving some evolutionary patterns and processes. For example, the detection of hybridization and gene introgression events is necessarily linked to the use of nuclear DNA codominant markers, which are biparentally inherited and can identify recent or past reproductive admixture among species, races and populations (Buonaccorsi et al., 2001).
In this study, I’ve used two types of nuclear DNA markers: a panel of microsatellite loci and a single locus corresponding to the Internal Transcribed Spacer 1 of ribosomal DNA genes (ITS1).
Microsatellite (or Short Tandem Repeats, STRs) loci might be good candidates for identification purposes, due to their high variability, codominant diploid inheritance and high discrimination power at the within-species level and at small geographical scales (Rico et al. 1996, Manel et al. 2005). In marine fishes microsatellite loci have high mutation rates, display high levels of variation and provide high statistical power in parentage testing and kinship reconstruction (Wilson and Ferguson, 2002), population identification (De Woody and Avise, 2000) and population assignment (Hauser et al., 2006). Microsatellite variation analysis usually requires the development of species-specific markers, but sometimes loci from closely related species can be used with cross-species amplification success (Maes et al 2006; Hauser and Seeb, 2008).
Ribosomal DNA (rDNA) has both rapidly and slowly evolving regions, and it is particularly useful for phylogenetic analysis (Mindell and Honeycutt, 1990); the slowly evolving coding regions are suitable for comparing distantly related species, while the more rapidly evolving non coding external and internal transcribed spacers (ETS and ITS, respectively) are suitable for resolving evolutionary relationships at low taxonomic levels (Fernandez et al., 2001). Furthermore the multicopy nature of rDNA makes this marker highly sensitive to hybridization because of the accumulation of evidence of past hybridization events (Wyatt et al., 2006).
1.3.1. Microsatellites
Microsatellites are nuclear DNA regions formed by short (1 to 6 bp) tandemly repeated sequences (Fig. 1.4) widespread in both eukaryotic and prokaryotic genomes. They are highly abundant in the intronic regions of eukaryotic genomes. Microsatellite loci are co-dominant and are considered evolutionarily neutral DNA markers. Because of their high level of polymorphism, relatively small size and rapid amplification protocols, they’re widely used for population genetic purposes (Bhargava and Fuentes, 2010). Microsatellites can be useful in providing estimates of neutral genetic variation among populations, i.e. variation with no direct effect on fitness and selection not acting upon alleles (Holderegger et al., 2006). As they’re not under selection, these markers have mutation rates between 10-3 and 10-5 mutation/locus/generation; these mutation rates are very high as compared with the rates of punctiform mutations at coding gene loci (Bhargava and Fuentes, 2010).
Selection can however act on nearby flanking regions, where the primers are designed, affecting, in some cases, the cross-species amplification. Indeed cross-species amplification between more or less distant species is a consequence of highly conserved microsatellite flanking regions (Rico et al., 1996; O’Connell and Wright, 1997).
1.3.2. Internal Transcribed Spacer 1
The internal transcribed spacer 1 (ITS1) is a non-coding region located between the conservative 18S and 5.8S rRNA genes. The ribosomal DNA genes are arranged in multiple tandem repeated units, separated one each other by non transcribed spacers (NTS) (Fig 1.6).
Designing primers on the nearby flanking 18S and 5.8S coding regions it’s possible to cross-amplify the ITS1 fragment in also highly distant species, because 18 S and 5.8S are very conserved regions as they’re under selection: this feature makes the ITS1 an universal powerful marker. The ITS1 region evolves rapidly but the homogenizing forces of concerted evolution and molecular drive (Arnheim, 1983; Dover, 1986) are believed to minimize the degree of intraspecific variation, and make the ITS region suitable for phylogenetic comparisons among closely related taxa. The ITS1 has been used for phylogenetic studies in a very wide variety of organisms, and also in fish systematics (Pleyte et al., 1992; Phillips et al., 1994; Domanico et al., 1997; Sajdak and Phillips, 1997; Booton et al., 1999; Huyse et al., 2004; Chow et al. 2006). Though successful in resolving conflicting trees derived from nuclear and mitochondrial DNA data in salmonids (Pleyte et al., 1992; Phillips et al., 1994; Domanico et al., 1997; Sajdak and Phillips, 1997) or providing new insights for complicated cichlid evolution (Booton et al., 1999), little attention has been paid to the intraspecific variation of the ITS region in these studies.
2.
AIM
The environmental and maritime policies of European Union stretch to a responsible management of the fishery resources to improve sustainable exploitation of commercial stocks and the conservation of biodiversity in harvested ecosystems. The EU FP7 project FishPopTrace has the goal to develop traceability tools suitable at both the species and population levels to be applied in the monitoring of four bio-economically important fishery resources in the European Union: Atlantic cod (Gadus morhua), herring (Clupea harengus), European hake (Merluccius merluccius) and common sole (Solea solea). Preliminary findings have revealed that in the Mediterranean two flatfish species are exploited under the commercial name of common sole, Solea solea (the true common sole) and Solea aegyptiaca (the Egyptian sole).
In the Mediterranean basin, the common and Egyptian soles are two of the most valuable flatfish fishery resources, and in the past S.aegyptiaca was erroneously synonymised with Solea solea. However, recently fish biologists have proven species distinctiveness, even though the two taxa are greatly similar for rough morphology (i.e. cryptic species). The common and Egyptian sole seems to co-occur in several areas of the basin forming apparently sympatric demes. The sympatric distribution and the close phylogenetic relationship between the two sole species will allow a scenario for potential ecological and evolutionary interactions.
Although morphological methods are very useful in fish taxonomy and fishery biology, in the case of cryptic species or in species with a large plasticity of morphological and meristic traits due to convergent selection of phenotype, they suffer of lack of power (Fisher et al., 2000). Until recently, Mitochondrial DNA (mtDNA) loci have been considered the most suitable and universal markers for taxonomical questions (Avise 2004; Ratnasingham and Hebert, 2007). However, codominant nuclear DNA (nDNA) loci have several advantages over maternally inherited and haploid mtDNA, such as the capacity to detect biparentally inherited polymorphisms and recent/past species admixture (Buonaccorsi et al. 2001, Ludwig et al. 2003).
This thesis aims to advance in the taxonomic, zoogeographic, ecological and evolutionary knowledge on the Mediterranean soles i) by developing a multiplex PCR test for the rapid screening of the two cryptic species, ii) by analysing the species composition of several geographical demes and iii) the possible occurrence of
single-locus and multi-locus genetic assignment tests based on nuclear codominant markers as internal transcribed spacer of ribosomal DNA genes and microsatellite loci, respectively.
Unravelling ecological and reproductive interactions between Solea solea and Solea
aegyptiaca is downstream relevant for improving the resource conservation and
management and for advanced understanding of evolutionary biology of marine fish. Human activities increase the frequency of ecological relationships between populations of different species as well as between wild and domesticated individuals, and they might play significant role in the natural process of adaptation, local extinction/recolonization events, hybridization or disrupting natural selection effects. The highlighting of such ecological and genetic interactions between sole species in the Mediterranean basin enables the understanding of processes such as population divergence, speciation and hybridization that can create evolutionary novelty.
3.
MATERIALS AND METHODS
3.1.
Sampling
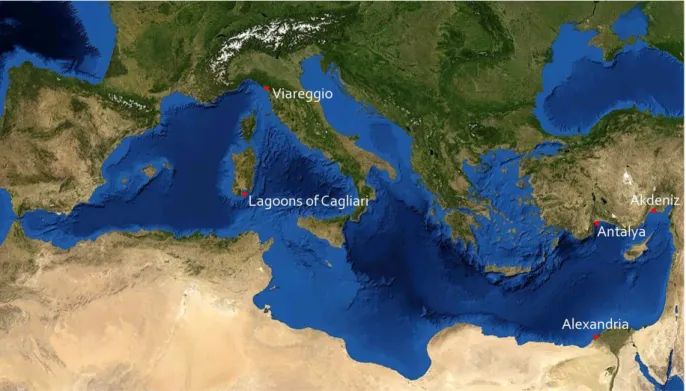
Within the FishPopTrace sampling task, sole tissue samples (N = 179) were collected from four sites (Fig. 3.1) in 2009, using commercial vessels:
- Viareggio, North Thyrrenian Sea (FAO fishery sub-area 37.1.3 – Sardinia; N = 51) - Lagoons of Cagliari, South Sardinia (FAO fishery sub-area 37.1.3 – Sardinia; N =
49)
- Akdeniz and Antalya, Turkish coast (FAO fishery sub-area 37.3.2 – Levant; N = 21) - Alexandria, Egypt (FAO fishery sub-area 37.3.2 – Levant; N = 58).
These samples were previously analysed for haplotype sequence variation of the cytochrome b (cytb) mtDNA gene fragment (MSc research work of Silvia Micheli, 2011). The cytb results revealed that population samples from Lagoons of Cagliari and Turkish coasts were composed by admixture of S. solea and S. aegyptiaca, while Viareggio and Alexandria were pure populations of Solea solea and S. aegyptiaca, respectively.
Fig 3.1: Sampling sites of common and Egyptian soles in the Mediterranean. The samples from Antalya and Akdeniz were merged in a unique sample.
3.2.
Lab methods
3.2.1. DNA extraction
Individual tissues (white muscle or finclip) were stored in ethanol 96% at -20°C. Genomic DNA was extracted from ~20 mg of tissue using the CTAB-proteinase K procedure (Winnepenninckx et al. 1993). A 2 µ L-aliquot of the extracted DNA solution was electrophoresed on a 0.8% agarose gel to control quality and quantity.
3.2.2. Polymerase Chain Reaction (PCR)
Here I’ve used both uniplex and multiplex PCR techniques; the basic difference between these two methods is that, in the uniplex PCR only one pair of primers is used whereas in the multiplex PCR from two to several primer pairs are included in the same reaction to amplify different DNA fragments. The PCR (Mullis et al., 1987) is an in-vitro enzymatic replication of the DNA. Generally, the reaction is carried out in a volume of 10–200 µL in a thermal cycler, an equipment that alternately heats and cools the reaction mixture following pre-defined steps at different temperatures and times corresponding to a denaturation step at 90-96°C, the primer annealing at ~40-60°C, and the extension/elongation phase at 72°C. These steps are repeated in a cycle for several times. The temperature and the duration of steps depend on a variety of parameters, including the enzyme used for DNA synthesis, the efficiency of primer annealing and the primers pair specificity.
3.2.3. Gel and capillary electrophoresis
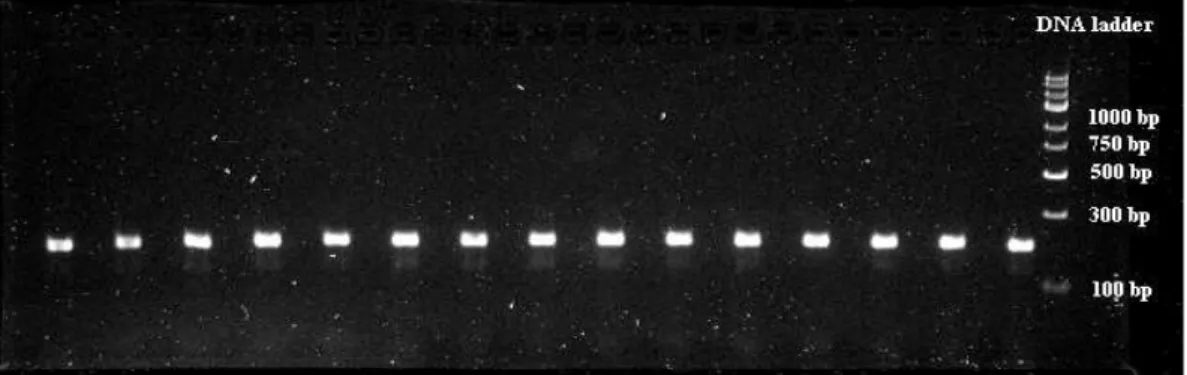
Gel electrophoresis enables the separation of nucleic acids (DNA and RNA) and proteins, based on size and charge, using an electric field applied to a gel matrix. The separation of macromolecules is performed by their migration in a gel of agarose. Negatively charged molecules (as DNA and RNA) move to the anode. The DNA fragments were visualized on a UV source by adding GelRedTM Nucleic Acid Stain (Biotium) to the agarose gel (3 µL/100mL gel). An example of the result of an electrophoresis experiment using agarose gel is reported in Figure 3.2.
Capillary electrophoresis is a family of related techniques that use narrow-bore fused-silica capillaries to perform high efficiency separations of both large and small molecules. These separations are facilitated by the use of high voltages, which may generate electroosmotic and electrophoretic flow of buffer solutions and ionic species, respectively, within the capillary. The analytes separate as they migrate due to their electrophoretic mobility, and are detected near the outlet end of the capillary thanks to their fluorescent activity. The output of the detector is sent to a data output and handling device such as an integrator or computer; the data is then displayed as an electropherogram (fig.3.3). Separated chemical compounds appear as peaks with different retention times in the electropherogram; the fragment migration time is directly related to the number of bases the fragment is composed of (http://en.wikipedia.org/wiki/Capillary_electrophoresis). The capillary electrophoresis is normally used to detect length polymorphism, as I’ve done in my study with the microsatellites.
Fig. 3.2 Agarose gel showing fluorescent bands corresponding to double-stranded DNA PCR products of about 200 bp in size. In the right lane, a DNA ladder (GeneRulerTM, Express DNA Ladder, Fermentas) was loaded to size approximately the DNA fragments.
Figure 3.3 illustrates the electropherogram of two individuals, both showing two-peak pattern at the locus labelled with a blue color. This pattern corresponds to a heterozygous genotype and each peak corresponds to an allele. Beside the effective allele (the higher blue peaks), PCR artefacts of amplification of microsatellites (stutter bands corresponding to smaller blue peaks) often were produced. The orange peak is a DNA fragment of known size (internal size standard).
3.3.
Molecular markers and PCR conditions
Two different types of markers have been used: the microsatellites loci and the Internal Transcribed Spacer 1 of the rRNA ribosomal genes (ITS1). Primer pairs for ten microsatellite loci were available from literature (see Table 3.1) whereas ITS1 species-specific primers were newly designed for the multiplex PCR.
3.3.1. Microsatellite loci
Ten microsatellites loci were selected among those available in the literature using the following criteria:
- they should be designed for Solea species;
- they cross-amplify with a good yield in both target species
Fig. 3.3: Electropherograms of a microsatellite locus amplified in sole individuals obtained with the capillary electrophoresis technique.
After a preliminary optimization work, I have chosen the loci reported in Table 3.1:
The loci 5, 7 and 8 were species-specifically developed for the Senegalese sole S.
senegalensis, but they cross-amplified also in the closely related S. solea and S. aegyptiaca. The PCR thermal cycle used for all the loci except the locus 1, for which a
touchdown PCR protocol was performed, is reported in Figure 3.4. The PCR conditions for the microsatellite loci are reported in Table 3.2.
Locus name
lab code
number Reference 5’ > 3’ Primer sequence (F and R)
target species 6 FAM-ACAAGCATGCACATATG
F8-ICA9 1 Yyengar et al.,
2000 TTATGATTCACTGTAGC
Common Sole VIC-ATCATACCAAGTGTGAGACC
F8-ITG15 2 Yyengar et al.,
2000 GCTGATTTACTGTACTTGGC Common Sole NED-GGCTGCAGAACGATCTTTAC F13 II 8/47 3 Yyengar et al., 2000 GCAACCTTGAGCTGTGACC Common Sole NED-AGGATCTGTGGTAAATCAGC
F8-IGAA 7 4 Yyengar et al.,
2000 ACATATGTGCATGCTTGTAC
Common Sole PET-GATCCGCTTGGGGTGAGG
Solga12 5 Porta and
Alvarez, 2004 TGCCATACTTCACTTGTTCG
Senegalese sole VIC-GATCCCGACACTCACAAACG
SolA 7 Porta and
Alvarez, 2004 CACCCTCAGTGTAAATTGCC
Senegalese sole
PET-AAGGCAGATGTCGATCACTGC
SolCa13 8 Porta and
Alvarez, 2004
TGAACAACGCCTAGAATTAGC
Senegalese sole not available (6-FAM-)
ERB4 10 Eveline Diopere
(KULeuven) not available
Common sole NED-GTTAGGGTAAGGGGCTATGGAA Sos (AC)30 11 Garoia et al., 2006 CTACACAGCCTCATGTCTCTGG Common Sole VIC-GAATGACAATACAGTAGAGACACG Sos (AC)40 12 Garoia et al., 2006 TTACCACTGAATGACTGACTGA Common Sole Tab. 3.1: Details of the ten microsatellite loci used in this work. Primer sequences of the locus ERB4 were provided by Eveline Diopere (KULeuven) but they are not reported because still unpublished. In the thesis, loci were referred with the lab code number. All loci are fluorescently labelled (Applied Biosystem).
94°C 94°C 04:00 00:30 72°C 72°C 00:30 07:00 Ta 00:30 x 35 cycles
The PCR amplifications were performed in 10 µL reactions following conditions reported in table 3.2.
For the genotyping, PCR products were denaturated at 95°C for 5 min and then separated in a ABI310 Genetic Analyser. Allele sizing was carried using the LIZ 500 internal size standard (Applied Biosystem) with the GeneScan® Analysis Software (Applied Biosystem). After the initial scoring, I have discarded the loci 2 and 7 because they didn’t show interpretable genotypes. Therefore, the final dataset used for the genetic variation analyses consisted of 179 individual multilocus genotypes at eight microsatellite loci.
3.3.2. ITS1
For this marker, I’ve developed a multiplex PCR to amplify species-specific DNA size markers in the two target sole species.
The entire Internal Transcribed Spacer 1 (ITS1) region of both target species was PCR amplified and sequenced using the primers developed by Kijewska et al. (2009) and reported in Table 3.3.
For both species, the final concentrations of reagents in the 10 µL PCR reactions were: - 1 X reaction buffer (Invitrogen);
- 2 mM MgCl2 (Invitrogen); Primer name 5'-->3' sequence
ITS1 F (forward) GTAGGTGAACCTGCGGAAGGATCATT ITS1 R (reverse) ATCGACGCACGAGCCGAGTGA Tab.3.3: ITS1 primer sequences
LOCUS Mg2+ (mM) Ta (°C) Number of cycles 1 1,5 51.5 (touchdown PCR) 10-35 2 1,5 61 35 3 1,5 61 35 4 2 59 35 5 1,5 57 30 7 1,5 59 30 8 1,2 59 30 10 1,2 54 30 11 1,5 57 35 12 1,5 58 35
Tab.3.2: Mg2+ final concentration, annealing temperature number of cycles used for the amplification of the microsatellite loci.
- 0,2 mM dNTP each (Promega); - 2% formamide;
- 0,5 U/µl TaqDNA polymerase (Invitrogen); - 10% of template DNA (1:5 diluted solution).
The PCR conditions consisted of 30 cycles at 94°C for 1 min, Tm for 45 sec, 72°C for
45 sec. A denaturation hold at 94°C for 5 min and a elongation at 72°C for 5 min were added before and after cycling. The annealing temperature for the S. solea was set to 50°C, whereas that for the S. aegyptiaca at 52°C. The PCR products were separated by electrophoresis on a 1.5% agarose gel.
Ten PCR ITS1 fragments (~820 bp) of S. solea and ten of S. aegyptiaca were then cycle-sequenced on both strands at Macrogen Inc., Korea. Sequences obtained were edited and aligned by MEGA 4.0 (Tamura et al., 2007) software (Fig. 3.5).
The homology of the ITS1 sequences obtained was confirmed by blasting them in the
GenBank (BLAST, Tatusova and Madden, 1999 NCBI,
http://blast.ncbi.nlm.nih.gov/Blast.cgi ).
From the initial 20 individual sequences, I’ve discarded those which resulted largely
incomplete (<500 bp) and unreadable because of the presence of several Simple Sequence Repeats. Finally, for each species I have generated a “consensus” sequence. Six species-specific ITS1 primers were designed using the software PRIMER3 (http://frodo.wi.mit.edu/primer3/) setting weak amplification conditions. Then, using the fastPCR 6.1 software (Kalendar et al., 2009), three multiplex PCR primer pairs were chosen for each species (Tab. 3.4) to amplify DNA fragments of different size. The reverse primers specific for Solea solea were paired to the primer ITS1F , whereas the forward primers specific for Solea aegyptiaca were paired to the primer ITS1R. All possible PCR products as well as the production of primer-dimers were tested in silico using fastPCR 6.1 software.
Two ITS1 primer combinations for each species were lab tested by uniplex PCR experiments: the SSr2 and SSr3 for S. solea (paired to the universal ITS1F primer), and the SAf7 and SAf10 for S. aegyptiaca (paired to the universal ITS1R primer). After the
in vitro tests, I selected the species-specific primer combinations SSr3-ITS1F and
SAf10-ITS1R because they gave higher yields of the expected PCR products
After the uniplex PCR experiments, multiplex PCR conditions were optimized with the QIAGEN® Multiplex PCR kit, which improves the amplification yield thanks to the HotStarTaq DNA Polymerase and the Q-solution. The Q-Solution is a PCR additive reagent that facilitates amplification of difficult templates by modifying the melting behaviour of template DNA, while the HotStarTaq DNA Polymerase prevents the formation of non-specific PCR products. HotStarTaq DNA Polymerase is activated at 95°C for 15 min.
The multiplex PCR was performed in 10 µL-reactions containing: - RNA-free water 2 µL;
- PCR Qiagen MasterMix 5 µL;
- Primer mix solution 1 µL (50 µL of Primer Mix solution consisted of 1 µL of each species-specific primer, 2µL of each universal primer and 44 µL of TE 1X);
- Q-solution 1µL;
- Template DNA (1:5 diluted solution) 1 µL;
The following “universal multiplex cycling protocol” proposed by the kit manufacturer was used:
- initial HotStarTaq DNA Polymerase activation step: 15 min at 95°C; - denaturation: 30 s at 94°C;
name Pairing primer
Lenght Start Product Size
SSr1 ITS1F 20 194 194 SSr2 ITS1F 20 196 196 Solea solea SSr3 ITS1F 20 193 193 SAf7 ITS1R 20 213 597 SAf8 ITS1R 20 212 598 Solea aegyptiaca SAf10 ITS1R 20 208 602
- extension: 90 s at 72°C (from step 2 to 4 for 35 cycles); - final extension: 10 min at 72°C.
Multiplexed PCR products were separated by electrophoresis on a 2% agarose gel and sized by loading 0.5 µL of an internal size standard (GeneRulerTM
Express DNA Ladder).
3.4.
Microsatellites Genetic data analysis
The complete dataset includes 179 specimens, belonging to 4 population samples (see paragraph 3.1) genotyped at the 8 microsatellites loci. A subset of 125 individuals (54 S.
solea, 71 S. aegyptiaca) evenly distributed among the four population samples, was
validated for species identification by the cytb haplotype data (Micheli, 2011). For each population sample, allele frequencies, number of alleles, allelic range, expected (He) and observed (Ho) heterozigosities per locus were calculated using the software GENETIX v. 4.05 (Belkhir et al., 1999). For each species, mean and single-population estimates of allelic richness per locus (Ar) were obtained with the software FSTAT
2.9.3.2 (Goudet, 2001). The software GENETIX 4.05 was also used to calculate single-locus Fst value, to perform a factorial correspondence analysis (AFC) of multilocus
genotypes and to create suitable input files for the downstream test and software.
The program package GENALEX v. 6.41 (Peakall, R., Smouse, P.E., 2006) was used to calculate allele frequencies at each locus within each species in order to detect private alleles and to plot genetic distances among taxa (species and populations) in the Principal Coordinates Analysis (PCA).
Deviations of allele frequencies from the Hardy-Weinberg (HW) equilibrium were tested, using the software GENEPOP v. 3.4 (Raymond and Rousset, 1995), only in the population samples of Viareggio for Solea solea, and Lagoons of Cagliari and Alexandria for Solea aegyptiaca. The sequential correction of Bonferroni for multiple tests (Rice, 1989) was applied on the significance value α (with α1= 0,05 and α2=0,01). The software MICROCHECKER 2.2.3 (Van Oosterhout et al., 2004) was used to test for scoring errors, large allele dropout and null alleles in samples affected by HW disequilibrium.
Genetic differentiation among samples within species was estimated as multilocus pairwise Fst using the software ARLEQUIN v. 3.11 (Excoffier et al., 2005), significance
The WHICHLOCI 1.0 software (Banks et al., 2003) was used to select the most discriminating loci for the species identification, by simulating 3 populations with N=100, 500, 1000 based on allele frequencies data for each species. Using both Whichrun assignment and the Allele Frequency Differential method, this approach ranks loci, by trial assignments with one locus at a time, in terms of efficiency for correct population assignment. Subsequent trials with increasing numbers of loci determine the minimum number of specific loci needed to attain user defined power for species assignment.
Genetic divergence among population samples of the two sole species was investigated both at the between-species level (whose datasets included samples and individuals of both species) and at the within-species level (whose dataset included samples and individuals of only one species), using the Bayesian model-based clustering algorithm implemented in the software STRUCTURE 2.3 (Pritchard et al., 2000). This clustering method allows to infer the number of genetic clusters in the data without making any a priori assumptions on population structure or species identity. The software assigns individuals into a predefined number of clusters (K) which may represent putative populations or species in order to achieve HW equilibrium and linkage equilibrium. Log-likelihood values for different Ks are provided. ∆K, a measure of the second order rate of change in the likelihood between successive K values, was calculated in order to accurately detect the most pronounced genetic subdivision (Evanno et al., 2005). At the between species level was used the Admixture model, frequencies independent while at the within species level was used the Admixture model, allele frequencies correlated; Monte Carlo Markov Chain steps = 105, Burnin period length = 20000 steps. The analysis was performed for each 1 <K< 5 (five iterations per K); no prior informations about the origin of samples are given in this analysis.
At the between-species level the Bayesian model-based clustering algorithm was used to assess the genetic differentiation between the two species, while, at the within-species level, it was used to assess the most likely number of groups (genetic groups) within each species. STRUCTURE 2.3 software was used also to specifically assign the individuals whose putative species was not validated by the cytb haplotype data (N=54). In this test I have used the Admixture model, allele frequencies independent (Monte Carlo Markov Chain steps = 50000; Burnin period length = 20000 steps), but also selecting the “USEPOPINFO” prior that pre-specifies the species-identity (S. solea or S.
separated in two species-specific groups 1 and 2 to assist the ancestry estimation of the 54 individuals, with species ID not validated by cytb data, sorted in a third group. The software GENECLASS 2.0 (Piry et al., 2004) was used for multilocus individual assignment test. This software computes various genetic assignment criteria to assign or exclude reference populations as the origin of diploid or haploid individuals, as well as of groups of individuals, on the basis of multilocus genotype data. In all analyses, I used a Monte-Carlo re-sampling probability computation with Rannala and Mountain (1997) Bayesian algorithm, with one thousand of simulated individuals and α error set to 0.01. The correct assignment threshold score was fixed to 0.05. The assignment of individuals to the sole species (putatively identified according to the ITS1 and cytb results when available) was carried out firstly using the entire panel of 8 microsatellite loci and secondarily, using only the loci selected by the test based on the software WHICHLOCI. The individuals of a given species were also assigned to the macro-geographical area (i.e. Eastern and Western Mediterranean), and then to the population sample to test the power of the assignment within species.
4.
RESULTS
4.1.
Multiplex PCR ITS1 assay
The multiplexed PCR ITS1 products were resolved on a 2% agarose gel: as expected by primer and marker design, specimens of the two species gave bands which differed in length; these differences provided two species-specific ITS1 band profiles (Fig. 4.1).
a) b)
c)
d)
AL_38
Fig. 4. 1: Agarose -gel separation of the ITS1 PCR amplicons in specimens of the four population samples. a) Viareggio, seven individuals displaying a S. solea multiplex PCR ITS1 profile; b) Lagoons of Cagliari, individuals displaying S. aegyptiaca (five individuals from the left) and S. solea (the last two individuals) profiles; c) Alexandria, all individuals except two displaying the S. aegyptiaca profile. The individual AL21 gave a S. solea profile while the individual AL38 gave only the S. aegyptiaca band. In the last lane of all gels, the DNA ladder GeneRulerTM, Express DNA Ladder, Fermentas, was loaded.
The S. solea individuals gave the expected 193-bp band (all specimens of Fig. 4.1A) while S. aegyptiaca individuals gave the expected species-specific band at 602 bp. However, unexpectedly putative S. aegyptiaca individuals also gave a 193-bp band; therefore the species-specific PCR profile of this species was characterized by the occurrence of the two species-specific bands at 602bp and 193bp (see for example the specimens 1-5 in Fig. 4.1B). The universal ITS1 fragment didn’t amplified in any individual. The failure of its amplification in the multiplex PCR is likely due to the larger size of this fragment than those of the species-specific fragments (820 bp vs. 193 bp in S. solea and 602 bp in S. aegyptiaca) that could have disadvantaged its amplification.
The multiplex amplification of both species-specific bands in the individuals putatively assigned to S. aegyptiaca by cytb haplotype prevented the potential discrimination of interspecific S. aegyptiaca × S. solea hybrids or gene-introgressed individuals among themselves (assuming that all S. aegyptiaca individuals can not be considered interspecific hybrids or gene-introgressed; see Discussion). On the contrary, any of the individuals putatively assigned to S. solea by cytb haplotype showed the two-band multiplex PCR ITS1 profile, ruling out the occurrence of both S. solea × S. aegyptiaca hybrids among them and individuals displaying an introgression of S. aegyptiaca ITS1 genes in S. solea.
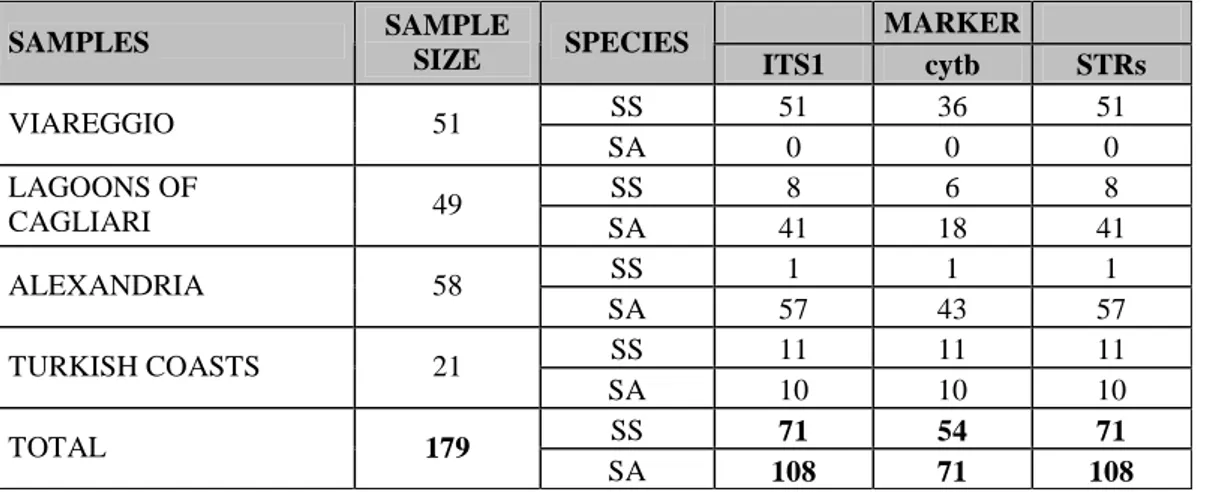
From the multiplex PCR ITS1 assay in the 179 individuals some outcomes are relevant to be outlined. The Table 4.1 reports the summary results of the ITS1 genotypes of the
Tab. 4.1: Summary results of the multiplex PCR ITS1 assay for species identification in the ITS1 and other two markers of the four population samples.
MARKER
SAMPLES SAMPLE
SIZE SPECIES ITS1 cytb STRs
SS 51 36 51 VIAREGGIO 51 SA 0 0 0 SS 8 6 8 LAGOONS OF CAGLIARI 49 SA 41 18 41 SS 1 1 1 ALEXANDRIA 58 SA 57 43 57 SS 11 11 11 TURKISH COASTS 21 SA 10 10 10 SS 71 54 71 TOTAL 179 SA 108 71 108
SS= S. solea; SA= S. aegyptiaca. The cytb validation was available only for 125 individuals, while ITS1 and STRs information were available for the whole dataset.
four population samples compared with the other two markers (cytb and microsatellites).
The multiplex PCR ITS1 assay gave evidence that the Viareggio population sample is uniquely composed by S. solea, while in the Lagoons of Cagliari and Turkish samples the two species co-occurred. All individuals from Alexandria except two (AL21 and AL38; Fig. 4.1c) exhibited a S. aegyptiaca ITS1 profile. The individual AL21, provided a S. solea profile (confirmed also by the cytb haplotype obtained during this research work and the microsatellite genotypes) while the AL38 individual gave only the 602 bp
S. aegyptiaca species-specific band. However, this latter individual did not amplify also
at several microsatellite loci and therefore the lack of the S. aegyptiaca profile was likely due to unsuitable quality of the extracted genomic DNA.
4.2.
Microsatellites
4.2.1. Genetic diversity
The mean estimates of the principal genetic diversity parameters at each of the microsatellite loci in the two sole species are reported in Table 4.2.
Tab. 4.2: Mean estimates of genetic diversity parameters and of genetic differentiation indexes between the two sole species at the eight microsatellite loci.
LOCUS 1 LOCUS 3 LOCUS 4 LOCUS 5
SS SA SS SA SS SA SS SA N 71 107 69 102 71 104 66 103 Na 6 6 11 6 6 3 18 6 Allelic Range 87-103 79-89 163-191 165-183 126-141 132-165 73-123 57-87 Ar 5.991 5.953 10.845 6 5.883 2.981 17.816 5.99 He 0.6919 0.5818 0.5561 0.4917 0.3336 0.0836 0.8236 0.7586 Ho 0.7606 0.4299 0.5652 0.2745 0.338 0.0769 0.7424 0.3883 # private alleles 4 4 7 2 4 1 16 4 Single-locus Fst 0.3239** 0.0035 0.8086** 0.2063**
LOCUS 8 LOCUS 10 LOCUS 11 LOCUS 12
SS SA SS SA SS SA SS SA N 66 102 67 102 69 107 64 107 Na 11 3 14 6 18 11 12 2 Allelic Range 167-203 170-182 266-311 239-275 139-177 145-177 172-194 164-166 Ar 10.877 3 13.948 6 17.699 10.906 12 1.953 He 0.5786 0.139 0.8552 0.5708 0.8504 0.7136 0.7938 0.0093 Ho 0.4848 0.1471 0.8657 0.4902 0.7536 0.4953 0.7031 0.0093 # private alleles 9 1 11 3 8 1 12 2 Single-locus Fst 0.6353** 0.2860** 0.1931** 0.6646** Multilocus Fst 0.4082**
Species: SS= S. solea; SA= S. aegyptiaca; N: sample size;
Genetic diversity parameters: Na: allele number; Ar: allelic richness; He: expected heterozigosity; Ho:
observed heterozigosity
Genetic differentiation indexes: # private alleles: number of private alleles; Single-locus Fst and
Multilocus Fst
Almost all mean estimates of genetic diversity resulted higher in S. solea than in S.
aegyptiaca at all loci, even though the dataset included 108 S. aegyptiaca individuals
and 71 S. solea individuals (Tab. 4.2).
This pattern was clearly detectable in the comparisons of the allelic richness and heterozygosity mean values (Fig. 4.2). In S. solea, the loci 3, 5, 10, 11 and 12 were the most variable, whereas in S. aegyptiaca the most polymorphic loci were 1, 3, 5, 10, and 11 (Table 4.2 and Fig. 4.2)
The two species displayed different distributions of allele frequencies at all loci (Fig. 4.3) except the locus 3, in which S. solea and S. aegyptiaca shared the most frequent allele. On the contrary, the two species did not share any allele at the locus 12 (Figure
Allelic Richness in SS and SA
0 2 4 6 8 10 12 14 16 18 20
LOCUS 1 LOCUS 3 LOCUS 4 LOCUS 5 LOCUS 8 LOCUS 10 LOCUS 11 LOCUS12 locus A ll e li c R ic h n e s s SS SA Observed Heterozigosity 0 0.1 0.2 0.3 0.4 0.5 0.6 0.7 0.8 0.9 1
LOCUS 1 LOCUS 3 LOCUS 4 LOCUS 5 LOCUS 8 LOCUS 10 LOCUS 11 LOCUS 12 locus O b s e rv e d H e te ro z ig o s it y SS SA
Fig. 4.2: Comparison of the allelic richness (a) and observed heterozigosity (b) mean values at each locus between the two sole species (SS: S. solea; SA: S. aegyptiaca)
a)
number was quite variable across species and loci (Table 4.2). The S. solea showed a greater number of private alleles than S. aegyptiaca and at the loci 5, 10 and 12 S. solea exhibited exceptional numbers of private alleles (> 10).
Allele Frequency for LOCUS1 0.000 0.200 0.400 0.600 0.800 1 2 3 4 5 6 7 8 9 10 LOCUS1 Locus F re q u e n c y SS SA
Allele Frequency for LOCUS3
0.000 0.200 0.400 0.600 0.800 1 2 3 4 5 6 7 8 9 10 11 12 13 LOCUS3 Locus F re q u e n c y SS SA
Allele Frequency for LOCUS4
0.000 0.500 1.000 1.500 1 2 3 4 5 6 7 LOCUS4 Locus F re q u e n c y SS SA
Allele Frequency for LOCUS5
0.000 0.100 0.200 0.300 0.400 1 2 3 4 5 6 7 8 9 10 11 12 13 14 15 16 17 18 19 20 21 22 LOCUS5 Locus F re q u e n c y SS SA
Fig.4.3: Comparison of the allele frequency distributions at the eight microsatellite loci in the two sole species S. solea (SS) and S. aegyptiaca (SA).
Allele Frequency for LOCUS8 0.000 0.200 0.400 0.600 0.800 1.000 1 2 3 4 5 6 7 8 9 10 11 12 LOCUS8 Locus F re q u e n c y SS SA
Allele Frequency for LOCUS10
0.000 0.200 0.400 0.600 0.800 1 2 3 4 5 6 7 8 9 10 11 12 13 14 15 16 17 LOCUS10 Locus F re q u e n c y SS SA
Allele Frequency for LOCUS11
0.000 0.200 0.400 0.600 1 2 3 4 5 6 7 8 9 10 11 12 13 14 15 16 17 18 19 LOCUS11 Locus F re q u e n c y SS SA
Allele Frequency for LOCUS12
0.000 0.500 1.000 1.500 1 2 3 4 5 6 7 8 9 10 11 12 13 14 LOCUS12 Locus F re q u e n c y SS SA
Fig.4.3: -continued - Comparison of the allele frequency distributions at the eight microsatellite loci in the two sole species S. solea (SS) and S. aegyptiaca (SA).
The estimates of the genetic diversity parameters at each locus in the population samples of the two sole species are reported in the Tables 4.3 and 4.3bis. The unique S.
solea individual found in the Alexandria sample was not considered in this analysis and
therefore omitted in Table 4.3.
Tab.4.3: Estimates of genetic diversity parameters and of genetic differentiation indexes in the population samples of S. solea at the eight microsatellite loci
S. solea LOCUS 1 LOCUS 3 LOCUS 4 LOCUS 5 LOCUS 8 LOCUS 10 LOCUS 11 LOCUS 12 Viareggio N 51 49 51 48 48 50 50 46 Na 6 9 5 18 10 12 16 10 Allelic range 87-103 163-189 126-141 73-123 167-203 266-311 141-177 172-192 Ar 4.009 3.316 2.387 5.963 3.998 5.925 5.485 5.191 He 0.7131 0.4896 0.3135 0.8533 0.6296 0.86 0.8275 0.8036 Ho 0.8039 0.4898 0.3333 0.8542 0.5625 0.90 0.76 0.7391 Lagoons of Cagliari N 8 8 8 6 7 5 8 6 Na 5 6 5 5 4 5 9 6 Allelic range 87-99 163-185 126-141 79-99 179-191 275-296 141-163 172-190 Ar 4.089 4.742 4.000 4.500 3.857 5.000 7.214 5.318 He 0.6667 0.7667 0.6083 0.7273 0.7143 0.7556 0.9333 0.7576 Ho 0.75 1 0.5 0.6667 0.4286 0.6 0.75 0.6667 Turkish coasts N 11 11 11 11 10 11 10 11 Na 4 6 2 5 3 7 7 5 Allelic range 89-99 167-191 132-138 79-123 176-191 269-287 139-165 174-194 Ar 3.504 3.675 1.714 3.078 2.000 5.555 5.303 3.853 He 0.619 0.5083 0.1732 0.4069 0.1947 0.8571 0.8421 0.6623 Ho 0.5455 0.5325 0.1818 0.3636 0.2 0.8182 0.7 0.5455 Single-locus Fst 0.0049 0.1312** 0.0216 0.1542** 0.0412 0.0155 0.0161 0.0343 Multilocus Fst 0.0535**
N: sample size; Na: allele number; Ar: allelic richness; He: expected heterozygosity; Ho: observed
heterozygosity.
Fst Significance level: * p < 0.01; ** p < 0.001
Deviation from Hardy-Weinberg equilibrium significance level: * p < 0.05; ** p < 0.01 reported in the Ho
Tab.4.3 bis: Estimates of genetic diversity parameters and of genetic differentiation indexes in the population samples of S. aegyptiaca at the eight microsatellite loci
S. aegyptiaca LOCUS 1 LOCUS 3 LOCUS 4 LOCUS 5 LOCUS 8 LOCUS 10 LOCUS 11 LOCUS 12
Lagoons of Cagliari N 41 37 41 38 38 38 40 41 Na 5 6 3 4 3 3 6 1 Allelic range 79-89 165-183 132-165 69-87 170-182 260-272 149-163 164 Ar 3.642 4.335 2.095 3.049 1.798 2.761 4.049 1.000 He 0.6188 0.6927 0.2002 0.5049 0.1021 0.3407 0.6747 0 Ho 0.5122 0.5946 0.1951 0.1842** 0.1053 0.2895 0.65 0 Alexandria N 56 55 54 55 55 55 57 56 Na 3 3 1 4 3 6 11 2 Allelic range 85-89 173-177 135 57-87 170-182 239-275 145-177 164-166 Ar 2.935 2.060 1.000 3.513 2.010 3.746 6.512 1.161 He 0.4921 0.2123 0 0.6901 0.1833 0.6477 0.75 0.0179 Ho 0.4286 0.0182** 0 0.5818 0.2 0.6545 0.4737** 0.0179 Turkish coasts N 10 10 9 10 9 9 10 10 Na 2 2 1 2 1 2 1 1 Allelic range 83-89 175-177 135 69-87 182 266-272 157 164 Ar 2.000 2.000 1.000 1.900 1.000 2.000 1.000 1.000 He 0.2684 0.5211 0 0.1 0 0.4248 0 0 Ho 0.1 0.5 0 0.1 0 0.3333 0 0 Single-locus Fst 0.1678** 0.2373** 0.0893* 0.3689** 0.0205 0.1619** 0.1336** 0.0091 Multilocus Fst 0.2114**
N: sample size; Na: allele number; Ar: allelic richness; He: expected heterozygosity; Ho: observed
heterozygosity.
Fst significance level: * p < 0.01; ** p < 0.001
Deviation from Hardy-Weinberg equilibrium significance level: * p < 0.05; ** p < 0.01 reported in the Ho
Within S. solea (Table 4.3), genetic diversity parameters were generally high and greatly similar across population samples. However, at some loci some population samples displayed reduced polymorphism level (locus 4, Viareggio and Turkish coasts; locus 8, Turkish coasts). The allelic richness estimates were quite homogeneous across samples at a given locus (Fig. 4.4). In S. aegyptiaca, the lower level of genetic polymorphism (already observed at the specie-level; Table 4.2) was apparent at the population level. The three samples showed a general pattern of lack or marked reduction of genetic diversity at several loci (Table 4.3bis). The absence/reduction of genetic polymorphism was more pronounced in the samples from the Eastern Mediterranean (Alexandria and Turkish coasts). In these samples, the genetic
S. solea population samples
0 1 2 3 4 5 6 7 8 LOC US1 LOC US3 LOC US4 LOC US5 LOC US8 LOC US10 LOC US11 LOC US12 locus a ll e li c R ic h n e s s VIAREGGIO CAGLIARI TURKISH COASTS
S. aegyptiaca population samples
0 1 2 3 4 5 6 7 8 LOC US 1 LOC US 3 LOC US 4 LOC US 5 LOC US 8 LO CU S10 LO CU S11 LO CU S12 locus a ll e li c R ic h n e s s CAGLIARI ALESSANDRIA TURKISH COASTS
> 50 at each locus) showed the lack of variation at the locus 4 and a reduced variation at the loci 3, 8 and 12 (Table 4.3bis; Fig. 4.4). The deviations from the HW equilibrium, were tested only in the population samples of Viareggio for S. solea, and of Lagoons of Cagliari and Alexandria (after excluding the AL21 S. solea specimen) for S. aegyptiaca, because these were statistically representative samples (N > 40). While the Viareggio S.
solea sample was at HW equilibrium at all the 8 loci, the Alexandria sample showed
significant deviations at loci 3 and 11, and Lagoons of Cagliari S. aegyptiaca sample showed a significant deviation at locus 5 (Table 4.3bis). Furthermore, the MICROCHECKER test revealed that these loci might be affected by null allele artefacts as suggested by the general excess of homozygotes, or stutter bands causing scoring errors.
4.2.2. Genetic differentiation between sole species
Genetic differentiation between the two species was high and significant, (multilocus Fst
= 0.4082, p < 0.001; Table 4.2). Almost all microsatellite loci contributed relevantly to
the genetic differentiation of the two species, being all single-locus Fst values high and
significant except that at the locus 3 (Table 4.2). The factorial correspondence analysis of the individual multilocus genotypes grouped all specimens into two well-distinct clusters corresponding to the two Solea species (Fig.4.5).
S. solea
S. aegyptiaca
Fig.4.5: Factorial correspondence analysis of the 179 sole individuals based on 8 microsatellite loci. The first axe explains 100% of the variability, showing the complete genetic distinction between the two species
The AL21 specimen from Alexandria (red circled in the Fig. 4.5) is unequivocally grouped to the S. solea cluster. This result is fully consistent with the results of the multiplex PCR ITS1 test (see paragraph 4.1) and with the cytb haplotype (see Table 4.1 and Appendix 1).
Genetic differentiation between sole species was also analysed with the Bayesian clustering approach implemented in STRUCTURE (see paragraph 3.4) using two different datasets. The first analysis was carried out on a dataset including only the individuals with species ID confirmed by ITS1 and cytb data (N=125, 54 S. solea and 71 S. aegyptiaca). The second STRUCTURE analysis was carried out using the whole dataset (N = 179, 71 S. solea and 108 S. aegyptiaca). The results of these analyses are reported in Figures 4.6 and 4.7, respectively. The software represents the identified clusters (K) through a bar plot, where in x-axis each bar represents one individual and the y-axis display the percentage value of membership to a defined cluster for each individual. The output gives back also the log-Likelihood values for the different Ks, and ∆K, that indicates the most reliable K depending on the Likelihood between successive K.
Fig. 4.6: Results of STRUCTURE clustering for the subset of individuals: a) K=2; b) log-Likelihood values for different K and c) ∆K.
a)
At the between-species level, both STRUCTURE analyses (Fig. 4.6a and Fig. 4.7a) revealed two well-distinct clusters of individuals corresponding to S. solea (cluster 1) and to S. aegyptiaca (cluster 2) individuals, without significant differences between the results obtained with the two datasets.
After that, I have carried out a STRUCTURE analysis on the whole dataset, giving the prior information of species-assignment (selecting the USEPOPINFO prior Group 1 =
S. solea; Group 2 = S. aegyptiaca) to the 125 individuals with the species identification
validated by the cytb haplotype data. The remaining 54 individuals (for which the cytb haplotype data were lacking) were assigned to a generic Group 3 (namely without a pre-defined species assignment). Within this Group 3, 54 individuals were assigned to cluster 1 and 71 to the cluster 2, corresponding to S. solea and S. aegyptiaca, respectively. The results of this analysis are displayed in Fig. 4.8.
Fig. 4.7: Results of STRUCTURE clustering of the whole dataset: a) K=2; b) log-Likelihood values for different K and c) ∆K
a)
The individual bar plot (a plot option given by STRUCTURE software) of each individual is consistent with the species ID based on the multiplex PCR ITS1 test (data not shown). It is important to note that, in all analyses, any individual did show intermediate bar plot (namely interspecific hybrid genotypes) once for all excluding the occurrence of past and present interspecific hybridization events, at least in these population samples.
Finally, the multilocus individual assignment test, performed with GENECLASS v. 2.0, also confirmed the results illustrated since now. The sole individuals were correctly assigned to the species putatively defined by the multilocus cytb-ITS1 genotype (N = 125) or by the ITS1 genotype. The assignment test performed using only the locus 12 (selected for the highest discriminative power through WHICHLOCI software) gave a ~100% of correct species assignments (data not shown). This is due to the completely different allelic ranges of the two sole species at this locus (see Table 4.2 and Fig. 4.3). Figure 4.9 illustrates the values of correct assignment obtained with GENECLASS 2.0, considering individuals assigned to i) species (bar plots 1 and 2), ii) species and Mediterranean basin (bar plots 3-6), and iii) species and populations (bar plots 7-12). All test provided percentages of correct assignment over 85%; only the S. solea sample of Cagliari has a lower self assignment value, but this could depend on the small size of the sample (N=8).
Fig. 4.8: Results of clustering analysis using the POPINFO prior information. Individuals of sample 3 (each represented by a single bar in the plot) were assigned to one of the two pre-defined species clusters.