1
Università di Pisa
Facoltà di Medicina e Chirurgia
Scuola di Specializzazione in Radiodiagnostica
Direttore: Prof. Carlo Bartolozzi
Tesi di Specializzazione
Anatomical localization of deep infiltrating endometriosis:
3D MRI reconstructions
Relatore:
Chiar.mo Prof. Carlo Bartolozzi
Candidata:
Dr.ssa Federica Forasassi
2
Index
1. Abstract
p. 3
2. Introduction
p. 5
3. Materials and methods: p. 7
3.1 Patient characteristics p. 7 3.2 MRI image acquisition protocol p. 7
3.3 3D MRI reconstructions: the semi-automatic
segmentation technique (ITK-SNAP software) p. 8 3.4 Surgery Examination p. 13 3.5 Image Analysis p. 16 3.6 Methods of Analysis p. 16 3.7 Statistical Analysis p. 18
4. Results
p. 18
5. Conclusions
p. 23
6. Bibliography
p. 26
3
1. Abstract
Purpose
The goal of this study was to determine the accuracy of 3D MRI reconstructions obtained with segmentation technique in the preoperative assessment of deep infiltrating endometriosis (DIE) and in particular to evaluate rectosigmoid and bladder wall involvement.
Materials and methods
Institutional review board approval for this study was obtained, and each patient gave written informed consent.
Fifty-seven consecutive patients with diagnosis of DIE who had undergone pelvic MRI at 1.5 T before surgery between 2007 and 2011, were retrospectively evaluated and 3D post-processed in order to obtain a detailed mapping of DIE. A blinded reader interpreted images.
MRI results were compared with surgical findings and were scored by using a four-point scale (0_3 score).
Results
36/57 patients with symptomatic DIE underwent surgery: 18/36 had endometriotic nodules infiltrating the recto-uterine pouch, 12/36 the vescico-uterine pouch and 6/36 the rectovaginal pouch.
The sensitivity of MRI and 3D-MRI versus surgery was respectively 64% versus 83%; diagnostic accuracy of 3D-MRI respect to MRI alone was 86% versus 67% for localization; 86% versus 67% for dimension; 79% versus 58% for rectosigmoid infiltration; 92% versus 75% for bladder infiltration.
4 Conclusions
In this preliminary study 3D MRI reconstructions obtained with semi-automatic method of segmentation provided encouraging results for staging DIE preoperatively.
In fact, the addition of 3D MRI reconstructions improved diagnostic accuracy and staging of DIE providing the exact volume of the lesions and enabling a precise mapping of these before surgery.
Key words: Endometriosis; MRI; 3D reconstructions; semi-automatic segmentation; wall
5
2. Introduction
Endometriosis is defined as the presence of endometrial tissue outside the uterus; in particular, deep pelvic endometriosis, also called deep infiltrating endometriosis (DIE), is defined as infiltration of the implant of endometriosis under the surface of the peritoneum (5 mm in depth) [1-4].
Although peritoneal endometriosis can be asymptomatic, DIE is a cause of pelvic pain,
dysmenorrhea, dyspareunia, dyschezia, and urinary symptoms and is frequently associated with infertility.
Since, recto-sigmoid involvement represents a severe form and occurs with a frequency of 6%–30% of cases of DIE, this disease can have a negative impact on everyday life and sexual life [5-7].
The treatment of symptomatic DIE consists of complete excision of the lesions by means of laparoscopy or robotic surgery.
Transvaginal sonography (TVUS) is recommended as first step for the diagnosis of
endometriomas and endometriosis of the bladder , but its value for the assessment of superficial peritoneal lesions, ovarian foci, and DIE is poor. Moreover, sonography may not differentiate some endometriomas from hemorrhagic cysts or other ovarian neoplasms and is insensitive in the detection of peritoneal implants.
Because of these limitations, laparoscopy or robotic surgery have remained the standards of reference for diagnosis and staging of pelvic endometriosis.
However, as laparoscopy and robotic surgery do not visualize well “atypical” non-pigmented extraperitoneal sites of involvement and regions involved by pelvic adhesions, MR imaging (MRI) has resulted the alternative and noninvasive technique for evaluation of endometriosis showing sensitivity and specificity of greater than 90% in the detection of endometriomas and peritoneal implants [8-15].
6
Therefore, the diagnosis and staging of endometriosis should guide the surgeon to schedule the most appropriate one-step surgery: conservative laparoscopic/robotic surgery treatment or open surgery with colonic resection if there is infiltrative parietal colon involvement [15-19].
The addition of 3D MRI reconstructions, obtained with semi-automatic segmentation-technique, improved diagnostic accuracy and staging of DIE providing the exact volume of the lesions, enabling a precise mapping of these before surgery and then planning the type of surgery treatment to be performed.
The goal of this study was to determine the accuracy of 3D MRI reconstructions obtained with segmentation technique in the preoperative assessment of deep infiltrating endometriosis and in particular to evaluate rectosigmoid and bladder wall involvement.
7
3. Materials and methods
3.1 Patient characteristics
Between January 2007 and May 2011, 57 consecutive patients referred for pelvic MRI because of a clinical suspicion of endometriosis were prospectively enrolled. Among these, 36 patients with symptomatic disease who underwent surgery (laparoscopic or robotic surgery) were included in our study (mean age, 28 years; range, 17–39 years).
Endometriosis was suspected because of one or more of the following symptoms: pelvic pain (36 of 36 patients), dysmenorrhea, (19 of 36 patients), dyspareunia (25 of 36 patients), recurrence of symptoms and a past history of endometriosis (11 of 36 patients).
Exclusion criteria were the common contraindications to MRI (pacemaker, metallic foreign bodies, and claustrophobia) and postmenopausal status.
3.2 MRI image acquisition protocol
MRI was performed with patients in the supine position by using a 1.5-T-whole-body MR imager (Magnetom Symphony Maestro; Siemens Medical Solutions, Erlangen, Germany) with a pelvic phased-array coil. No contrast medium was used for imaging.
Sequences acquired included thin-section high-spatial-resolution sagittal, axial and coronal T2-weighted fast spin-echo images (FSE) with the following parameter: TR 4500 ms; TE107 ms; slice thickness 3.0 mm; FoV 160 mm; Gap 0.8 mm; matrix 256 9 256; NEX 2.
Our protocol included also T1-weighted FSE sequence with fat saturation (TR 500 ms, TE 15 ms, slice thickness 3.0 mm, FoV 160 mm, Gap 0.8 mm, matrix 256 9 256, NEX 2) to detect intra-nodal hematic signal and endometriomas. The total examination time was 15 min.
Retrospectively, we post-processed MR studies previously performed, in order to obtain 3D MRI reconstructions.
8
3.3 3D MRI reconstructions: the semi-automatic segmentation technique (ITK-SNAP software)
Using MRI DICOM sagittal images radiologist made a semi-automatic segmentation of uterus, vagina, sigma-rectum, bladder and endometriotic nodules by an open source software called
ITK-SNAP (by Cognita Corporation) (Figure 1).
Figure 1. The layout of ITK-SNAP software
Image segmentation plays a crucial role in many medical-imaging applications by facilitating the delineation of anatomical structures and other regions of interest.
Segmentation is the process of dividing images into constituent subregions where anatomical structures are indicated with different colors; the colors of the different organs were chosen by the operator to facilitate differentiation (Figure 2).
9
Figure 2. The colors of the different organs chosen by the operator to facilitate their differentiation
Since the organs of the pelvic floor have complex three-dimensional (3D) structures,
three-dimensional virtual reality models of the female pelvic floor enhanced the anatomy of this complex part of the body [20-24].
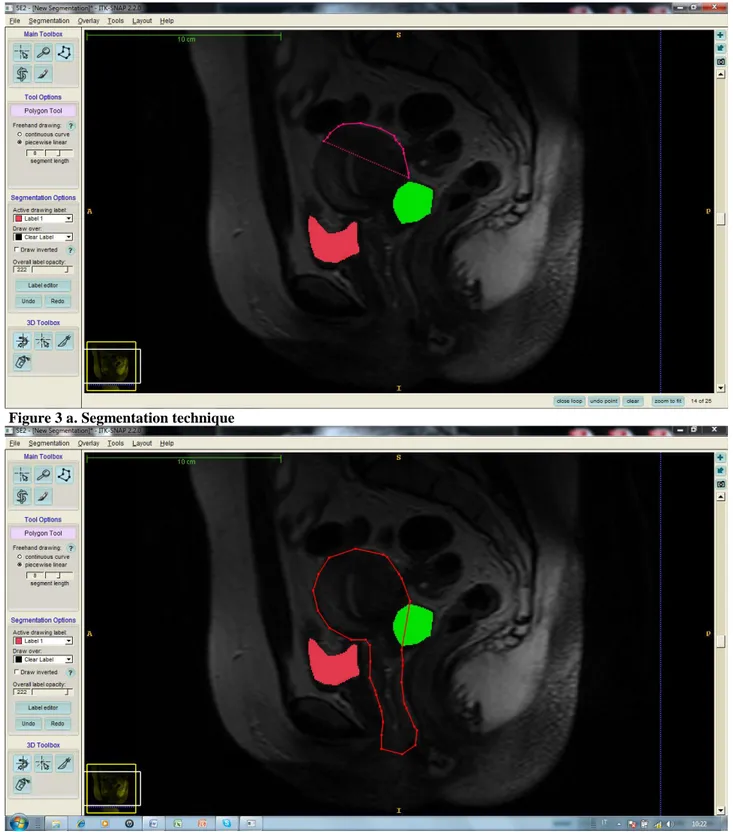
A polygonal 3D model of each segmented structure was created by the semi-automatic program which made also a surface smoothing (Figure 3a-b).
10
Figure 3 a. Segmentation technique
Figure 3 b. Segmentation technique
Methods for segmentation of medical images are divided into three generations, where each generation adds an additional level of algorithmic complexity.
The first generation is composed of the simplest forms of image analysis such as the use of intensity thresholds and region growing: this is the earliest and lowest-level processing method.
11
The second generation is characterized by the application of uncertainty models and optimization methods, and the third generation incorporates knowledge into the segmentation process.
These generations indicate progress towards fully-automatic medical image segmentation and their identification provides a framework for classifying the wide variety of methods that have been devised [25-28].
Manual segmentation is possible but is a time-consuming task and subject to operator variability. Reproducing a manual segmentation result is difficult and the level of confidence ascribed
suffers accordingly.
Automatic methods are, therefore, preferable; however, significant problems must be overcome to achieve segmentation by automatic means and it remains an active research area.
Automatic segmentation methods are classified as either supervised or unsupervised.
Supervised segmentation requires operator interaction throughout the segmentation process whereas unsupervised methods generally require operator involvement only after the segmentation is complete.
Unsupervised methods are preferred to ensure a reproducible result; however, operator interaction is still required for error correction in the event of an inadequate result [29-32]. However, segmentation of medical images involves three main image related problems. Images contain noise that can alter the intensity of a pixel such that its classification becomes uncertain, images exhibit intensity nonuniformity where the intensity level of a single tissue class varies gradually over the extent of the image, and images have finite pixel size and are subject to partial volume averaging where individual pixel volumes contain a mixture of tissue classes so that the intensity of a pixel in the image may not be consistent with any one class. These problems and the variability in tissue distribution among individuals in the human population means that some degree of uncertainty must be attached to all segmentation results. This includes segmentations performed by medical experts where variability occurs between
12
experts (inter-observer variability) as well as for a given expert performing the same segmentation on multiple occasions (intra-observer variability).
Despite this variability, image interpretation by medical experts is generally considered to be the only available truth for in vivo imaging [33].
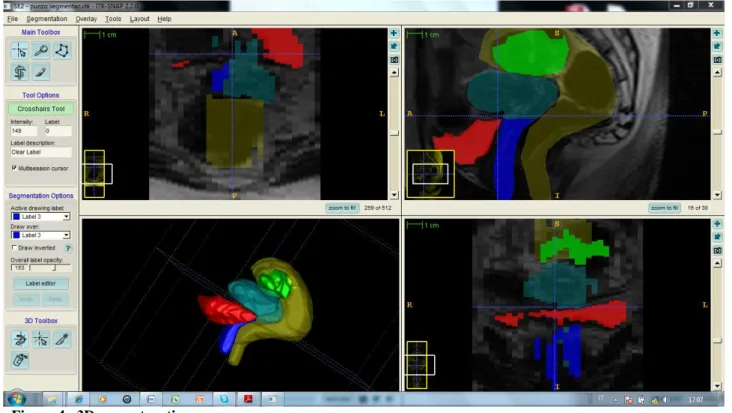
As far as concern the architecture of ITK-SNAP, it is based on “libraries” called Insight Toolkit (ITK), Visualization Toolkit (VTK) and Fast LightToolkit (FLTK): they are all open source and cross platform (Figure 4).
Figure 4. 3D reconstruction
ITK are libraries useful to implement algorithms of high level medical-image, from registration and segmentation to filtering and quantitative measures; VTK are libraries for graphic
visualization and image processing; FLTK are useful to create graphic interfaces for the users (GUI).
Graphic interface is very simple: the default configuration is made by four windows (three for 2D and one for 3D navigation).
13
We focused primarily on the segmentation of magnetic resonance (MR) pelvis images although many methods can also be applied to other image types and to images from other modalities [34].
3.4 Surgery Examination
31/36 patients underwent laparoscopy and 5/36 patients underwent robotic surgery.
For each patient, independently from technique performed, the surgeon (more than 20 years of experience in the evaluation of endometriosis) gave us a detailed report that included the location, the number of lesions and the their extension to pelvic organs, including the rectal and the bladder wall infiltration.
In 12/36 patients endometriotic nodules infiltrated bladder wall; in 19/36 patients infiltrated the rectosigmoid serosa (13/36 rectouterine pouch; 6/36 rectovaginal pouch) and the surgeon performed meticulous dissection (“slicing or shaving”) to preserve the rectosigmoid wall (Figure 5 a-b-c; 6 a-b-c; 7 a-b; 9 a-b).
14 Figure 5 c
Figure 6 a-c. Infiltrating recto-uterine pouch nodule; vescico-uterine non infiltrating nodule
15
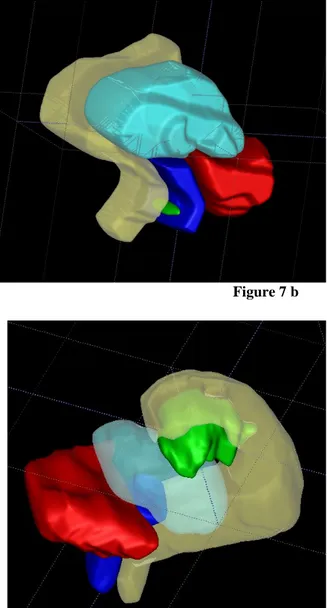
Figure 7 a-c. Recto-vaginal pouch non infiltrating nodule Figure 7 b
Figure 8 a-b. Rectal wall infiltrating nodule Figure 8 b
16 3.5 Image Analysis
A radiologist (with more than 8 years of experience in body MR imaging) who was blinded to surgical information, analyzed all 3D MRI reconstructed images obtained with semi-automatic segmentation and completed a standardized form.
MRI, 3D MRI reconstructions and their correspondence with surgery was graded on a scale from 0 to 3 (0 _Inadequate, 1 _Poorly adequate, 2 _Fairly adequate, 3 _Perfectly coincident). The scale was based on the possibility of depicting the exact localization of the lesions
(the Douglas pouch, the vagina, the rectal wall, the vescico-uterine pouch and the bladder wall). DIE was described as nodular or retractile fibrotic-like tissue that was hypointense on
T2-weighted images and isointense to muscle on T1-weighted images.
The diagnosis of endometrioma was based on the identification of a cystic adnexal lesion with characteristics of chronic bleeding: hyperintensity on fat suppressed T1-weighted images and a signal intensity decrease (“shading”) onT2-weighted images.
Adhesions and indirect signs of adhesions were also described as hypointense peritoneal strands that converged to loculated fluid collections or organ displacements.
If rectal involvement was suspected, the precise location (distance from the anorectal junction) was described and stated whether or not was present. Surgical reports were used as the reference standard.
3.6 Methods of Analysis
a) Chi-square test in small numbers of observation: Fisher's exact test
In experimental practice it is frequently necessary to check whether there is agreement between an observed distribution and the corresponding waited or theoretical distribution.
The test is defined “test for goodness of fit” for both qualitative data, that may be classified into nominal categories, both for quantitative data, distributed in classes of frequency: it is the
17 purpose for which it was proposed the chi square test.
It is one of nonparametric methods that is used to determine whether a series of data, collected in nature or in a laboratory, agreed with the specific hypothesis about their distribution or relative frequency of classes.
Chi-square test is also used to compare two or more distribution observed. It is most frequently used to verify the association between various modalities of two or more qualitative characters. It is particularly useful in the initial phase of statistical analysis when it is necessary to look for the most significant variables and the relationship of association between them.
It may test a null hypothesis (0 H ), if the frequency distribution of certain events observed in a sample is consistent with a particular theoretical distribution, or to test an alternative hypothesis when it demonstrates the existence of real difference even if the causes are unknown (1 H). The choice between the two hypothesis is based on the estimated probability with the test. It is the probability of finding by chance the observed distribution or a distribution that is further away from the expected in the condition that the null hypothesis is true.
If the probability calculated is small, the logic of statistical inference rejects the null hypothesis, implicitly accepting the alternative hypothesis.
Pearson's chi-square is the best-known of several chi-square tests statistical procedures whose results are evaluated by reference to the chi-square distribution.
Its properties were first investigated by Karl Pearson in 1900.
The chi-square test is valid only for large samples. If the number of expected frequencies is small in case of 2x2 tables must be used Fisher’s exact method.
b) Cohen test
K Cohen test is a measure of the agreement (coefficient of agreement) between the qualitative or categorical responses given by two different people (inter-observer variation) or by the same person at different times (intra-observer variation) but considering the same object.
18
Agreement is considered to be good when was between 0.6 and 0.8 and was considered to be excellent when was greater than 0.8; a K<0.6 represent a disagreement index.
3.7 Statistical Analysis
The data analysis evaluated the prevalence of infiltration detected by MRI and 3D MRI. Subsequently it has been verified the sensitivity and specificity of MRI versus 3D-MRI and then the sensitivity of these two techniques compared to surgery (gold standard).
By means of analysis between the observed and expected values (chi-square test) has been evaluated the accuracy of MRI and 3D-MRI to detect the exact site of the nodules of DIE, their volume and the grade of parietal infiltration (rectum, bladder).
In particular, to underline the best accuracy of 3D-MRI in the evaluation of recosigmoid/bladder infiltration, we estimated the intra-observer-agreement/disagreement (Cohen index).
Agreement (k coefficient ) was considered excellent when it was > 0.8, good when it resulted between 0.6 and 0.8 and evaluated as a disagreement index when <0.6.
4 .Results
In 36 (100%) of 36 patients, DIE was confirmed at surgery and histopathologic examination. 18/36 (50%) patients had endometriotic nodules infiltrating the recto-uterine pouch, 12/36(33%) the vescico-uterine pouch and 6/36 (16%) the rectovaginal pouch.
10/36 patients (27%) had endometrioma correlating with DIE and another 4/36 (11%) had also adenomyosis.
MRI detected the infiltration of recto-sigma and bladder in 23/36 (63%) patients, 3D-MRI increased this percentage to 83% (30/36). In particular, in the group of 18/36 patients with rectouterine localization, MRI revealed the infiltration in 10/18 (56%) and 3D-MRI in 13/18 (72%); in the group of 12/36 patients with vescicouterine localization MRI revealed infiltration in 9/12(75%) 3D-MRI in 11/12 (92%); in the group of 6/36 patients with rectovaginal
19
localization MRI revealed infiltration in 4/6 (67%) and 3D-MRI in 6/6 (100%) (Table 1).
Table 1. Infiltration: MRI vs 3D-MRI
If 3D MRI is considered the gold standard method, the sensitivity of MRI amounted respectively to 77% in the uterine pouch, 82% in the vescico-uterine pouch and 67% in the recto-vaginal pouch. These values pointed out the accuracy of 3D MRI to identify positive tests and its major sensitivity (Table 2).
Table 2. MRI versus 3D-MRI
Moreover were calculated the sensitivity of MRI and 3D-MRI versus surgery (Table 3).
Table 3. Sensitivity of MRI and 3D-MRI versus surgery
Also intra-observer agreement (analyzed withchi-square test) evidenced a difference statistically
Pts MRI % 3DMRI % Total 36 23/36 0.63 30/36 0.83 Recto-uterine pouch 18 10/18 0.56 13/18 0.72 Vescico-uterine pouch 12 9/12 0.75 11/12 0.92 Recto-vaginal pouch 4 4/6 0.67 6/6 1 MRI vs 3D-MRI Sensitivity (%) Specificity (%) PPV (%) NPV (%) Recto-uterine pouch 77 (10/13) 100 (5/5) 100 (10/10) 62 (5/8) Vescico-uterine pouch 82 (9/11) 100 (1/1) 100 (9/9) 33 (1/3) Recto-vaginal pouch 67 (4/6) - 100 (4/4) - MRI vs surgery 3D-MRI vs surgery Sensitivity (%) 64% 83%
20
significative (p< 0.05) between the two methods (Table 4).
Table 4. Intra-observer agreement
The analysis of qualitative data, useful to identify the size of nodules, their localization and the infiltration of contiguous structures supported the best accuracy of 3D-MRI respect to MRI alone.
In particular as far as concerned localization 3D-MRI resulted perfectly coincident (86% ) respect to MRI alone (67%) (p<0.000), (Graph 1); regard to dimension 3D-MRI resulted perfectly coincident (86% ) respect to MRI alone (67%) (p<0.000), (Graph 2); the rectosigmoid infiltration resulted perfectly coincident with 3D-MRI (79%) versus MRI alone (58%).
The poorly coincidence was 42% for MRI and 21% for 3D-MRI (p<0.006), (Graph 3); the bladder infiltration resulted perfectly coincident with 3D-MRI (92%) versus MRI alone (75%). The poorly coincidence was 25% for MRI and 8% for 3D-MRI (p<0.003), (Graph 4).
Intra-observer agreement between MRI and 3D-MRI
P
Localization 0,000
Dimension 0,000
Bladder infiltration 0,003
21
Graph 1. 3D vs MRI: localization
Graph 2. 3D vs MRI: dimension
0 5 10 15 20 25 30 35 Inadequate Poorly
adequate adequate Fairly coincident Perfectly 3D MRI 0 5 10 15 20 25 30 35 Inadequate Poorly
adequate adequate Fairly
Perfectly coincident 3D MRI
22
Graph 3. 3D vs MRI: rectal infiltration
Graph 4. 3D vs MRI: bladder infiltration
In order to confirm the differences between MRI and 3DMRI findings detected by means of radiologist qualitative analysis, it was calculated Cohen’s K coefficient: for each evaluated finding (localization, dimension, parietal infiltration) the K Cohen indexes resulted lower than concordance parameters, demonstrating the effective discordance (all K coefficients were < 0.6) between MRI and 3DMRI and than validating the greater efficacy of MRI supported by 3D reconstructions. 0 2 4 6 8 10 12 14 16 18 20 Inadequate Poorly
adequate coincident Perfectly 3D MRI Fairly adequate 0 2 4 6 8 10 12 Inadequate Poorly
adequate adequate Fairly coincident Perfectly 3D MRI
23
Table 5. Agreement/disagreement obtained analyzing MRI and 3DMRI findings
5. Conclusions
Our study results showed an excellent correlation of 3D MRI reconstructions with surgical examination findings of DIE. In particular, 3D MRI reconstructions detected the specific locations and dimension of the endometriosis nodules with a higher sensitivity (83%) and diagnostic accuracy (86%).
Due to this, the addiction of 3D MRI reconstruction in the future could influence the decision of the surgeon to perform laparoscopy or robotic surgery rather than more extensive surgery, providing the precise preoperative mapping of deep endometrial lesions especially in forms of advanced endometriosis (stage IV) infiltrating rectosigmoid colon or bladder.
In our series, the prevalence of rectosigmoid wall involvement was high and the correlation between 3D MRI and surgery just about the degree of invasion of this structure resulted excellent (Cohen k coefficient of 0.28).
On the hand anterior deep endometriosis is much less frequent than posterior involvement and involves the vescicouterine pouch and the bladder. Bladder involvement occurs in 2-6.4 % of patients [6] and also at this level 3D MRI imaging resulted accurate (Cohen k coefficient of 0.39).
In our study, we had 12/36 cases of anterior deep endometriosis that infiltrated the bladder: while Concordance of MRI and 3DMRI findings
K di Cohen
Localization 0,16
Dimension 0,18
Bladder infiltration 0,39
24
conventional MRI correctly identified 8/12 cases, 3D MRI reconstructions depicted correctly 11/12 cases of bladder involvement identifying also the smaller lesion (<1 cm): we missed one case because the bladder was empty.
18/36 patients had the endometriosis nodules localized into the rectouterine pouch: 10/18 cases were correctly identified at conventional MRI, while 3D MRI reconstructions depicted correctly 13/18 cases of rectosigmoid wall involvement and any case was missed.
6/36 patients had the nodules localization into the rectovaginal pouch: 4/6 cases were correctly identified at conventional MRI, while 3D MRI reconstructions we depicted correctly 6/6 cases of rectal wall involvement and any case was missed.
The assessment of endometriosis may be laborious for the patient, who may undergo multiple examinations like transvaginal US, transrectal US, barium enema, cystoscopy, and rectoscopy. Instead, MRI imaging supported by 3D MRI reconstructions enabled complete visualization of the pelvis and therefore could be the preoperative imaging technique of choice for the
assessment of patients with a clinical suspicion of DIE also assessing the infiltration of rectosigmoid and bladder walls.
Future research in the segmentation of medical images will strive toward improving the accuracy, precision, and computational speed of segmentation methods, in order to reduce the amount of manual interaction by incorporating prior information from atlases and by combining discrete and continuous spatial-domain segmentation methods [20].
Not all 57 patients underwent surgery, so we do not know the accuracy of 3D MRI
reconstructions in our total study population; including only patients who underwent surgery likely skewed our results, because of the poorly population study.
Our surgeon knew the results of the MRI examination, and also this could have biased results at surgery.
Finally, because our population was selected in a referral center, it was biased for the prevalence of endometriosis.
25
In conclusion, pelvic MRI supported by 3D MRI reconstructions provided encouraging results for the diagnosis and the preoperative planning of DIE providing the exact volume of the lesions and enabling a precise mapping of these before surgery resulting particularly valuable as image- guided surgery techinque, in wich visualization of anatomy is a critical component.
26
6. Bibliography
1. K.Kinkel, K.A.Frei, C.Balleyguier, C.Chapron. Diagnosis of endometriosis with imaging: a review. Eur Radiol (2006) 16: 285–298DOI 10.1007/s00330-005-2882-y
2. Cornillie FJ, Oosterlynck D, Lauweryns JM,Koninckx PR. Deeply infiltrating pelvic endometriosis: histology and clinical significance. Fertil Steril 1990;53(6):978–983.
3. Koninckx PR, Meuleman C, Demeyere S, Lesaffre E, Cornillie FJ. Suggestive evidence that pelvic endometriosis is a progressive disease, whereas deeply infiltrating endometriosis is associated with pelvic pain. Fertil Steril 1991;55(4):759–765.
4. Anaf V, Simon P, El Nakadi I, et al. Relationship between endometriotic foci and nerves in rectovaginal endometriotic nodules. Hum Reprod 2000;15(8):1744–1750.
5. Anaf V, Simon P, El Nakadi I, Simonart T, Noel J, Buxant F. Impact of surgical resection of rectovaginal pouch of Douglas endometriotic nodules on pelvic pain and some elements of patient’s sex life. J Am Assoc Gynecol Laparosc 2001;8(1):55–60.
6. Chapron C, Fauconnier A, Vieira M, et al. Anatomical distribution of deeply infiltrating endometriosis: surgical implications and proposition for a classification. Hum Reprod 2003;18(1):157–161.
7. Chapron C, Chopin N, Borghese B, et al. Deeply infiltrating endometriosis: pathogenetic implications of the anatomical distribution. Hum Reprod 2006;21(7):1839–1845.
8. Nisolle M, Donnez J. Peritoneal endometriosis, ovarian endometriosis and adenomyotic nodules of the rectovaginal septum are three different entities. Fertil Steril 1997;68(4): 585–596.
9. Re´genet N, Me´tairie S, Cousin GM, Lehur PA. Colorectal endometriosis: diagnosis and management [in French]. Ann Chir 2001; 126(8):734–742.
27
endometriosis: results on pelvic pain symptoms according to surgical classification. J. Minim Invasive Gynecol 2005;12(2):106–112.
11. Bazot M, Darai E, Hourani R, et al. Deep pelvic endometriosis: MR imaging for diagnosis and prediction of extension of disease. Radiology 2004;232(2):379–389.
12. Kinkel K, Frei KA, Balleyguier C, Chapron C.Diagnosis of endometriosis with imaging:
a review. Eur Radiol 2006;16(2):285–2987.
13. Reinhold C, McCarthy S, Bret PM, et al. Diffuse adenomyosis: comparison of Endovaginal US and MR imaging with histopathologic correlation.
Radiology 1996;199(1): 151–158.
14 . Togashi K, Nishimura K, Kimura I, et al. Endometrial cysts: diagnosis with MR imaging. Radiology 1991;180(1):73–78.
15. Woodward PJ, Sohaey R, Mezzetti TP Jr. Endometriosis: radiologic-pathologic correlation. RadioGraphics 2001;21(1):193–216.
16. Kinkel K, Chapron C, Balleyguier C, Fritel X, Dubuisson JB, Moreau JF. Magnetic Resonance imaging characteristics of deep endometriosis. Hum Reprod
1999;14(4):1080–1086.
17. Del Frate C, Girometti R, Pittino M, Del Frate G, Bazzocchi M, Zuiani C. Deep Retroperitoneal pelvic endometriosis: MR imaging appearance with laparoscopic correlation. RadioGraphics 2006;26(6):1705–1718.
18. Vercellini P, Meschia M, De Giorgi O, Panazza S, Cortesi I, Crosignani PG. Bladder detrusor endometriosis: clinical and pathogenic implications. J Urol 1996;
155(1):84–86.
19. Balleyguier C, Chapron C, Dubuisson JB, et al. Comparison of magnetic resonance Imaging and transvaginal ultrasonography in diagnosing bladder endometriosis. J Am Assoc Gynecol Laparosc 2002;9(1):15–23.
28
20. Annu. Rev. Biomed. Eng. 2000. 02:315–37 Currentmethods in medical image Segmentation. Dzung L. Pham, Chenyang Xu2, and Jerry L. Princ.e
Department of Electrical and Computer Engineering, The Johns Hopkins University, Baltimore, Maryland.
21. Grimson WEL, Ettinger GJ, Kapur T, Leventon ME, Wells WM, et al. 1997. Utilizing segmented MRI data in image-guided surgery. Int. J. Pattern Recognit. Artif. Intell. 11:1367–97
22. Haralick RM, Shapiro LG. 1985. Image segmentation techniques. Comput. Vis. Graph. Image Proc. 29:100–32
23. Gonzalez RC, Woods RE. 1992. Digital Image Processing. Reading, MA: Addison-Wesley. 716 pp.
24. Pal NR, Pal SK. 1993. A review on image segmentation techniques. Pattern Recognit. 26:1277–94
25 . Langan DA, Modestino JW, Zhang J. 1998. Cluster validation for unsupervised stochastic model-based image segmentation. IEEE Trans. Image Process. 7:180–95
26 . Khaneja N, Miller MI, Grenander U.1998. Dynamic programming generation of curves on brain surfaces. IEEE Trans. Pattern Anal. Mach. Intell.
20:1260–65
27. Pham DL, Prince JL. 1999. An adaptive fuzzy c-means algorithm for image
segmentation in the presence of intensity inhomogeneities. Pattern Recognit. Lett.
20:57–68
28. D.L. Pham, C. Xu, J.L. Prince, “Current methods in medical image segmentation,” Annu. Rev. Biomed. Eng., vol. 2, pp. 315-337, 2000. 29. Medical Image Segmentation: Methods and Software.
29
Department of Biomedical Engineering. University of Alberta, Edmonton, Alberta, Canada.
30. L.P. Clarke, R.P. Velthuizen, M.A. Camacho, J.J. Heine, M. Vaidyanathan, L.O. Hall, R.W. Thatcher, M.L. Silbiger, “MRI segmentation: Methods and applications,” Magn. Reson. Imaging, vol. 13, no. 3, pp. 343-368, 1995.
31. J.C. Bezdek, L.O. Hall, L.P. Clarke, “Review of MR image segmentation techniques using pattern recognition,” Med. Phys., vol. 20, no. 4, pp. 1033- 1048, 1993.
32. S.D. Olabarriaga, A.W.M. Smeulders, “Interaction in the segmentation of medical images: A survey,” Med. Image Anal., vol. 5, pp. 127-142, 2001. 34. Facoltà Di Ingegneria-CDLS in Ingegneria Biomedica.
Segmentazione di Immagini MDCT per la Pianificazione di Interventi di Chirurgia Pancreatica tramite Visualizzazione 3D. Prof.Andrea Pietrabissa, Ing. Vincenzo Ferrari, Ing.Marina Carbone.