Alma Mater Studiorum – Università di Bologna
DOTTORATO DI RICERCA IN GEOFISICA
Ciclo XXX
Settore Concorsuale: 04/A4
Settore Scientifico Disciplinare: GEO/10
Modelling ash cloud dispersion and the impact of ash
aggregation during volcanic eruptions
Presentata da:
Matthieu Poret
Coordinatore Dottorato
Supervisore
Prof. Nadia Pinardi
Dr. Antonio Costa (INGV)
Co-supervisore
Prof. Michele Dragoni (UNIBO)
3
Department of Geophysics
University of Bologna
Bologna, Italy
Modelling ash cloud dispersion and the impact
of ash aggregation during volcanic eruptions
5
Ph.D. supervision
Supervisor: Dr. Antonio Costa INGV – Bologna
Co-supervisor: Prof. Michele Dragoni University of Bologna
Examination
Reviewer: Dr. Giovanni Macedonio INGV – OV – Naples
Reviewer: Dr. Larry Mastin USGS – Vancouver (USA)
Jury
Dr. Alberto Amigliato University of Bologna
Dr. Umberto Giostra University of Bologna
6
“ La Recherche ? C’est cartographier le terrain de la Vie ! ”
8
Riassunto
Il continuo miglioramento nella caratterizzazione dei processi eruttivi è tipicamente ottenuto attraverso l'integrazione di analisi di dati di campagna, strumenti di telerilevamento, esperimenti di laboratorio e modelli numerici. Da un punto di vista computazionale, l'interdipendenza dei principali parametri vulcanologici rende ardua la valutazione della dispersione e della sedimentazione del tefra, a partire dai quali vengono stimati il tasso di eruzione di massa, la massa totale eruttata e la distribuzione granulometrica totale (TGSD). Questa tesi mira a vincolare meglio la valutazione dei parametri della sorgente eruttiva (ESP) e in particolare della TGSD, di solito derivata utilizzando solo dati dall'analisi dei campioni di campo. In particolare la stima della frazione di cenere finissima (cioè <30 μm), all'interno del TGSD, soffre comunemente della mancanza di dati di campo distale, specialmente per le eruzioni basaltiche che contengono poco materiale fine. Inoltre, l'aggregazione delle particelle vulcaniche influenza la dispersione delle ceneri e quindi la deposizione. Sebbene le simulazioni numeriche possano tenere conto dell'aggregazione delle ceneri, hanno bisogno di una TSGD accurato come input. Qui, utilizzo il modello FALL3D insieme a dati satellitari e di campagna per quantificare i) la frazione di cenere finissima e l'effetto sui risultati della simulazione e ii) l'occorrenza e la rilevanza nei processi di trasporto dell'aggregazione delle ceneri. Innanzitutto, mi concentro sull'integrazione dei dati di campo e da satellite per stimare meglio la TGSD e in particolare la frazione di PM10. La metodologia, che integra le misurazioni di campo e i dati
satellitari per migliorare la caratterizzazione del TGSD iniziale, viene applicata prima al parossismo dell'Etna del 23 febbraio 2013 ed in secondo luogo all'eruzione dell'Etna del 23 novembre 2013. Queste due eruzioni sono state considerate perché hanno beneficiato del trasporto dovuto all’azione di venti nord-orientali che hanno disperso il tefra verso la regione Puglia (Italia meridionale, ~ 410 km dalla sorgente), consentendo una raccolta di campioni fino a zone molto distali. Poi sono stati studiati i processi di aggregazione delle ceneri che hanno caratterizzato l'eruzione esplosiva di La Soufrière Saint Vincent il 26 aprile 1979. Durante questo evento, è stata osservata una significativa frazione di ceneri aggregate che ha contribuito a una prematura ricaduta del tefra dalla bocca eruttiva all'Isola di Bequia (36 km a sud). Ho selezionato questa eruzione per studiare l'effetto dell'uso di vari TGSD insieme a diversi schemi di aggregazione sul risultante carico di tefra e sulla dispersione di cenere.
9
Abstract
Improvements for characterizing eruption processes are made commonly through field data analysis, remote-sensing instruments, lab experiments and numerical models. From a computational point of view, the inter-dependency of the main volcanological parameters makes challenging the assessment of tephra dispersion and sedimentation, from which mass eruption rate, total erupted mass, and Total Grain-Size Distribution (TGSD) are typically estimated. This thesis aims at better constraining Eruption Source Parameters (ESP) and in particular the TGSD, usually derived from field sample analysis only. The estimation of very fine ash (i.e. < 30 μm) fraction, within the TGSD, commonly suffers from the lack of distal field data, especially for basaltic eruptions, which contain a small fraction of fine ash. Besides, particle-particle aggregation affects ash dispersal and deposition. Although numerical simulations can account for ash aggregation, they need an accurate TSGD as input. Here, I report the use of the FALL3D model together with airborne and ground-based data in order to quantify i) the very fine ash and the effect on the simulation results and ii) the occurrence of ash aggregation during ash transport. I focus on the integration of field and satellite data to better estimate the TGSD and the PM10 fraction especially. The methodology, which integrates
the field, ground-based and satellite measurements to improve the characterization of the initial TGSD, is applied first to the 23rd February 2013 Etna paroxysm, then to the 23rd November
2013 Etna eruption. These two eruptions were considered because they benefited from north-easterly winds which dispersed the tephra towards the Puglia region (southern Italy; ~410 km from source), allowing collection of field samples to very distal areas. Then, I studied ash aggregation processes characterizing the explosive eruption of La Soufrière Saint Vincent on 26th April 1979. During this event, a significant aggregate fraction was observed contributing to premature tephra fallout from the vent to Bequia Island (36 km southwards). This eruption was selected to investigate the effect of various TGSD together with different aggregation schemes on the resulting tephra loading and ash dispersal.
10
Preamble
This study reports the results obtained using both volcanic plume (FPlume) and tephra dispersal models (FALL3D) to numerically reconstruct the main eruption features (e.g. bulk tephra loading, airborne ash spreading, Total Grain-Size Distribution – TGSD and ash aggregation). The work brings together studies based on the quantification of fine ash fraction and the effect of ash aggregation on the tephra dispersal and sedimentation. Chapter I is a review of the literature about tephra characterization and tephra hazards. Chapter II is an overview of the approach used for tephra dispersal models. Chapter III describes the available observational data (e.g. field samples, ground-based and satellite remote sensing systems) that can be used to solve an inverse problem aimed to estimate the Eruption Source Parameters (ESP). Chapter IV is a study that aims at integrating field and satellite measurements for characterizing the TGSD and thereby the airborne ash fraction through numerical simulations. Chapter IV is under review for publication to Journal of Geophysical Research – Solid Earth. Chapter V proposes a method to reconstruct the TGSD by means of field, weather radar and satellite data, evaluating quantitatively the airborne ash mass. Chapter V is accepted for publication to Atmospheric Chemistry and Physics Discussions journal. Chapter VI studies ash aggregation implemented within numerical models. Chapter VI is published in Journal of Volcanology and Geothermal Research. Chapter VII reports the findings of this study and highlights the outlook for future work. Only minor changes have been made for adapting to the overall structure of the manuscript.
1. Poret M., Costa A., Andronico D., Scollo S., Gouhier M. and Cristaldi A. Modelling eruption
source parameters by integrating field, ground-based and satellite-based measurements: The case of the 23rd February 2013 Etna paroxysm. J. Geophys. Res. – Solid Earth, Accepted pending
revision.
2. Poret M., Corradini S., Merucci L., Costa A., Andronico D., Vulpiani G., Scollo S., Montopoli
M. and Freret V. Magma fragmentation assessed from field, ground-based and satellite data: Application to the 23rd November 2013 Etna paroxysm. Atmos. Chem. Phys. Discuss., In press.
doi:10.5194/acp-2017-1146
3. Poret M., Costa A., Folch A. and Martí A. Modelling tephra dispersal and ash aggregation: The
26th April 1979 eruption, La Soufrière St. Vincent. J. Volcanol. Geotherm. Res. 347, 207–220.
11
Acknowledgments
I would like to thank my supervisor Dr. Antonio Costa for giving me the opportunity to carry out my research studies within the ITN VERTIGO project. I enjoyed every single day being aware about how lucky I was to share such large-scale experiences with you the last three years. I also acknowledge my co-supervisor Prof. Michele Dragoni for having helped me providing advice and feedback during my thesis.
Je remercie Margaux, mon amie, mon équipière, mon aventurière, ma Red, pour m’avoir accompagné et surtout m’avoir écouté sans jamais faillir depuis que tu es à mes côtés ! Tu as su faire preuve de patience et d’organisation pour optimiser (organiser??) notre expérience qu’on continue ensemble.
I would like to warmly thank the entire VERTIGO group that offered the full experience for researchers all around the world. Indeed, thank you Ulli, Diego and Greta for having wished for such a network! VERTIGO does not only mean “Volcanic ash: fiEld, expeRimenTal and numerIcal investiGations of prOcesses during its lifecycles” but also Basti, Stefano, Andreas,
Vale, Pablo, Inga, Joalie, Katrin, Ines, Pierre-Yves, Antonio, Ka Lok!
Great thanks also to the volcanologists I met all around the world, Marco, Boris, Antonio, Jon, Costanza, Tullio, Jacopo, Pierre, Yujiro, Stefano, Luca, Mark, Claire, Antonio and so many others who showed me this amazing world.
A special thanks goes to INGV (Bologna section), Dr. Francesca Quareni, for having hosted me these last three years and supported me for travelling around the world. Thanks to INGV– OE (Catania section), Daniele Andronico and Simona Scollo for having hosted me during 1 month of secondment offering me the possibility to discover research near an active volcano. Thanks to the Civil Protection Department (Rome), Drs. Mauro Rosi, Stefano Ciolli, Gianfranco Vulpiani, Antonio Ricciardi and Damiano Piselli for having hosted me in your department for a month of training. The team completed by Domenico Mangione and Luigi Coppola taught me for example on how to share a real coffee.
Thanks to the 80-90’s department of the INGV of Bologna, i.e. Letizia, Julie & Carmine, Valentina, Brunella, Francesca, Giulia, Tahira, Pablo, Davide, Paolo, Simone and Sarfraz for having shared all these moments with me inside and outside the institute.
I would like to acknowledge Dr. Giovanni Macedonio (INGV–OV, Naples, Italy) and Dr. Larry Mastin (USGS, Vancouver, USA) for having accepted to review my thesis manuscript.
12
Table of Contents
Chapter I – Introduction ... 19
I.1 Eruption style ... 19
I.2 Tephra classification ... 19
I.3 Volcanic ash hazard ... 21
I.4 Magma fragmentation – Total Grain-Size Distribution ... 22
I.5 Volcanic ash aggregation ... 25
Chapter II – Tephra dispersal modelling ... 27
II.1 The source terms ... 27
II.2 Meteorological fields ... 29
II.3 Formulation of tephra dispersal models ... 30
II.4 Ash aggregation modelling ... 34
Chapter III – Observational data and inversion procedure... 38
III.1 Field data ... 38
III.2 Satellite-based data ... 40
III.3 Ground-based data ... 42
III.3.1 Seismic tremor signal ... 42
III.3.2 Visible and Infrared images ... 42
III.3.3 Weather radar ... 43
III.3.4 L-band Doppler radar – VOLDORAD 2B ... 44
III.3.5 AERONET data ... 45
Chapter IV – Etna paroxysmal episode of the 23rd February 2013 ... 47
Abstract ... 48
Introduction ... 49
Chronology of the 23rd February 2013 eruption ... 52
Modelling approach: FPlume and FALL3D models ... 54
Observational data and methodology ... 55
Results ... 61
Discussion ... 69
13
Acknowledgements ... 73
Chapter V – Etna paroxysmal episode of the 23rd November 2013 ... 74
Abstract ... 75
Introduction ... 76
The 23rd November 2013 Etna lava fountain ... 79
Methodology ... 82
Results and Discussions ... 90
Conclusions ... 99
Acknowledgments ... 100
Chapter VI – Modelling tephra dispersal and ash aggregation: The 26th April 1979 eruption, La Soufrière St. Vincent ... 102
Abstract ... 103
Introduction ... 104
26th April 1979 eruption - La Soufrière St. Vincent ... 105
Computational models and best-fitting methodology ... 107
Results ... 113
Discussion ... 123
Conclusions ... 126
Acknowledgements ... 127
Chapter VII – Concluding remarks and outlook ... 128
Concluding remarks ... 128
Outlook ... 129
Appendix ... 131
14
List of Figures
Figure I.1: Scheme of a volcano and its products.
Figure I.2: Classification of the volcanic products.
Figure I.3: Example of field-based TGSDs
Figure I.4: Photographs of aggregates.
Figure I.5: Growth of liquid-bound ash aggregates.
Figure II.1: Numerical description of the mass distribution within an eruptive column.
Figure II.2: Scheme of the FPlume model.
Figure II.3: Effect of the Percentage aggregation model on the TGSD.
Figure II.4: Effect of the Cornell aggregation model on the TGSD.
Figure II.5: Effect of the Costa aggregation model on the TGSD.
Figure III.1: Grain-size spectrum associated with different instruments.
Figure III.2: Example of tephra fallout hazards.
Figure III.3: GSD analysis methods.
Figure III.4: Example of satellite retrieval.
Figure III.5: Example of tremor signal during an eruptive sequence.
Figure III.6: Example of images from video-monitoring system.
Figure III.7: Example of X-band radar retrieval.
Figure III.8: View of the operative window of the VOLORAD 2B radar.
Figure III.9: Example of the optimization procedure to invert the ESPs.
Figure IV.1: Geographical context of the study.
Figure IV.2: Atmospheric profiles.
Figure IV.3: Individual GSDs.
Figure IV.4: Input TGSDs used within the simulations.
Figure IV.5: Comparative graphic for the 10 tephra loadings.
Figure IV.6: Tephra loading maps.
15 Figure IV.8: AOD comparison.
Figure V.1: Tephra sample locations.
Figure V.2: Photograph of the 23rd November 2013 eruption.
Figure V.3: Satellite image (SEVIRI).
Figure V.4: Ash, Ice, and SO2 masses time-series retrieved from SEVIRI.
Figure V.5: Input TGSDs used within the simulations.
Figure V.6: Meteorological fields over the NSEC and Tirana city.
Figure V.7: Simulation schemes.
Figure V.8: Comparative study for the 7 tephra loadings.
Figure V.9: Quantitative analysis of the airborne ash mass.
Figure V.10: Tephra loading maps.
Figure V.11: Illustration of the comparative study between the SEVIRI and FALL3D.
Figure VI.1: Geographical context of the study.
Figure VI.2: TGSDs explored within the simulations.
Figure VI.3: Inversion procedure scheme.
Figure VI.4: Tephra loadings and accumulation loading rate comparative studies.
Figure VI.5: Tephra loading map.
Figure VI.6: Overview of all the tephra loading maps.
Figure VI.7: Overview of all the aggregate loading maps
16
List of Tables
Table II.1: Scaling factors used by FALL3D.
Table IV.1: Locations, tephra loadings and modes of the field samples.
Table IV.2: Input parameter ranges.
Table IV.3: Analytical parameters best-fitting the Field TGSD.
Table IV.4: Optimal ESPs with the statistical parameters for the TGSDs.
Table IV.5: AAM for different factor 𝛾 with the relative statistical parameters. Table IV.6: Main satellite retrievals.
Table V.1: Field measurements compared with the computed tephra loadings
Table V.2: List of the input parameters.
Table V.3: Statistical analysis and TEM estimations for the Integrated TGSD
Table VI.1: Details of the tephra samples (measured and computed).
Table VI.2: Parameters of the analytical curves best-fitting the Field TGSD.
Table VI.3: Grains-size distributions for the explored TGSDs.
Table VI.4: Ranges of the input parameters.
17
List of Notations
Notation Definition Unit
AAM: Airborne Ash Mass kg
AC Ash Cloud
ADS Advection, Diffusion and Sedimentation AERONET: AErosol RObotic NETwork
AOD Aerosol Optical Depth dimensionless
a.s.l. Above sea level km
BPT Buoyant Plume Theory
BTD Brightness Temperature Difference
ECMWF European Center for Medium-range Weather Forecasts ESP Eruption Source Parameters
IC Ice/gas Cloud
INGV – OE Istituto Nazionale di Geofisica e Vulcanologia – Osservatorio Etneo GSD Grain-Size Distribution
L-band L-band Doppler radar – VOLDORAD 2B
MER Mass Eruption Rate kg/m2
MOCAGE MOdèle de Chimie Atmosphérique à Grande Echelle
MSG Meteosat Second Generation
NAME Numerical Atmospheric-dispersion Modelling Environment NASA National Aeronautics and Space Administration
NSEC New South-East Crater
18
PHOTONS PHotométrie pour le Traitement Opérationnel de Normalisation Satellitaire
PM10 Particle Matter below 10 µm µm
PM20 Particle Matter below 20 µm µm
PSD Particle-Size Distribution
RMSE Root Mean Square Error dimensionless
SEVIRI Spinning Enhanced Visible and Infrared Imager
TEM Total Erupted Mass kg
TGSD Total Grain-Size Distribution
TIR Thermal InfraRed
TTest Student T test dimensionless
UTC Coordinated Universal Time hh:mm
VAAC Volcanic Ash Advisory Center
VATD Volcanic Ash Transport and Dispersion
Vis Visible
wt% Percentage in weight %
Chapter I – Introduction
19
Chapter I – Introduction
I.1 Eruption style
In volcanology, eruption is a common phenomenon occurring through various styles and intensities [Walker, 1973; 1980]. While the hot spot volcanoes (e.g. Kilauea in Hawai’i or Piton de la Fournaise in Reunion Island) are characterized by effusive eruptions with low viscous lava flows and gas plumes, the explosive eruptions are signatures of composite volcanoes and high magma viscosities (e.g. Vesuvius or Etna in Italy, La Soufrière Saint Vincent in West Indies). Although the latter can emplace lava flows, they are well-known for producing volcanic plumes by injecting the erupted material (hereinafter tephra) within the atmosphere. The eruption styles are classified from Hawaiian to Plinian following the scheme proposed by Walker [1980] and Pyle [1989]. Figure I.1 summarizes the associated common eruption features from the magma chamber (#11), the projection of volcanic bombs in the very proximal area (#5) to the tephra dispersion with deposition downwind (#4).
Figure I.1: Scheme of an explosive volcano and its products. 1. Ash plume, 2. Lapilli, 3. Lava
fountain, 4. Ash, 5. Bomb, 6. Lava flow, 7.Erupted material layers, 8. Stratum, 9. Sill, 10. Conduit, 11. Magma chamber, 12. Dyke. [Wikimedia Commons]
I.2 Tephra classification
Tephra is produced from the magma fragmentation [Dingwell, 1996] as the results of a rapid ascension towards the surface of the melted mixture leading to a magma decompression in the conduit and the gas over-pressurization [Melnik et al., 2004]. Regarding the grain-size (i.e. diameter – d) of the fragmented magma and lithic, we can distinguish volcanic blocks or bombs
20
(i.e. d ≥ 64 mm or Φ ≤ -6) from lapilli (i.e. 2 ≤ d ≤ 64 mm or -1 ≥ Φ ≥ -6) or ash (i.e. d < 2 mm or Φ > -1). Among the broad term of ash, it is worth distinguishing coarse (i.e. 1 ≤ d < 2 mm or 0 ≥ Φ > -1), fine (i.e. 30 μm ≤ d < 1 mm or 5 ≥ Φ > 0) and very fine ash (i.e. d < 30 μm or Φ > 5) [e.g. Rose and Durant, 2009; Poret et al., 2017; 2018]. The grain-size spectrum is summarized in Figure I.2 through the two different units used in volcanology. In fact, although the metric units are used in some cases, the particle-sizes are typically expressed in Φ-units [Krumbein, 1934] by the following relationship:
𝑑 = 2−Φ
(I.1)
where d is expressed in mm. Although the largest objects follow a ballistic trajectory, such classification aims at better describing how the released material behaves from the source towards distal areas [Rose et al., 2001; 2003]. Indeed, lapilli and ash are conveyed upwards within the plume through the ambient air and the volcanic mixture until a point from which the atmospheric environment (e.g. wind speed, wind direction, wind shear, temperature, and air moisture) takes the lead of the particle transport by dispersing particles downwind [e.g. Costa et al., 2013]. Particle properties (i.e. density – ρ, shape, and d) are controlling the settling velocity leading to a sorted deposition with distance [Durant et al., 2009; Watt et al., 2015]. According to the terminal fall velocity, lapilli and coarse ash, for example for a sub-Plinian eruption [e.g. Bonadonna and Costa, 2013; Costa et al., 2016a], are expected to fall within few minutes to hours near the source (i.e. tens of km), whereas the fine and very fine ash can remain into the atmospheric layers for days to months dispersing at continental or global scales [e.g. Folch, 2012]. In other words, volcanic eruptions can affect very local to global scale depending on the eruption intensity, magma fragmentation, and wind field.
Chapter I – Introduction
21
I.3 Volcanic ash hazard
During an explosive eruption, volcanic hazards are related to tephra injection into the atmosphere. Tephra affects mostly proximal (i.e. within tens of km) and medial (i.e. first hundreds of km) but also distal areas. Deposition and accumulation of tephra can cause roof collapses [e.g. Macedonio and Costa, 2012], be remobilized by water producing lahars [e.g. Lecointre et al. 2004], damage infrastructures (e.g. electrical systems; Wilson et al. [2012]), disrupt communications and transportation (e.g. loss of visibility, roads, railways, runways; Guffanti et al. [2009]), contaminate water-supply systems, affect the environment [Ayris and Delmelle, 2012], damage agriculture [Wilson et al., 2011] and affect respiratory system [Horwell et al., 2007; 2013; 2017; Rose and Durant, 2009; Andronico and Del Carlo, 2016; Tomašek et al., 2016].
In addition, the large atmospheric residence time of the very fine ash and volcanic aerosols affects aviation hazards and climate. Indeed, the release of a large quantity of gas (e.g. H2O,
SO2, H2SO4) and ash (e.g. PM20, PM10) into the atmosphere is now well-known to affect
aviation by damaging fuselages, turbine blades, navigation instruments and by melting in high-bypass jet turbines [Casadevall, 1994; Casadevall et al., 1999; Bonadonna et al., 2012]. Such effects demonstrate the necessity for improving ash plume characterization in terms of ash concentration and plume dispersion to prevent potential ash encounters, as testified by several cases worldwide in the last decades [Prata, 1989a; Grindle and Burcham, 2003; Guffanti et al., 2010] and more recently with the 2010 Eyjafjallajökull eruption [Folch et al., 2012] and the 2011 Cordón-Caulle eruption [e.g. Folch et al., 2014; Bonadonna et al., 2015a; 2015b].
Besides aviation, the injection of volcanic ash or gas (e.g. sulphate aerosols) into the stratosphere has implications on the climate by modifying the radiative forcing for months to years [Robock, 2000; Kravitz et al., 2010], as in the 1991 Pinatubo and 2008 Okmok eruptions.
The volcanic hazards mentioned above motivate the development of numerical tools to forecast the tephra dispersal and deposition in order to mitigate such risks. Tephra dispersal models were designed for such purposes by computing the transport and consequently the deposition [Folch, 2012] making use of input parameters (e.g., meteorological conditions, Eruption Source Parameters – ESP). ESP include the eruption starts and duration, the column height, the Mass Eruption Rate (MER), which can be estimated from column height [e.g. Costa et al., 2016b], and the Total Grain-Size Distribution (TGSD), which includes the very fine ash fraction (i.e. PM20 and PM10). Considering there is no operational single-instrument or method capable to
describe fully the volcanic eruption processes, track the plume and assess the ESP, the estimation of ESP values can only be obtained through an integrated approach. In fact, during a volcanic crisis, alerting air traffic control centres to volcanic ash clouds is done worldwide by nine VAACs (Volcanic Ash Advisory Centers), which use operational satellite retrievals [e.g. Witham et al., 2007] and Volcanic Ash Transport and Dispersion (VATD) models, such as
22
NAME (Numerical Atmospheric-dispersion Modelling Environment; Witham et al. [2007]) or MOCAGE (MOdèle de Chimie Atmosphérique à Grande Echelle; Sič et al. [2015]) for London and Toulouse VAACs, respectively. However, the VAAC models assume a standard grain-size distribution from a pre-existing eruption [Maryon et al., 1999]. Besides NAME and MOCAGE models, FALL3D [Costa et al., 2006; Folch et al., 2009] is also operational at the Buenos Aires and Darwin VAACs. For the first two models, the fine ash percentage likely to reach the distal cloud is arbitrarily taken as 5 wt%.
I.4 Magma fragmentation – Total Grain-Size Distribution
Eruptions are commonly classified by, among other things, Total Erupted Mass (TEM), which is usually retrieved from field measurements only by integrating the deposit coverage [Bonadonna and Costa, 2013]. However, such a method highly depends on the possibility to access and measure tephra deposits (e.g. atmospheric conditions, land/sea, slopes, urbanization or deposits contamination). In addition to the TEM, the field samples provide geolocalized particle Grain-Size Distribution (GSD) permitting the TGSD to be estimated [Bonadonna and Houghton, 2005; Bonadonna et al, 2015c]. In fact, TGSD is commonly reconstructed on the basis of field samples analysis only [Brazier et al., 1982; Bonadonna et al., 2002; Bonadonna and Phillips, 2003; Andronico et al., 2008a; 2008b; Scollo et al., 2013]. As a consequence, the field-derived TGSD (Figure I.3) highly depends on the sampling distance from the source [Andronico et al., 2014a; Costa et al., 2016a], the spatial distribution, and the density of samples [Bonadonna et al., 2015c; Spanu et al., 2016]. Although the TGSD is complex to accurately assess, it is worst for the fine particle classes, which suffer much more uncertainty [Bonadonna et al., 2011; 2015c]. These observations raise questions about the need for an integrated approach to better assess the TGSD by increasing the grain-size spectrum coverage. This aim motivates this study to use the field measurements together with other sensors, such as ground- and satellite-based instruments to better constrain the TGSD, and the other ESPs.
Before initiating any integrated approach to assess the TGSD, the field-derived TGSD can be reconstructed through general distributions (Figure I.3), which better account for the fine ash distribution [Costa et al., 2016a; 2017]. They also show how the presence of two sub-populations within the TGSD is a common feature for most eruptions when they are properly sampled up to distal regions. This study reconstructs the field-based TGSD through the sum of either two lognormal distributions (bi-Gaussian in Φ; hereinafter bi-Gaussian distribution) or two Weibull distributions (bi-Weibull in Φ; hereinafter bi-Weibull distribution) by the following equations:
Chapter I – Introduction 23 ƒ𝑏𝑖−𝐺𝑎𝑢𝑠𝑠𝑖𝑎𝑛(Φ) = 𝑝 1 𝜎1√2π𝑒 −(Φ−µ1)2 2𝜎12 + (1 − 𝑝) 1 𝜎2√2π𝑒 −(Φ−µ2)2 2𝜎22 (I.2)
where Φ denotes particle diameters, p and (1-p) are the fractions of each sub-population, µ1, µ2
and σ1, σ2 represent, respectively, the mean and standard deviation of the two Gaussian
distributions in Φ-units; ƒ𝑏𝑖−𝑊𝑒𝑖𝑏𝑢𝑙𝑙(𝑑) = 𝑞 1 𝑛1 1 𝑛1Γ (1 + 1 𝑛1) 1 𝜆1[ 𝑑 𝜆1] 𝑛1 𝑒−𝑛11( 𝑑𝜆1) 𝑛1 + (1 − 𝑞) 1 𝑛2 1 𝑛2Γ (1 + 1 𝑛2) 1 𝜆2[ 𝑑 𝜆2] 𝑛2 𝑒−𝑛12( 𝑑𝜆2) 𝑛2 (I.3)
where, q and (1-q) are the fraction of each sub-population, λ1, λ2, and n1, n2 represent,
respectively, the scale and shape parameters of the two distributions.
Tephra dispersal models use the input TGSD as discrete size bins. They can use the field-based TGSD which provides the fraction for each bin (or half bin) or the fraction derived from either the bi-Gaussian or bi-Weibull distributions estimated through the equations (I.2) and (I.3), respectively.
24
Figure I.3: Field-based TGSDs for different eruptions with the best-fitting distributions through
Chapter I – Introduction
25
I.5 Volcanic ash aggregation
Regarding the ash dispersal and deposition, the GSD together with the atmospheric conditions control the sedimentation processes and, consequently, the tephra residence time in the atmosphere [Watt et al., 2015]. However, it has been demonstrated that during eruptions, the fine and very fine ash particles typically interact, leading to aggregation through surface liquid layers [Costa et al., 2010; Van Eaton et al., 2012; Mueller et al., 2016; 2017a] or electrostatic forces [Taddeucci et al., 2011; Brown et al., 2012; Del Bello et al., 2015]. The attraction of the electrostatic forces are weaker than the liquid binder and are assumed to be negligible in presence of water [Folch et al., 2016; Mueller et al., 2016].
The term “ash aggregate” may refer to different volcanic products [Brown et al.; 2012, Van Eaton et al., 2012; Mueller et al., 2016]. According to the nomenclature, aggregates can be distinguished by considering the liquid water interaction that bonds the particles together. Under wet conditions, aggregates show compact texture and sub-spherical shape, and are called accretionary pellets (panel a in Figure I.4). Contrarily, dry conditions give particle clusters which are poorly bounded and are characterized by low densities and non-spherical morphologies (panel b in Figure I.4).
During an eruption, ash aggregation depletes the erupted mixture of fine ash resulting in premature fallout of the primary particles [Durant et al., 2009; Mastin et al., 2016]. Among the aggregation processes, particle-particle attraction plays a crucial role in the size and the stability of the aggregates [Mueller et al., 2017a; 2017b]. While electrostatic forces have a long-range attraction, capillary forces have shorter stronger ones, explaining the size and stability differences between the accretionary pellets and the particle clusters (Figure I.4). In addition, aggregate stability is controlled by the ratio between the dispersive and the attractive forces [Costa et al., 2010].
26
The typical dominance of wet over dry conditions in volcanic plumes may justify the assumption to consider wet aggregation only. We consider water from both the atmosphere and the magma. Figure I.5 shows the different schemes for producing aggregates, highlighting the diversity of aggregates, which increase the complexity to compute ash aggregation within tephra dispersal models.
The efficiency of occurrence of ash aggregation depends on the magma type. In fact, a basaltic eruption injects typically < 5 wt% of ash, whereas a silicic produces > 30 wt% [Rose and Durant, 2009]. Moreover, aggregation can also increase the hazards in the proximal-medial areas by modifying the particle properties (e.g. density, shape and diameter). Indeed, aggregating particles an aggregate alters its properties, which results on premature fallout. From a computational point of view, tephra dispersal models neglecting aggregation may result in a significant tephra loading under-estimation in proximal areas accompanied by an over-estimation of the airborne ash mass at large distances from source [Folch et al., 2010; Brown et al., 2012; Van Eaton et al., 2012; Folch et al., 2016]. These observations argue the necessity to, first, better characterize the fine and very fine ash fractions potentially involved in the ash aggregation, and second, be able to capture the aggregation effects in tephra dispersal models.
Figure I.5: Growth of liquid-bound ash aggregates: i) Nucleation of clusters during particle
collisions through liquid drops (top) or liquid condensation. ii) Larger clusters capture smaller particles, generating concentric structure. iii) Cohesive collisions between similar primary clusters produce coalescent aggregates. iv) Slurring is obtained at high water content. [Van Eaton et al., 2012 – Figure 1 modified]
Chapter II – Tephra dispersal modelling
27
Chapter II – Tephra dispersal modelling
Tephra dispersal models are typically designed to simulate the transport and deposition of tephra associated with an explosive volcanic eruption for given meteorological conditions. Such models are widely used for assessing hazards. Model accuracy is of high importance, among others, to forecast tephra dispersal and deposition [Witham et al., 2007; Scollo et al., 2009], constrain the ESPs of past (or ongoing) volcanic events [Costa et al., 2014; Folch et al., 2014; Martí et al., 2016] and to assess volcanic hazards [Scollo et al., 2013; Macedonio et al., 2016]. A review of the tephra dispersal models is available in Folch [2012]. The new generation of tephra dispersal models depends on i) source term, ii) meteorological fields and iii) transport processes parameterizations (e.g. settling velocity).
II.1 The source terms
Plume height, eruption start and duration and TGSD are the main source terms, described by means of plume models for assessing the vertical mass distribution along the main axis [e.g. Folch et al., 2016].
A simple approach consists of assuming a geometric vertical mass distribution, such as the point source or the Suzuki parameterization as defined below [Suzuki, 1983; Pfeiffer et al., 2005]:
𝑆0(𝑧) = 𝑆0′{(1 −
𝑧 𝐻) 𝑒
𝐴(𝐻−1)𝑧 }𝜆
(II.1)
where 𝑆0 is the derivative of mass with z, 𝑆0′ is the vertical integration of the 𝑆0, H stands for
the column height and 𝐴 and 𝜆 are the Suzuki parameters (Figure II.1), which control the height of the maximum concentration and how the mass is distributed around it, respectively [Pfeiffer et al., 2005].
28
Figure II.1: Suzuki parameters. [Pfeiffer et al., 2005 – Figure 1 modified]
Another approach is based on the radial averaged solution of the Buoyant Plume Theory (BPT) equations in terms of mass, momentum and energy [Bursik, 2001; Folch et al., 2016]. Such models can also account for bent-plume effects due to wind, presence of water and the discretization of the vertical mass distribution by considering the particle velocity. Other more sophisticated computational plume models aim at describing more realistically the fluid dynamics and more complete physics of the transport processes of the volcanic mixture, such as ATHAM [Herzog and Graf, 2010], PDAC [Esposti Ongaro et al., 2007] and FPlume models [Folch et al., 2016]. Although such models are physically more realistic, they require numerous parameters and are computationally very expensive.
Among the input parameters required by the tephra dispersal models, the MER can be assessed through the use of a plume model. Although several empirical relationships between the MER and the column height have been proposed [Mastin et al., 2009; Degruyter and Bonadonna, 2012; Woodhouse et al., 2013], which are compared in Costa et al. [2016b], this study uses the FPlume model [Folch et al., 2016] for the source term characterization. FPlume (Figure II.2) is a steady-state 1D cross-section-averaged eruption column model based on the buoyant plume theory [Morton et al., 1956]. It accounts for additional processes affecting substantially the tephra loading and particle distribution along the plume (e.g. wind coupling, air moisture, particle re-entrainment, and ash aggregation under wet conditions). However, in the occurrence of ash aggregation, FPlume does not account for disaggregation phenomena, i.e. decomposing aggregates from particle collisions, implying that aggregates are transported and deposited without being altered [Folch et al., 2016]. The MER for a given wind profile [Folch et al., 2016] is calculated through the following equation:
Chapter II – Tephra dispersal modelling
29 𝑀̂ = π𝑟2𝜌̂𝑢̂ = ∑ 𝑀̂
𝑖 + 𝑀̂𝑤+ 𝑀̂𝑎
(II.2)
where 𝑀̂ is the MER, r refers to the plume radius assumed as axial symmetric, 𝜌̂ is the mixture density (kg/m3), 𝑢̂ is the mixture velocity along the plume axis (m/s). The MER can also be
expressed as the sum of the mass flow rate of particles of class i (𝑀̂𝑖), the mass flow rate of volatiles (𝑀̂𝑤) and the mass flow rate of entrained air (𝑀̂𝑎). FPlume estimates the MER considering two turbulent air entrainment coefficients (i.e. radial – α and cross-flow – β coefficients, respectively). These two parameters aim at describing the air mixing in the plume [Bursik, 2001; Suzuki and Koyaguchi, 2015]. FPlume is run prior the tephra dispersal model providing the source terms. As input, the plume model requires information about the magma water content, initial magma temperature, ejection velocity and a meteorological profile.
Figure II.2: Scheme of the FPlume model. [Folch et al., 2016 – Figure 1]
II.2 Meteorological fields
Tephra dispersal models need, as input, meteorological fields (e.g. wind, temperature, air moisture, boundary layer heights) over the studied domain. Depending on the application, the meteorological database can be at local, meso or global scale and can be obtained from numerical weather prediction or re-analysis models, for forecast or reconstruction purposes, respectively. Two strategies are typically used to model tephra dispersal as explained in Folch [2012]: i) the on-line and ii) the off-line strategy. Although the on-line strategy benefits from the best modelling accuracy (based on the synchronization of the tephra dispersal model with
30
the numerical weather prediction model) [Martí et al., 2016], the off-line strategy is widely used, being a good compromise between the computational time and the model resolution. The off-line strategy consists of reading the meteorological variables over the domain through fixed points and regular time-intervals. It is worth noting that such a strategy usually implies discrepancy between the spatial resolution of the tephra dispersal model and the meteorological database.
II.3 Formulation of tephra dispersal models
The first models designed for assessing the sedimentation from volcanic plumes were by Suzuki [1983], Carey and Sparks [1986], Wilson and Walker [1987] and Armienti et al. [1988]. Then the models were improved to better simulate deposits by implementing processes such as the convection and gravitational effects or the variability of the terminal fall velocity [Bursik et al., 1992; Sparks et al., 1992; Bonadonna and Phillips, 2003]. Eulerian, Lagrangian and Hybrid models have been introduced.
II.3.1 Eulerian approach
Eulerian models are based on the solution of the Advection-Diffusion-Sedimentation (ADS) equation, dividing the Earth’s atmosphere into a fixed 3D grid and solving for flux between grid cells. The equation consists on the principle of the particle mass conservation moving inside a volume of fluid (e.g. atmospheric fluid: air). Such approach solves for the following equation: 𝜕𝐶 𝜕𝑡 = − 𝜕(𝑢𝑥𝐶) 𝜕𝑥 − 𝜕(𝑢𝑦𝐶) 𝜕𝑦 − 𝜕(𝑢𝑧𝐶) 𝜕𝑧 + 𝜕 𝜕𝑥(𝐾ℎ 𝜕𝐶 𝜕𝑥) + 𝜕 𝜕𝑦(𝐾ℎ 𝜕𝐶 𝜕𝑦) + 𝜕 𝜕𝑧(𝐾𝑣 𝜕𝐶 𝜕𝑧) + 𝜕(𝑢𝑠𝐶) 𝜕𝑧 + 𝑆0+ 𝑆𝑘 (II.3)
where C refers to the particle mass concentration, t is the time, u = (𝑢𝑥, 𝑢𝑦, 𝑢𝑧) is the wind
velocity, K = diag(𝐾ℎ, 𝐾ℎ, 𝐾𝑣) with 𝐾ℎ and 𝐾𝑣 are the horizontal and vertical turbulent diffusion coefficients, respectively, 𝑢𝑠 is the sedimentation term, 𝑆0 is the source term (i.e. production of
particles) and 𝑆𝑘 is the sink term (i.e. loss of particles).
II.3.2 Analytical model
Analytical models are based on assumptions that simplify Equation II.3: i) the vertical wind (𝑢𝑧) and diffusion (𝐾𝑣) coefficients are equal to 0, ii) the wind is homogeneous horizontally for the two components (i.e. 𝑢𝑥 = 𝑢𝑥(𝑧) and 𝑢𝑦 = 𝑢𝑦(𝑧)), iii) the horizontal turbulent diffusion is
Chapter II – Tephra dispersal modelling
31
particles are released vertically at a source point (i.e. 𝑆0 = 𝛿0). It follows that Equation II.3
becomes: 𝜕𝐶 𝜕𝑡 = −𝑢𝑥 𝜕𝐶 𝜕𝑥− 𝑢𝑦 𝜕𝐶 𝜕𝑦+ 𝑢𝑠 𝜕𝐶 𝜕𝑧+ 𝐾 ( 𝜕2𝐶 𝜕𝑥2 + 𝜕2𝐶 𝜕𝑦2) + 𝛿0 (II.4)
having an analytical solution for each particle concentration as [Macedonio et al., 2005]:
𝐶 = 1 4𝜋𝐾𝑡𝑒 −(𝑥−𝑥0−𝑢𝑥𝑡)2+(𝑦−𝑦0−𝑢𝑦𝑡) 2 4𝐾𝑡 𝛿(𝑧 − 𝑧0+ 𝑢𝑠𝑡) (II.5)
Examples of analytical models based on the Gaussian solution for the deposit are ASHFALL [Hurst and Turner, 1999; Hurst and Smith, 2004], TEPHRA [Connor et al., 2001; Bonadonna et al., 2005] and HAZMAP [Macedonio et al., 2005; Pfeiffer et al., 2005]. Limitations of such models are discussed in Folch [2012].
II.3.3 Numerical model
Numerical models are introduced due to the limitations of the Gaussian models. Indeed, the numerical solution of Equation II.3 allows the computation of both the tephra loading and the airborne ash mass with time. Although such models can be applied for any context, their use increases substantially the bulk computational cost (details in Folch [2012]). Among the models, there is FALL3D [Costa et al., 2006; Folch et al., 2009], and ASH3D [Mastin et al., 2013; Schwaiger et al., 2012].
FALL3D is a 3D time-dependent Eulerian model solving for a set of equations describing the particle behaviour within the atmosphere. The tephra transport is governed by the main atmospheric fields (e.g. wind advection, turbulent diffusion and gravitational settling). The eruption can alter significantly local atmospheric conditions, increasing the complexity for computing the tephra behaviour within a highly perturbed environment. Consequently of ignoring numerically these effects, the model accuracy decreases at very proximal distance from the source (i.e. few kilometres). Moreover, the proximal area is mostly affected by large clast objects (i.e. volcanic bombs) deposited following a ballistic trajectory (Figure I.1).
FALL3D can be coupled with the integral plume model (FPlume; Section II.1; Folch et al. [2016]) to describe the source term. The particle transport and settlement are governed by the following equation, which does not account for any particle-particle interaction (e.g. ash
32
aggregation or collision). The continuity equation is given as the Eulerian form in a generalized coordinate system (X, Y, Z) as described in Byun and Schere [2006] and Costa et al. [2006]:
𝜕𝐶 𝜕𝑡 + 𝑉𝑋 𝜕𝐶 𝜕𝑋+ 𝑉𝑌 𝜕𝐶 𝜕𝑌+ (𝑉𝑍− 𝑉𝑠𝑗) 𝜕𝐶 𝜕𝑍= −𝐶∇ ∙ 𝑉 + 𝐶 𝜕𝑉𝑠𝑗 𝜕𝑍 + 𝜕 𝜕𝑋(𝜌∗𝐾𝑋 𝜕 𝐶 𝜌⁄ ∗ 𝜕𝑋 ) + 𝜕 𝜕𝑌(𝜌∗𝐾𝑌 𝜕 𝐶 𝜌⁄ ∗ 𝜕𝑌 ) + 𝜕 𝜕𝑍(𝜌∗𝐾𝑍 𝜕 𝐶 𝜌⁄ ∗ 𝜕𝑍 ) + 𝑆∗ (II.6)
where C is the transformed concentration (i.e. scaled average concentration) and V = (𝑉𝑋, 𝑉𝑌,
𝑉𝑍) is the transformed wind speed (i.e. scaled wind speed). The term 𝜌∗ is the transformed atmospheric density (i.e. scaled atmospheric density), and 𝑆∗ refers to the transformed source
term (i.e. in the used coordinate system).
This equation accounts for mass conservation during atmospheric transport of tephra in an explosive eruption and affects the released particles, which are regrouped in the ADS system. FALL3D solves the equation for each particle class i by considering for the curvilinearity of the Earth and applying a correction factor on the terrain-following coordinate system through the Jacobian of the transformation. The scaling procedure is done through the map scale factor (m) or the Jacobian (𝐽) accordingly to the operation [Byun and Schere, 2006] and summarized in Table II.1. Then, each particle class i is assigned a triplet (dp,𝜌∗,Fp), which contains the
diameter, density, and shape factor, respectively.
Table II.1: Scaling factors. The triplet (x,y,z) are the Cartesian coordinates. [FALL3D Manual –
Table 1 in Appendix A modified]
For the sake of simplicity, the diameter dp is assumed as d, which is the diameter of the
corresponding sphere for an equivalent volume. The shape parameter (Fp) is defined as the
particle sphericity (ψ) given by the ratio of the sphere surface with a diameter d to the particle
Parameter Scaling
Coordinates X = mx; Y = my; Z = z-h(x,y)
Horizontal velocities 𝑽𝑿= 𝒎𝒗𝒙; 𝑽𝒀= 𝒎𝒗𝒚 Vertical velocity (𝑽𝒁− 𝑽𝑺𝒋) = 𝑱−𝟏[(𝒗𝒛− 𝒗𝒔𝒋) − 𝒎 (𝒗𝒙𝝏𝒉𝝏𝒙+ 𝒗𝒚𝝏𝒉𝝏𝒚)] Concentration 𝑪 = 𝒄𝑱 𝒎𝟐 Density 𝝆∗= 𝝆𝑱 𝒎𝟐 Source term 𝑺∗= 𝑺𝑱 𝒎𝟐
Chapter II – Tephra dispersal modelling
33
surface. It follows that the transport and sedimentation of each particle class i will be considered under the triplet (d,𝜌∗,ψ), which is highly dependent on the settling velocity. Details on
equations, models and parameterizations within the FALL3D code are available in Folch et al. [2009].
Particle sedimentation is controlled by the dry deposition terminal fall velocity for most of the tephra classes. In Equation II.3, 𝑢𝑠 is defined as:
𝑢𝑠 = 𝑢𝑡+
1
𝑟𝑎 + 𝑟𝑠 + 𝑟𝑎𝑟𝑠𝑢𝑡
(II.7)
where 𝑟𝑎 and 𝑟𝑠 are the aerodynamic resistance coefficients [Feng, 2008] and 𝑢𝑡 defines the drag force by the following formulation for a Newtonian fluid [Chhabra et al., 1999]:
𝑢𝑡 = √4 3
(𝜌𝑝− 𝜌𝑎)
𝐶𝐷𝜌𝑎 𝑔𝑑
(II.8)
where g is the gravitational acceleration, d is the particle diameter, 𝜌𝑝 and 𝜌𝑎 are the particle and fluid (i.e. air) densities, respectively, and 𝐶𝐷 is a drag coefficient. 𝑢𝑠, and 𝑢𝑡 differ only for micron-sized particles.
In Equation II.3, the sink term for the wet deposition (𝑆𝑘) is calculated through the
parameterization:
𝑆𝑘 = −𝜆𝐶 = −𝑎𝑃𝑏𝐶
(II.9)
with 𝜆 referring to the scavenging coefficient (in s-1), P is the precipitation rate defined by the
meteorological database and a and b are precipitation constants [Folch, 2012].
II.3.4 Lagrangian approach
Lagrangian models aim at computing the path followed by a volume of particles within a fluid (e.g. atmospheric fluid: air). Such models are mostly used by VAACs to forecast, track or compute backward the particle trajectories. To do so, the following equation serves to calculate the movement between two time-steps:
34
𝑟(𝑡2) = 𝑟(𝑡1) + ∑[𝑢 + 𝑢′+ 𝑢𝑠]𝑑𝑡 𝑡2
𝑡1
(II.10)
where r refers to the position vector and 𝑢′ is the turbulent fluctuations (details in Folch [2012]).
Regarding the Equation II.10, the integrated terms refer to the ADS presented in the Eulerian form (Equation II.3). Among the Lagrangian models, are HYSPLIT [Draxler and Hess, 1998], JMA [Iwasaki et al., 1998], PUFF [Searcy et al., 1998; Webley et al., 2012], FLEXPART [Stohl et al., 1998; 2005], MLDP0 [D’Amours and Malo, 2004], NAME [Jones et al., 2007; Witham et al., 2007] and MOCAGE-accident [Martet et al., 2009].
II.3.5 Hybrid approach
A hybrid Lagrangian-Eulerian formulation simulates the trajectory of the centre of mass of the released tephra. Then, from the trajectory, the model assumes a particle diffusion following a Gaussian form to assess the particle concentration at regular intervals. An example of models of this category is VOLCALPUFF [Barsotti et al., 2008]. This model is capable to compute in 3 dimensions the transport and sedimentation of the volcanic ash from the source to distal areas. The model couples an Eulerian form describing the plume with a Lagrangian form for the ash dispersal through a series of diffusing packets (named puffs).
II.3.6 Aerosol chemistry model
Several aerosol chemistry models are based the Eulerian approach and were applied to volcanological problems especially after the 2010 Eyjafjallajökull eruptions to track airborne ash and sulphur or sulphate aerosols. Few models are operative, such as REMOTE [Langmann, 2000], COSMO-MUSCAT [Steppeler et al., 2003; Wolke et al., 2004], POLAIR3D [Boutahar et al., 2004] and CMAQ [e.g. Matthias et al., 2012].
II.4 Ash aggregation modelling
For simplicity, most models assume aggregation to occur within the eruptive plume, and neglect any disaggregation process [Mueller et al., 2017b]. Recent studies [Durant et al., 2009; Taddeucci et al., 2011; Van Eaton et al., 2013; Costa et al., 2016a; 2017] have shown how aggregation is a common eruptive feature which contributes significantly to tephra fallout. Considering that this study uses the FALL3D model, which can account for or neglecting aggregation, we report here the parameterizations available within the code to account for ash aggregation. The models assume an effective aggregate class characterized by the diameter da
Chapter II – Tephra dispersal modelling
35
II.4.1 Percentage model
The Percentage model (hereinafter Percentage) is described in Sulpizio et al. [2012]. The class is enriched by scavenging a constant percentage of the primary particles from the involved classes (i.e. Φ ≤ Φa; yellow box in Figure II.3). The effect of using the Percentage model on
the TGSD is illustrated in Figure II.3. In fact, each class of the original TGSD are depleted in favour of the effective aggregate class created by FALL3D. In Figure II.3, we present the example of a constant percentage with respect to the fines set at 50 wt%.
Figure II.3: Sketch of a TGSD modified by the Percentage aggregation model.
II.4.2 Cornell model
The Cornell model (hereinafter Cornell) was introduced by Cornell et al. [1983]. It was then modified and implemented in FALL3D [Costa et al., 2012]. The aggregate fraction is assigned with 50 wt% of particle with diameter 63-44 μm, 75 wt% of 44-31 μm and 90 wt% of ash smaller than 31 μm. The Figure II.4 shows how the Cornell model procedure enriches the aggregate class by removing the particles from the corresponding classes of the original TGSD.
36
Figure II.4: Sketch of a TGSD modified by the Cornell aggregation model.
II.4.3 Costa model
The Costa model (hereinafter Costa) accounts for aggregation [Costa et al., 2010; Folch et al., 2010] by considering water in either liquid or solid phases from atmospheric or magmatic origin [Folch et al., 2016]. The Costa model accounts for the Brownian motion, ambient fluid shear and the differential sedimentation. The model requires two parameters which have to be calibrated, i.e. the fractal exponent (Df) and the aggregate settling velocity correction factor (ψe)
related to the aggregate porosity [Costa et al., 2010; Folch et al., 2010; 2016]. The model is based on a simplified solution of the Smoluchowski equation [Smoluchowski, 1917] and represents a good compromise between the full aggregation processes described in the Smoluchowski equation [Smoluchowski, 1917] and the need to reduce the bulk computational cost. Figure II.5 shows an example of how the Costa model allocates the erupted ash within the effective aggregate class (Φa, ρa) from the original TGSD by estimating the involved fraction
Chapter II – Tephra dispersal modelling
37
Figure II.5: Sketch of a TGSD modified by the Costa aggregation model. The indicative red
38
Chapter III – Observational data and inversion procedure
To better constrain the ESP used to run the simulations, all the available observations are used in terms of tephra release and fallout, plume evolution and ash dispersal. The following sub-sections describe the data used within different applications throughout the manuscript. This study integrates data from various instruments to better cover the grain-size spectrum, similar to recent studies [Bonadonna et al., 2011; Corradini et al., 2016]. Among the ESPs, the TEM is typically estimated by integrating the mapped tephra deposit [Andronico et al., 2014a; Bonadonna and Costa, 2012; 2013]. However, the estimation would benefit from the integration of different methods to cover entirely the grain-size spectrum from the blocks to the very fine ash particles (Figure III.1). Moreover, these methods can be used in parallel to better describe the eruption features (e.g. tephra exit velocities, column height, eruption duration, TGSD). From a computational point of view, the most critical parameter describing the initial conditions at the source is the particle size distribution generate by magma fragmentation (i.e. the TGSD). Considering the instrument complementarity in terms of grain-size coverage in Figure III.1, such parameter can be achieved by integrating several of the following data.
Figure III.1: Grain-size spectrum associated with the different methods.
III.1 Field data
Considering that no sophisticated equipment is required to carry out field measurements, they are the first information collected, weather permitting, from the slopes of the volcano towards the main plume axis. Although sampling is highly hazardous in terms of tephra fallout (panels a and b in Figure III.2) and deposited layers (e.g. slippery roads; panel c in Figure III.2), field
Chapter III – Observational data and inversion procedure
39
campaigns to delineate the areas affected by the tephra fallout and to measure the load per unit area, which is used afterwards to estimate the TEM [Bonadonna and Costa, 2012].
Figure III.2: Tephra fallout deposit of the 23rd November 2013 Etna paroxysm with an example of impact on infrastructure by showing the tephra layer on the main road around Etna. [Andronico et al., 2015 – Figure 2 modified]
After collection, samples are oven-dried prior to analysis in the laboratory. Then, the GSD is measured for each sample. The classical methods used are mechanical sieving (panel a in Figure III.3) or optical measurement (panel b in Figure III.3). Both instruments provide GSD from -5 to 5 Φ (see Figure III.1) and show a good agreement allowing their use alternatively if necessary [Lo Castro and Andronico, 2008]. Sieves can be used only for grain sizes down to 64 µm and the limiting dimension for particles, which determines whether they fall through the mesh in a sieve, is their intermediate diameter. Sieve analysis gives mass fraction of each size bin, explaining the resulting distribution is inherently binned. Optical measurement uses the principle of dynamic image analysis of projected particle shadows recorded by a dual-camera system, giving a binned distribution.
Regarding distal areas from the source, the samples may be composed of a low quantity of very fine tephra indicating the second method more suitable giving a statistically accurate GSD measurement. Moreover, the scarcity of such sample requires to use a method that returns it intact afterwards.
40
Figure III.3: GSD analysis performed by: a) Sieving method. b) CAMSIZER instrument (Retsch
technology).
III.2 Satellite-based data
Geostationary space-based instruments (e.g. Meteosat Second Generation – MSG) are now widely used for monitoring volcanic activity by providing worldwide coverage at a time-resolution that allows most eruptive processes to be recorded [Prata and Kerkmann, 2007; Bonadonna et al., 2011; Folch et al., 2012; 2014; Gouhier et al., 2012; Boichu et al., 2016; Corradini et al., 2016]. Indeed such sensors are able to detect and track volcanic clouds over hundreds to thousands of kilometres from the source. Satellite-based thermal infrared (TIR) sensors are very useful for characterizing volcanic ash [Guéhenneux et al., 2015; Gouhier et al., 2016]. In the TIR region (i.e. 7-14 µm), we can distinguish silicate particles (e.g. volcanic ash) from other aerosols (e.g. ice crystals, SO2, or H2SO4) using a two-channel difference model
based on the absorption feature between the 11- and 12-µm wavelengths [Prata, 1989b; Wen and Rose, 1994; Watson et al., 2004]. It was shown that the difference between the at-sensor “Planck” brightness temperature (referred to as BTD) observed in these two channels is negative (-∆T) for ash and positive (+∆T) for ice. Wen and Rose [1994], built on early work [Prata, 1989b], developed a forward retrieval model that quantifies the effective radius (re) and
optical depth (𝜏c) from the extinction efficiency factor (Qext) calculated using the Mie theory.
This allows a theoretical look-up-table to be produced for sets of variations of both re and 𝜏c as
a function of the brightness temperature. From inverse procedure, re and 𝜏c (and hence the mass
of the volcanic ash cloud) can be retrieved for any given brightness temperature pair (details in Prata and Grant [2001]; Watson et al. [2004]). However, satellite retrievals are affected by several factors such as the surface characteristics (i.e. temperature and emissivity), plume
Chapter III – Observational data and inversion procedure
41
geometry (i.e. altitude and thickness), ash optical properties and water vapour. These factors produce uncertainty of ~40% and ~30% respectively associated with the total mass retrieval and effective radius [Corradini et al., 2008]. Another source of uncertainty is related to the presence of large particles (typically for re > 6 µm), possibly within the fine ash clouds, which
cannot be retrieved using the Mie theory as Qext does not vary significantly for re > λ/2
[Guéhenneux et al., 2015; Stevenson et al., 2015]. Overall, the effects related to both misdetection issues (i.e. BTD) and the presence of coarse ash particles in the cloud lead to a mass under-estimation of 50% [Stevenson et al., 2015].
The use of data from the SEVIRI (Spinning Enhanced Visible and Infrared Imager) sensor on-board MSG provides 1 image every 15 minutes at a spatial resolution of ~3×3 km at nadir. Satellite data are available online, for instance, from HOTVOLC [HOTVOLC Website], which is a web-based satellite-data-driven monitoring system developed at the OPGC (Observatoire de Physique du Globe de Clermont-Ferrand, France). This system is designed for real-time monitoring of active volcanoes [Gouhier et al., 2016]. Weather conditions permitting, the images (e.g. Figure III.4) may show the eruption features from proximal areas soon after the onset, or a far-travelled dilute cloud.
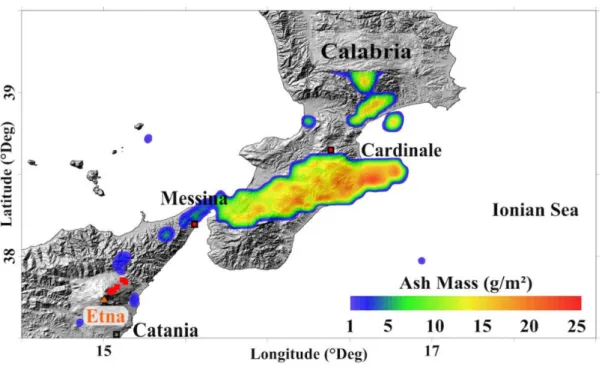
Figure III.4: Example of satellite retrieval showing the ash mass at 19:45 released during the 23rd February 2013 Etna paroxysm. [Poret et al., 2017 – Under Review]
42
III.3 Ground-based data
Among the ground-based sensors capable of observing an eruption, the remote sensing systems include direct observations (e.g. seismic tremor and video monitoring), radar and sun-photometer.
III.3.1 Seismic tremor signal
Seismic tremor shows the pressure fluctuation induced by the injection of magma into the rock. When a volcanic activity starts, the signal intensity may increase in correlation with the seismic activity. The use of the volcanic tremor aims at accurately timing the activity start and end together with the different main eruption phases as observable in the Figure III.5. Some eruptive features can be characterized through the tremor signal such as the initialization of Strombolian activity (white ellipse), the paroxysm episodes (red ellipses) which have very short duration compared with the emplacement of a lava flow (red slot) that may range from hours to days.
Figure III.5: Tremor signal of the eruptive sequence of the 3rd December 2015 on Etna. [INGV – OE Website]
III.3.2 Visible and Infrared images
Video-monitoring using both visible and/or infrared, together with tremor signal help to accurately estimate the eruption start and duration. As soon as the eruption begins, the images allow direct observations of the eruptive column assessing in real time the column height. Figure III.6 shows the time-series of the 23rd February 2013 Etna eruptive activity. Thermal images (top panel; 1T-5T) indicate the plume height and the spreading direction, whereas the visible images (bottom panel; 1V-5V) complete the observations. It is worth noting that the sensors are complementary during nocturnal events. Nonetheless, the detection limit depends on the image window (here maximum 9.5 km above sea level – a.s.l.), which explains the importance of combining the video-monitoring with other sensors such as the radar systems or satellite-based instruments to achieve a robust estimation of the column height.
Chapter III – Observational data and inversion procedure
43
Figure III.6: The top panel shows thermal images of the 23rd February 2013 eruption of Etna. The bottom panel refers to the corresponding images in the visible spectrum. [Poret et al., 2015]
III.3.3 Weather radar
Although weather radar (X-band and C-band) is designed for weather forecast purposes, it is now widely used to monitor the volcanic activity. The X-band systems operates at the wavelength of ~3 cm providing volumetric scans every 10 minutes. As described in Vulpiani et al. [2016], the X-band radar retrieves i) reflectivity, ii) correlation coefficient in the returned signal, iii) radial velocity iv) differential reflectivity (in decibels), v) specific differential phase shift and vi) spectral width [Montopoli, 2016]. Processing of these data leads to estimates of ash concentration, exit velocity, column height, volcanic cloud top height and Particle-Size Distribution (PSD). To convert PSD into TGSD (in Φ-unit), we used PSD given as ash number density distribution [e.g. Corradini et al., 2016]. Then, the average for the whole event takes in input each PSD estimated from each single radar resolution volume delineated by horizontal angle, vertical angle, and range distance at each available time step for the airborne ash mass seen by the radar. PSD is converted into number of particles per unit of volume with the particle-size bins. By means of the volume and density associated with the particle-size bins, the mass density distribution is calculated. Retrieved effective radius ranges from -1 to 5 Φ (see Figure III.1; Corradini et al. [2016]). The difference of the radar measurements in terms of grain-size with the field data suggests their integration to enlarge the observations. Figure III.7 illustrates the radar retrievals by showing the top height of the volcanic cloud and the spreading at 10:10 in the morning of the 23rd November 2013, when Etna erupted.
44
Figure III.7: Volcanic cloud top retrieved with the X-band radar for the 23rd November 2013 paroxysm of Etna (orange triangle). The red line refers to the radar detection limit installed at Catania airport (red point).
III.3.4 L-band Doppler radar – VOLDORAD 2B
The pulsed L-band Doppler radar (hereinafter VOLDORAD 2B) is a near-source instrument suitable to observe the volcanic activity in the very proximal area (hundreds of meters from the vent; Figure III.8). The radar is used worldwide to monitor volcanoes such as Stromboli and Etna (Italy), Yasur (Vanuatu), Arenal (Costa Rica) or Popocatépetl (Mexico). VOLDORAD 2B aims at observing in real-time the eruption by characterizing the main source parameters such as the eruption start and duration, the eruptive phases, the exit velocities of the erupted material, the MER and thereby the TEM [Donnadieu et al., 2015; 2016; Freret-Lorgeril et al., 2016]. Indeed, the radar operates at a wavelength of 23.5 cm allowing lapilli to blocksized (i.e. Φ ≤ -1; see Figure III.1) to be detected through a short window (panel b in Figure III.8). The detection is highly dependent on the erupted material as well as the concentration. It follows that the lower limit may vary highlighting the necessity of working in a multi-system approach. Inferred radar parameters (e.g. backscattered echo power) are proportional to the quantity of tephra detected through the radar beam. In addition, the along-beam radial velocities permit lava fountains from being observed at high time resolution (i.e. 0.2 s), inferring near-source detection of the ejection velocities by means of the following equation [Freret-Lorgeril et al., 2016; Donnadieu et al., 2017]:
Chapter III – Observational data and inversion procedure 45 𝑉𝑒 = 𝑣𝑟+ sin 𝜃≈ 3.89𝑣𝑟+ (III.1)
where 𝑉𝑒 is the ejection velocities (in m/s), 𝑣𝑟+ is the radial velocity (in m/s) and 𝜃 is the elevation angle of the radar beam (here 𝜃 = 14.9°). Such approach is relevant for integrating the time-dependent ejection velocities with the corresponding observed eruptive column heights. In particular, VOLDORAD 2B data are used for better constraining the eruption phase characterization.
Figure III.8: View of the configuration of the VOLDORAD 2B system (panel a) installed on Etna
(Montagnola station; panel b). c) Shows the shelter of the radar. [Donnadieu et al., 2016 – Figure 2 modified]
III.3.5 AERONET data
The AErosol RObotic NETwork (AERONET) is a ground-based remote sensing network [Holben et al., 1998] supervised by NASA and the “PHOtométrie pour le Traitement Opérationnel de Normalisation Satellitaire” (PHOTONS). AERONET aims at retrieving in real-time a global database from solar spectral irradiance to assess aerosol optical properties, e.g. volume size distribution, particle sphericity (estimated here as the ratio between the backscattered and the depolarization signals), and Aerosol Optical Depth (AOD) to validate satellite observations [Dubovik et al., 2006]. The columnar AOD is measured from solar radiance [Holben et al., 2006] at diverse spectral channels (e.g. 500 nm) through three data quality levels [Dubovik et al., 2006]. In addition, direct-sun-derived AOD processing [Watson