Diffusion-weighted MRI in the evaluation of renal lesions:
preliminary results
1
M COVA,
MD
,
2E SQUILLACI,
MD,
1F STACUL,
MD,
2G MANENTI,
MD,
1S GAVA,
MD,
2G SIMONETTI,
MD and1
R POZZI-MUCELLI,
MD1Department of Radiology, University of Trieste, Ospedale di Cattinara, Strada di Fiume 447, 34149 Trieste and 2Department of Diagnostic and Interventional Radiology, University of Roma ‘‘Tor Vergata’’, Viale Oxford 81, 00133 Roma, Italy
Abstract. The purpose of this study was to evaluate the capability and the reliability of diffusion-weighted MRI in the evaluation of normal kidney and different renal lesions. 39 patients (10 normal volunteers and 29 patients with known renal lesions) underwent MRI of the kidneys by using a 1.5 T superconducting magnet. Axial fat suppressed turbo spin echo (TSE) T2 and coronal fast field echo (FFE) T1 or TSE T1 weighted images were
acquired for each patient. Diffusion-weighted (DW) images were obtained in the axial plane during breath-hold (17 s) with a spin-echo echo planar imaging (SE EPI) single shot sequence (repetition time (TR)52883 ms, echo time (TE)561 ms, flip angle590
˚
), with b value of 500 s mm22. 16 slices were produced with slice thickness of 7 mm and interslice gap of 1 mm. An apparent diffusion coefficient (ADC) map was obtained at each slice position. The ADC was measured in an approximately 1 cm region of interest (ROI) within the normal renal parenchyma, the detected renal lesions and the collecting system if dilated. ADC values in normal renal parenchyma ranged from 1.7261023mm2s21 to 2.6561023mm2s21, while ADC values in simple cysts (n513) were higher (2.8761023mm2s21 to 4.0061023mm2s21). In hydronephrotic kidneys (n56) the ADC values of renal pelvis ranged from 3.3961023mm2s21to 4.0061023mm2s21. In cases of pyonephrosis (n53) ADC values of the renal pelvis were found to be lower than those of renal pelvis of hydronephrotic kidneys (0.7761023mm2s21 to 1.0761023mm2s21). Solid benign and malignant renal tumours (n57) showed ADC values ranging between 1.2861023mm2s21 and 1.8361023mm2s21. In conclusion diffusion-weighted MR imaging of the kidney seems to be a reliable way to differentiate normal renal parenchyma and different renal diseases. Clinical experience with this method is still preliminary and further studies are required.MR diffusion-weighted imaging (DWI) is widely used in neuroimaging, particularly for the evaluation of acute cerebral stroke, intracranial tumours and demyelinating diseases [1–6]. Application of MR DWI outside the central nervous system has been limited by its inherent extreme sensitivity to motion. In the abdomen the use of DWI has been hampered by the presence of spontaneous motion such as respiration, peristalsis and blood flow, which are orders of magnitude greater than diffusional motion and can easily obscure the effect of diffusion. However, recent advances in ultrafast MRI methodologies make it possible to overcome many motion-related problems and to obtain reliable DW images of the abdominal organs [7].
DWI holds great potential for abdominal imaging, in particular for focal lesion detection and characterization, and the evaluation of diffuse parenchymal diseases for which current techniques are often inadequate. Recent studies have already shown the potential value of this method in the evaluation of various renal diseases, such as renal infection, renal ischaemia, pyonephrosis and diffuse renal disease [8–12].
The purpose of our study was to evaluate the capability and reliability of MR DWI in the evaluation of normal kidney and of different renal lesions.
Materials and methods
10 subjects (6 men, 4 women; age range 30–72 years; mean age 50 years) with normal kidneys and 29 patients (16 men, 13 women; age range 45–85 years; mean age 62 years) with known renal lesions previously diagnosed by ultrasound and/or CT, as simple cysts 13 cases; hydronephrosis 6 cases; pyonephrosis 3 cases; solid tumours 7 cases (3 histologically proven renal cell carcinomas, 1 histologically proven oncocytoma, 3 angio-myolipomas) underwent MRI of the kidneys. MRI was performed using a 1.5 T superconducting magnet (Philips Gyroscan Intera, Best, The Netherlands) with maximum gradient strength of 30 mT m21 and a slew rate of 150 mT m21ms21, with a body phased-array coil. Axial fat-suppressed turbo spin echo (TSE) T2 weighted images
and coronal fast field echo (FFE) T1or TSE T1 weighted
images were acquired in each patient. 16 DW images with slice thickness of 7 mm and interslice gap of 1 mm were obtained in the axial plane during breath-hold (17 s) by using a single-shot spin-echo echo planar imaging (SE EPI) sequence (repetition time (TR)52883 ms, echo time (TE)561 ms, flip angle590
˚
, field of view (FOV)5 320 mm, matrix51286256), with b values of 0 and of 500 s mm22. The single-shot SE EPI sequence was performed using a parallel imaging technique acquisition (SENSE), which allows a faster acquisition for breath-hold technique. An apparent diffusion coefficient (ADC)Received 4 August 2003 and in final form 25 March 2004, accepted 23 April 2004.
central portion of the kidney, at three different locations (anterior labrum, posterior labrum, intermediate site), for a total of 60 measurements. In the focal renal lesions below 3 cm (8 simple cysts, 7 tumours) and in the dilated collection system there was one ROI, while in the focal renal lesions above 3 cm (5 simple cysts) there were three ROIs. In the latter cases the resulting mean ADC value was reported.
To compare ADC values among normal renal parench-yma, simple cysts and hydronephrosis, pyonephrosis, and solid renal tumours, an unpaired t-test was used. A value of p,0.05 was considered statistically significant.
Results
DW images were of diagnostic quality in all cases, and no cases were excluded from the study.
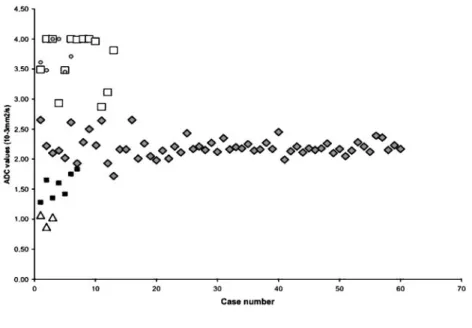
The overall mean ADC value in normal renal parench-yma (60 measurements) was 2.19¡0.1761023mm2s21, with individual measurements ranging from 1.72¡0.156 1023mm2 s21 to 2.65¡0.3461023 mm2s21 (Figures 1 and 2).
The overall mean ADC value in simple cysts (n513) was 3.65¡0.0961023mm2s21 (range from 2.87¡0.066 1023mm2 s21 to 4.0061023mm2s21; 4.00 mm2s21 being the upper limit of the ADC value computation scale). This was significantly higher than the mean ADC value of normal renal parenchyma (p,0.001) (Figures 1 and 3). On DW images obtained with a b-value equal to 500 s mm22, the simple cysts showed lower signal
phrotic kidneys was hypointense while the renal pelvis of the pyonephrotic kidneys was markedly hyperintense (Figure 4).
Solid benign and malignant tumours showed an overall mean ADC value of 1.55¡0.2061023mm2s21, ranging between 1.28¡0.1161023mm2s21 and 1.83¡0.146
1023mm2s21, significantly lower than the normal renal parenchyma (p,0.001) (Figures 1 and 5). On DW images obtained with a b-value equal to 500 s mm22 the solid renal tumours showed higher signal compared with the signal intensity shown on DW images obtained with b-value equal to 0 (Figure 5).
There was no overlap of ADC values between the normal renal parenchyma, renal pelvis of pyonephrotic kidneys and solid renal tumours, except for the ADC values of two renal cell carcinomas that overlapped with the ADC values of normal renal parenchyma (Figure 1). Considerable overlap of ADC values was found for simple renal cysts and renal pelvis of hydronephrotic kidneys, which showed significantly higher ADC values compared with the other patient groups (Figure 1).
Discussion
MRI is presently considered the only method available to measure molecular diffusion in vivo. This phenomenon is related to the Brownian motion of the water molecules within the tissues, but it cannot be explained only by this motion. Other additional factors have been considered,
Figure 1. Plot shows apparent diffu-sion coefficient (ADC) values for the normal renal parenchyma (¤), cysts (h), hydronephrosis (#), pyonephrosis (n), and solid renal tumours (&).
such as perfusion in the capillary network. Therefore the diffusion phenomenon is measured by the ADC rather than by the diffusion coefficient. The kidney is well suited for diffusion studies because of its high blood flow and its fluid transport function. According to some authors [13, 14], these factors can explain the higher renal ADC values as compared with other organs.
In normal kidneys we recorded a mean ADC value of 2.19¡0.1761023 mm2s21. In the literature there is a wide spread of data regarding the ADC values of the kidneys in human beings. Muller et al [15] first reported renal ADC values of 3.54¡0.4761023mm2s21. The same authors later evaluated both dehydrated and subsequently rehy-drated patients and reported ADC values of 2.88¡0.656 1023mm2s21 and 3.56¡0.3261023mm2s21, respec-tively [13]. These values are consistent with data later reported by Namimoto et al [8] who found lower values in the cortex as compared with the medulla (2.5561023mm2s21 vs 2.8461023mm2s21). Siegel et al [16] reported slightly lower values, ranging from 1.79¡0.3961023 mm2s21 to 2.95¡0.5861023mm2s21, while remarkably lower values were found by Toyoshima et al [10] (1.68¡0.1561023mm2s21) and by Fukuda et al [9] who reported values ranging from 1.50 to 1.5361023mm2s21 when considering the mesorenal evaluation with the higher range of b-values they used (317–932 s mm22). It is to be noted that these data are related to papers published in the last 10 years using different MR units (some commercially available and some experimental equipments) and different techniques. Such
differences can probably explain the reported wide data spread. However, our data provide values which are in the mid-range of those reported to date, and the lower standard deviations of our results provide further con-fidence in our findings. Some authors [8, 13, 16] have reported higher values in the medulla as compared with the renal cortex, and this finding was validated by the results obtained by Laissy et al in rats [14]. We did not try to evaluate ADC values in the cortex and in the medulla separately because it may be difficult and inaccurate to position the ROI cursor on the renal cortex and medulla of the kidney separately, as already pointed out by Fukuda et al [9]. In our study the ROI cursors were placed at the approximate level of the corticomedullary junction. In the mesorenal area we preferred the evaluation recommended by Fukuda et al [9] who suggested that evaluation of ADC values in the central portion of the kidneys is less influenced by the perfusion effect.
In spite of motion-related problems theoretically affect-ing abdominal diffusion imagaffect-ing [11, 12, 16], in our series distinct significant differences were detected among different patient groups, namely, relative to normal renal parenchyma, higher ADC values in simple renal cysts and in renal pelvis of hydronephrotic kidneys, lower ADC values in solid renal tumours and the lowest ADC values in the renal pelvis of pyonephrotic kidneys. Largely overlapping ADC values were shown for renal cysts and hydronephrosis. The ADC values of two single cases of renal tumour (renal cell carcinomas) marginally over-lapped with normal renal parenchyma.
Only a few papers in the literature report experiences (a)
(c)
(b)
Figure 2. Normal kidneys in a 48-year-old woman. (a) Diffusion-weighted spin-echo echo planar imaging (SE EPI) image with b50 s mm22. (b) Diffusion-weighted SE EPI image
with b5500 s mm22. (c) Apparent diffusion coefficient (ADC)
map. The ADC value measured in the region of interest (ROI) located in the anterior labrum of the right kidney is 1.91¡0.3161023mm2s21.
with DW MRI in renal disease in humans [8, 10–12]. Namimoto et al [8] reported significantly lower ADC values in both the cortex and medulla in kidneys with chronic renal failure and in kidneys with acute renal failure compared with normal kidneys. Moreover these authors showed significantly lower ADC values in the cortex in renal artery stenosis kidneys compared with normal renal parenchyma. Toyoshima et al [10] found that the mean values for ADCs of the parenchyma of dysfunctioning hydronephrotic kidneys were significantly lower than those of the normal functioning hydronephrotic kidneys.
Verswijvel et al [12] reported lower ADC values in affected parenchymal areas in three patients with acute pyelonephritis, in one case of pyogenic abscess and in one patient with xanthogranulomatous pyelonephritis, com-pared with the normal renal parenchyma.
Our results are in agreement with recently published data by Chan et al [11]. In a series of 12 patients the authors showed that the pelvicalyceal system of the hydronephrotic kidneys (n58) was hypointense on DW
images while the pelvicalyceal system of the pyonephrotic kidneys (n54) was markedly hyperintense. Moreover the mean ADC values they reported in the renal pelvis of hydronephrotic and pyonephrotic kidneys were 2.98¡0.656 1023mm2s21 and 0.64¡0.3561023mm2s21, respec-tively. The thick, adhesive fluid in the collecting system of the pyonephrotic kidneys has a very high viscosity and cellularity, thus providing a very low ADC which explains its hyperintensity on DW images and hypointensity on ADC maps, indicating restricted diffusion. Despite the low number of pyonephrotic kidneys both in this published series (n54) [11] and in our series (n53), MR diffusion imaging showed a very clear cut-off between the ADC values of the renal pelvis in infected and non-infected cases, thus proving the efficacy of the technique for this differential diagnosis.
To date, no papers have been published on MR diffusion imaging in patients with renal masses. In our series we found a clear cut-off between the ADC values of solid renal tumours and simple cysts, and a marginal (a)
(c) (d)
(b)
Figure 3. Cyst of the right kidney. (a) Axial turbo spin echo (TSE) T2 weighted image with fat saturation. The lesion is
clearly hyperintense. (b) Diffusion-weighted spin-echo echo planar imaging (SE EPI) image with b50 s mm22. The cyst is highly
hyperintense. (c) Diffusion-weighted SE EPI image with b5500 s mm22. The cyst is slightly hyperintense. (d) Apparent diffusion
coefficient (ADC) map. The ADC value measured at the cyst level is 3.48¡0.1661023mm2s21, while the ADC value measured in
overlap between solid renal tumours and normal renal parenchyma. However, the significance of these results is affected by several factors, namely the low number of evaluated renal tumours, their different histology and their homogeneity. In particular, the small size of renal cell carcinomas (no larger than 3 cm) accounts for their homogeneity. No necrotic or cystic areas within these tumours were detected on MR images. This provides
further proof of the clear distinction between ADC values in renal tumours and simple cysts in our data. Further investigations are required to assess possible differences in ADC values between cystic or necrotic renal tumours and complex renal cysts.
In conclusion, on the basis of this preliminary experience, DW MRI of the kidney seems to be a feasible and reliable method to differentiate normal renal (a)
(c) (d)
(b)
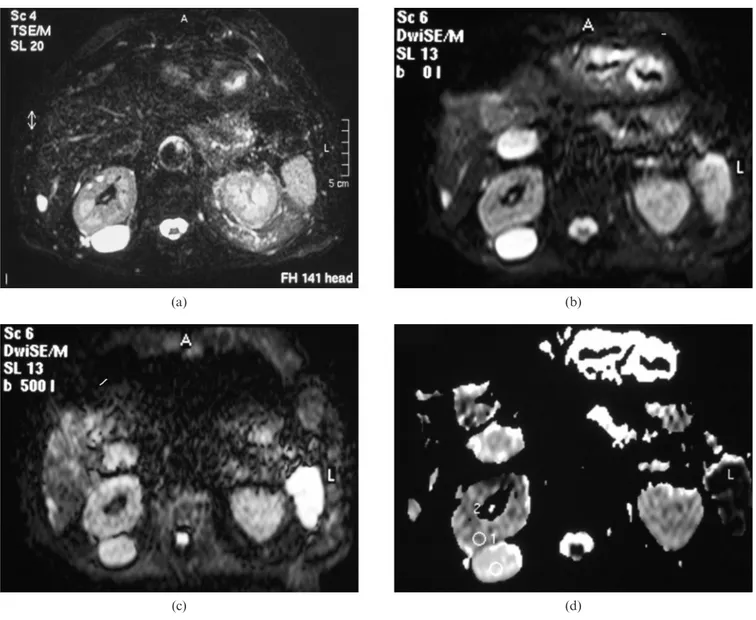
Figure 4. Hydronephrosis of the right kidney and pyonephrosis of the left kidney. (a) Coronal turbo spin echo (TSE) T1weighted image.
Low signal intensity of the dilated right and left collecting systems. (b) Diffusion-weighted spin-echo echo planar imaging (SE EPI) image with b50 s mm22. Slight hyperintensity of the renal pelvis of right and left kidney. (c) Diffusion-weighted SE EPI image with
b5500 s mm22. Very low signal intensity of the right renal pelvis. Marked hyperintensity of the renal pelvis of the left kidney, indicative of
restricted diffusion. (d) Apparent diffusion coefficient (ADC) map. The ADC value measured at the right dilated hydronephrotic renal pelvis is 3.39¡0.4861023mm2s21, while the ADC value measured at the left dilated renal pyonephrotic pelvis is 0.77¡0.1761023mm2s21.
parenchyma and different renal diseases. This technique could be applied in the clinical area as a rapid addition to existing kidney MRI protocols since the acquisition time of the sequence is only 17 s and thus provide DW images of diagnostic quality as well as quantitative data regarding diffusivity. However, clinical experience with this method is still preliminary and further studies are required to validate the present results and to better elucidate the clinical application of this technique.
References
1. Tsuruda JS, Chew WM, Moseley ME, Norman D. Diffusion-weighted MR imaging of the brain: value of differentiating between extraaxial cysts and epidermoid tumors. AJNR Am J Neuroradiol 1990;11:925–31.
2. Warach S, Chien D, Li W, Ronthal M, Edelman RR. Fast magnetic resonance diffusion-weighted imaging of acute human stroke. Neurology 1992;42:1717–23.
(a)
(c) (d)
(e)
(b)
Figure 5. Oncocytoma of the right kidney. (a) Axial turbo spin echo (TSE) T2 weighted image with fat saturation. The
lesion is clearly hypointense. (b) Diffusion-weighted spin-echo echo planar imaging (SE EPI) image with b50 s mm22. The lesion is slightly hypointense. (c) Diffusion-weighted SE EPI image with b5500 s mm22. The lesion is homogeneous and
clearly hyperintense. This feature is indicative of restricted dif-fusion. (d) Apparent diffusion coefficient (ADC) map. The ADC value measured in the oncocytoma is 1.33¡0.1261023mm2s21.
(e) ADC map at the same level 1 week later. The ADC value measured in the oncocytoma is 1.38¡0.2161023mm2s21,
3. Ebisu T, Tanaka C, Umeda M, Kitamura M, Naruse S, Higuchi T, et al. Discrimination of brain abscess from necrotic or cystic tumors by diffusion-weighted echo planar imaging. Magn Reson Imaging 1996;14:1113–6.
4. Castillo M, Murkherji SK. Diffusion-weighted imaging in the evaluation of intracranial lesions. Semin Ultrasound CT MR 2000;21:405–16.
5. Schaefer PW, Grant PE, Gonzalez RG. Diffusion-weighted MR imaging of the brain. Radiology 2000;217:331–45. 6. Leuthardt EC, Wippold FJ, Oswood MC, Rich KM.
Diffusion-weighted MR imaging in the preoperative assessment of brain abscesses. Surg Neurol 2002;58:395– 402.
7. Yamashita Y, Tang Y, Mutsumasa T. Ultrafast MR imaging of the abdomen: echo planar imaging and diffusion weighted imaging. J Magn Reson Imaging 1998;8:367–74.
8. Namimoto T, Yamashita Y, Mitsuzaki K, Nakayama Y, Tang Y, Takahashi M. Measurement of the apparent diffusion coefficient in diffuse renal disease by diffusion-weighted echo-planar imaging. J Magn Reson Imaging 1999;9:832–7.
9. Fukuda Y, Ohashi I, Hanafusa K, Nakagawa T, Ohtani S, An-naka Y, et al. Anisotropic diffusion in kidney: apparent diffusion coefficient measurements for clinical use. J Magn Reson Imaging 2000;11:156–60.
10. Toyoshima S, Noguchi K, Seto H, Shimizu M, Watanabe N. Functional evaluation of hydronephrosis by diffusion-weighted MR imaging. Acta Radiol 2000;41:642–6.
11. Chan JHM, Tsui EYK, Luk SH, Fung SL, Cheung YK, Chan MSM, et al. MR diffusion-weighted imaging of kidney: differentiation between hydronephrosis and pyonephrosis. J Clin Imaging 2001;25:110–3.
12. Verswijvel G, Vandecaveye V, Gelin G, Vandevenne J, Grieten M, Horvath M, et al. Diffusion-weighted MR imaging in the evaluation of renal infection: preliminary results. JBR-BTR 2002;85:100–3.
13. Muller MF, Prasad PV, Bimmler D, Kaiser A, Edelman RR. Functional imaging of the kidney by means of measurement of the apparent diffusion coefficient. Radiology 1994;193:711–5. 14. Laissy JP, Menegazzo D, Dumont E, Piekarski JD,
Karila-Cohen P, Chillon S, et al. Hemodynamic effect of iodinated high-viscosity contrast medium in the rat kidney. Invest Radiol 2000;35:647–52.
15. Muller MF, Prasad PV, Siewert B, Nissenbaum MA, Raptopoulos V, Edelman RR. Abdominal diffusion mapping with use of a whole-body echo-planar system. Radiology 1994;190:475–8.
16. Siegel CL, Aisen AM, Ellis JH, Londy F, Chenevert TL. Feasibility of MR diffusion studies in the kidney. J Magn Reson Imaging 1995;5:617–20.