arXiv:1703.09815v1 [astro-ph.HE] 28 Mar 2017
The high-Eddington NLS1 Ark 564 has the coolest corona
E. Kara
1,2
⋆
, J. A. Garc´ıa
3,4,5
, A. Lohfink
6
, A. C. Fabian
6
, C. S. Reynolds
1
,
F. Tombesi
2,1
and D. R. Wilkins
7
1Department of Astronomy, University of Maryland, College Park, MD 20742
2X-ray Astrophysics Laboratory, NASA/Goddard Space Flight Center, Greenbelt, MD 20771
3Cahill Center for Astronomy and Astrophysics, California Institute of Technology, Pasadena, CA 91125
4Remeis Observatory & ECAP, Universit ˜Ad’t Erlangen-N ˜Aijrnberg, Sternwartstrasse 7, D-96049 Bamberg, Germany 5Harvard-Smithsonian Center for Astrophysics, 60 Garden Street, Cambridge, MA 02138, USA
6Institute of Astronomy, Madingley Rd, Cambridge CB3 0HA, United Kingdom 7KIPAC, Stanford University, 452 Lomita Mall, Stanford, CA 94305
30 March 2017
ABSTRACT
Ark 564 is an archetypal Narrow line Seyfert 1 that has been well observed in soft X-rays from 0.3–10 keV, revealing a steep spectrum, strong soft excess, iron K emission line and dramatic variability on the order of hours. Because of its very steep spectrum, observations of the source above 10 keV have been sparse. We report here on the first NuSTAR observation of Ark 564. The source was observed for 200 ks with NuSTAR, 50 ks of which were concurrent with Suzaku observations. NuSTAR and Suzaku ob-served a dramatic flare, in which the hard emission is clearly delayed with respect to the soft emission, consistent with previous detections of a low-frequency hard lag found in XMM-Newton data. The NuSTAR spectrum is well described by a low-temperature Comptonisation continuum (with an electron temperature of 15 ± 2 keV), which irra-diates a highly ionised disc. No further relativistic broadening or ionized absorption is required. These spectral results show that Ark 564 has one of the lowest temperature coronae observed by NuSTAR to date. We discuss possible reasons for low-temperature coronae in high-Eddington sources.
Key words: black hole physics – galaxies: active – X-rays: individual: Ark 564.
1 INTRODUCTION
Narrow-line Seyfert 1 galaxies (NLS1s) were initially classi-fied for their striking optical properties–narrow Hβ lines, weak [OIII] and strong FeII lines (Osterbrock & Pogge 1985), which suggested these Active Galactic Nuclei (AGN) contained relatively small central supermassive black holes accreting near or even above the Eddington limit (Boroson & Green 1992). In addition to their unique opti-cal spectra, NLS1s show interesting behaviour in the X-ray band, including steep 2–10 keV photon indices (Brandt et al. 1997) and very rapid variability, which corroborates the pic-ture of low-mass black holes accreting at high-Eddington rates, where the X-ray emitting corona is cooled via inverse Compton scattering by the intense UV flux of the accretion disc (e.g.Pounds et al. 1995). Such a model predicts that, for a given optical depth, the temperature of the corona in steep spectra NLS1s will be cooler than in other Seyferts (Haardt & Maraschi 1993; Zdziarski et al. 1994). However
⋆
E-mail: [email protected]
due to the intrinsically steep spectra of these sources and the low-sensitivity of previous hard X-ray instruments, ob-servations of steep spectrum NLS1s above 10 keV have been sparse. In this paper, we present the first results of a deep observation of the well-known NLS1 Ark 564 taken with the Nuclear Spectroscopic Telescope Array (NuSTAR; Harrison et al. 2013). We find one of the lowest temperature coronae discovered with NuSTAR.
Apart from the coronal continuum, both broad and narrow-line Seyfert 1s show interesting spectral features, in-cluding a soft excess below 1 keV and a dip at ∼ 7 keV. Since their discoveries, the soft excess and iron K feature have been subjects of debate. The soft excess is a largely featureless component that can be well-modelled by an ad-ditional Comptonisation component with a temperature of 0.2 keV. However, this temperature is constant, regardless of the mass or mass accretion rate of the central black hole, which requires some fine-tuning (see Czerny et al. 2003;
Gierli´nski & Done 2004). Alternatively, the soft excess can
be well described by a reflection model where the corona irradiates a partially ionised disc, causing the fluorescence
of atomic lines that are relativistically smeared due to the proximity to the central black hole Fabian et al.(1989). In this reflection model, the dip at 7 keV is interpreted as the blue wing of relativistically broadened iron Kα emis-sion line. Alternatively, the strong dip (especially in the ex-treme NLS1 1H0707-495) has been interpreted as a P-Cygni profile from emission and absorption in a Compton-thick wind (Done et al. 2007), or even completely via absorption through distant partial covering clouds (Mizumoto et al. 2014), though this model requires absorption from several different ionization zones with the same covering factor (see
Kara et al. 2015bfor more details).
The basic picture of reflection off the inner accretion disc is supported by the recent discovery of X-ray reverber-ation, where the soft excess and iron K band are seen to re-spond seconds to minutes after the X-ray continuum, due to the additional light path these photons traveled. These time lags were initially found between the strong soft excess and the X-ray continuum in several variable NLS1s (e.g.
1H0707-495, Fabian et al. 2009;Zoghbi et al. 2010, and tentatively
in Ark 564,McHardy et al. 2007), and later in several other Seyfert 1s (e.g. De Marco et al. 2013). Reverberation was later found associated with the broad iron K emission line (Zoghbi et al. 2012,2013a;Kara et al. 2013,2016). Through a recent study of a large sample of variable Seyfert galax-ies, we find that reverberation is common in both broad and narrow-line Seyfert 1 galaxies, and find tentative evidence that the inferred distance from the corona to the disc in-creases with mass accretion rate (Kara et al. 2016).
Further support of the ionised reflection model has come from observations above 10 keV, which can now be probed thanks to the unprecedented hard-band sensi-tivity of NuSTAR. In its first four years in orbit, NuS-TAR has observed several broad line Seyfert 1 galaxies (e.g. NGC 1365, Risaliti et al. 2013; Walton et al. 2013, Mrk 335; Parker et al. 2014;Wilkins et al. 2015, Fairall 9; Lohfink et al. 2016) and a few NLS1s (Swift J2127.4+5654;
Marinucci et al. 2014, 1H0707-495;Kara et al. 2015b), and
finds a ubiquitous hard excess above the continuum, peak-ing at ∼ 20 − 30 keV. This feature is predicted by reflection scenarios as coronal photons above 10 keV will Compton scatter off the accretion disc, and also rules out models that try to explain the spectrum through absorption alone. Fur-thermore, the so-called Compton hump has also been seen to reverberate a few hundred seconds after the continuum emission in three Seyferts (Zoghbi et al. 2014; Kara et al. 2015a).
In addition to measuring accretion disc parameters from observations of reflection, NuSTAR can also put strong constraints on the temperature of the continuum-emitting corona by measuring the high-energy cut-off. Cut-offs have been measured in a few AGN thus far (Balokovi´c et al. 2014;
Brenneman et al. 2014;Marinucci et al. 2014;Tortosa et al.
2016), and constraining upper limits have been found in several others (see Marinucci et al. 2016 for a compila-tion). Recently, Fabian et al. (2015) found that most of the coronae observed by NuSTAR thus far have temper-atures that lay close to the physically allowed limit. In a compact corona, where a significant fraction of the upscat-tered X-ray luminosity is radiated at energies above 511 keV (the electron rest energy), many of the high-energy photons will not escape the corona, but instead will collide
with other high-energy photons, producing electron-positron pairs. Therefore, any additional heat to the corona will not contribute to more high-energy radiation above 511 keV, but rather will create more electron-positron pairs at lower en-ergy, thus putting a hard limit on the temperature of the corona (Svensson 1982;Guilbert et al. 1983). The results of
Fabian et al. (2015) suggest that many of the coronae
ob-served thus far could be pair-dominated plasmas.
We expand upon these spectral and timing studies with NuSTAR by observing one of the X-ray brightest NLS1 galaxies, Ark 564. While two other steep NLS1s have been observed with NuSTAR (1H0707-495 and IRAS 13224-3809), Ark 564 is almost an order of magnitude brighter, and so we can now place interesting constraints on the Compton hump and high-energy cut-off in a steep NLS1.
1.1 The X-ray bright NLS1 Ark 564
Ark 564 (z = 0.02468) is a popular source for X-ray studies because it exemplifies the unusual characteristics of a NLS1: steep X-ray spectrum, strong soft excess, and rapid variabil-ity. It also has the benefit of being extremely bright in the soft X-ray band (F0.3−10 keV = 1.4 × 10⁻¹⁰ erg/s/cm2
dur-ing this campaign). Because of these qualities, it has been observed by all the major X-ray observatories, and now we include NuSTAR to this list.
In addition to its broadband spectral features, Ark 564 has been studied with high-resolution spectrometers, and a low-ionization warm absorber is found (e.g.Giustini et al.
2015;Laha et al. 2014;Tombesi et al. 2010;Papadakis et al.
2007). Interestingly,Giustini et al.(2015) and most recently
Khanna et al. (2016) found through long
XMM-Newton-RGS observations that the low ionization warm absorber is unusually low-velocity compared to other Seyferts. While these studies are important for obtaining a complete picture of the AGN, with the limited soft-band coverage we have in these current observations (50 ks with Suzaku-XIS), we do not require any additional warm absorber component to describe the data.
Ark 564 is also a very unusual source in terms of its timing properties. Eight years of RXTE observations, to-gether with ASCA and XMM-Newton observations allowed for measuring the X-ray power spectral density (PSD) over 8 decades in temporal frequency (McHardy et al. 2007). This revealed the presence of a low-frequency break in the PSD, which had never been seen in other Seyfert galaxies (e.g.Uttley et al. 2002,Markowitz et al. 2003). The authors noted that the PSD of Ark 564 is very reminiscent of the X-ray binary Cyg X-1 in the luminous hard state, and sug-gested that Ark 564 is the AGN analog of this accretion state (see alsoAr´evalo et al. 2006and Section4in this paper).
The rapid variability of Ark 564 has also revealed in-teresting physics. In Kara et al. (2013), we used a 500 ks XMM-Newtonof Ark 564 (Legg et al. 2012) to measured the lag-energy spectrum at different temporal frequencies. We found that the low-frequency lags (∼ 10−5− 10−4 Hz) show a featureless log-linear increase with energy (consistent with the lag being associated with the continuum;Kotov et al.
2001,Ar´evalo & Uttley 2006), and that the high-frequency
lags (∼ 10−4− 10−3Hz) show clear evidence for iron K rever-beration. This confirmed that two separate processes were responsible for the low- and high-frequency lags, and that
S
u
za
k
u
0
.7
-1
0
k
eV
c
o
u
n
t r
at
e
0
5
10
15
20
25
N
u
S
T
A
R
3
-7
9
k
eV
c
o
u
n
t
ra
te
0
0.5
1
1.5
2
NuSTAR MET (s)
1.701×10
81.702×10
81.703×10
81.704×10
8Figure 1.NuSTAR FPMA+FPMB (blue; left axis) and Suzaku XIS FI+BI (red; right axis) light curves in 800 s bins. The NuSTAR exposure is 200 ks. Suzaku joined the campaign for a 50 ks exposure and fortuitously observed a bright flare. There is a clear time delay between the Suzaku and NuSTAR flares. See Fig.4for a more detailed look at the flare in different energy bands.
n
o
rm
al
iz
ed
c
o
u
n
ts
/s
/k
eV
10
−510
−410
−30.01
0.1
1
Energy (keV)
1
5
10
50
NuSTAR FPMA+FPMB
Suzaku FI XIS
ra
ti
o
0.4
0.6
0.8
1
1.2
Energy (keV)
1
5
10
50
Figure 2.left: NuSTAR FPMA+FPMB (blue) and Suzaku XIS FI (red) spectra and their respective background spectra (filled regions). right: The NuSTAR and Suzaku spectra fit to a simple powerlaw with Galactic absorption. The photon index and normalization was free to vary as the Suzaku observation occurred during a higher flux epoch. The spectrum is steep (Γ ∼ 2.5) and there is a clear iron K line and fall-off at high energies.
the high-frequency lags were not a phase wrapping artefact from reverberation of distant circumnuclear material (e.g. Miller et al. 2010).
In this paper we extend the X-ray observations of Ark 564 to high energies through a 200 ks observation with the NuSTAR observatory. The paper is organized as fol-lows: in Section 2 we describe the observations and data reduction. In Section 3 we present the results of the tim-ing and spectral fitttim-ing analyses, and discuss the interpreta-tions of these results in Section4. Unless otherwise specified for one interesting parameter, the error bars indicate the 90% confidence interval. Throughout this paper, luminosi-ties are calculated using a ΛCDM cosmological model with H0= 71 km s−1 Mpc−1.
2 OBSERVATIONS
NuSTARobservations of Ark 564 were taken on 2015-May-22 for a total exposure of 200 ks. During the observation, the AGN was variable (as usual), but there was also a particu-larly striking flare, where the 3–79 keV flux increased by a factor of 3 for ∼ 5 ks (Fig.1; blue points). The NuSTAR ob-servations were accompanied by Suzaku obob-servations start-ing on 2015-May-25 for 50 ks in order to obtain some simul-taneous soft X-ray coverage. Fortuitously, the 50 ks Suzaku exposure occurred during the time of the flare (Fig.1; red points). There is a clear delay between the flares as seen by Suzakuand NuSTAR. We describe this flare in more detail in Section3.1on the timing analysis results.
The NuSTAR Level 1 data products were processed with the NuSTAR Data Analysis Software (NUSTARDAS v1.6.0), and the cleaned Level 2 event files were produced and calibrated with the standard filtering criteria using the
[1-6] × 10-5 Hz L ag ( s) −1000 0 1000 2000 3000 Energy (keV) 10 5 20 50
Figure 3.Frequency-resolved time lags as a function of energy at frequencies [1 − 6] × 10−5Hz. The lag is calculated between each
energy bin and the entire reference band from 3–50 keV (exclud-ing the bin-of-interest to avoid correlated errors). The error bars indicate 1σ confidence intervals. These frequency-resolved time lags show qualitatively similar results to Fig.4, where the time lag is seen directly in the light curve.
NUPIPELINE task and CALDB version 20160502. We ex-tracted several region sizes in order to obtain the highest signal-to-noise spectra, and found the optimal source region was a circular source region of radius 50 arcsec. We used a background region of radius 60 arcsec. The regions were the same for both instruments, Focal Plane Module A and Focal Plane Module B (FPMA/FPMB). The spectra were binned in order to oversample the instrumental resolution by a factor of 2.5 and to have a signal-to-noise ratio of greater than 3σ in each spectral bin, though coarser binning over-sampling the spectral resolution to a factor of at least 3 and to a signal-to-noise of > 5σ resulted in very similar best-fit parameters.
The Suzaku observations were processed from the unfil-tered event files for each of the XIS CCDs. The source and background regions were 3.5 arcmin in radius. XSELECT was used to extract the spectral products, and the responses were generated with medium resolution using XISRESP. The front-illuminated (FI) spectra and responses were com-bined. The back-illuminated (BI) spectrum was noisy, and so it was not included in the spectral modelling. However, it was checked for consistency with the front-illuminated spectrum. The XIS spectrum was binned to a minimum of 25 counts per bin. We visually inspected the band from 1-2.5 keV, where there are known calibration uncertainties, and found two sharp instrumental features around 1.4 and 1.8 keV, and therefore we excised the 1.3-2 keV band. The spectral fitting was limited to data above 1 keV in order to avoid the low energy bands that were known to be effected by build-up of molecular contamination on the optical block filter, especially at the end of the Suzaku mission1. For the
timing analysis, we used the 0.7–10 keV band, since the
cal-1 http://space.mit.edu/XIS/monitor/contam/
Time (s)
0
10
42×10
40.7-3
3-5
5-7
7-10
10-50
co
u
n
ts
/s
(
ar
b
it
ra
ri
ly
s
ca
le
d
)
Figure 4.A more detailed look at the flare shown in Fig. 1. The start time on the x-axis corresponds to 1.703 × 10⁸ seconds
MET, and the y-axis is the light curve count rate scaled arbitrarily for visual purposes. We use 512 s time bins for both Suzaku and NuSTAR light curves, with the larger bins being due to the orbital gaps of both instruments. The light curves increase in energy from top to bottom, and the exact energy ranges in units of keV are shown in the figure key. We show both Suzaku and NuSTAR light curves of the 3–5 keV band for comparison (open circles for Suzaku, filled for NuSTAR). The peak of the flare in the 10– 50 keV band is roughly 6000 seconds after the peak of the flare in the 0.7–3 keV band. This is consistent with the amplitude of the hard lag found in the Fourier analysis, shown in Fig3.
ibration effects do not effect the relative flux at each time bin.
Fig. 2 shows the NuSTAR (FPMA/FPMB combined) and Suzaku-XIS (FI) spectra and the respective background spectra for each instrument. The NuSTAR spectrum dom-inates over the noise up to 27 keV. The panel on the right shows the Suzaku and NuSTAR spectra fit to a simple pow-erlaw with Galactic absorption (nH,Gal= 5.3×1020cm−2; Lei-den/Argentine/Bonn Survey of Galactic HI;Kalberla et al. 2005). The photon index and normalization were left to vary to account for possible spectral variability during the flar-ing epoch. Ark 564 has a strong soft excess and a clear iron line peaking at 6–7 keV. The high-energy coverage of NuS-TARreveals for the first time that the edge of the iron line extends to ∼ 11 keV. Fitting the 3–10 keV NuSTAR spec-trum with a powerlaw plus Gaussian reveals an equivalent width of the iron line of 280 ± 50 eV. This is much stronger than previous detections of the iron K line with XMM-Newton (e.g. Papadakis et al. 2007,Giustini et al. 2015), which found equivalent widths of ∼ 100 eV. The smaller equivalent width found in XMM-Newton observations is
possibly an effect of residual pile-up, as the only inconsis-tency between the XMM-Newton and NuSTAR spectra is a ∼ 15 − 20%excess in the 7–10 keV XMM-Newton spectrum with respect to that from NuSTAR.
These NuSTAR observations reveal the first clear de-tection of the iron line band and a hard excess above 10 keV (often interpreted as the Compton reflection hump). Also evident in the spectrum are hints of a downturn starting at 20 keV. In Section 3.2, we report on results of the spectral modelling of these Suzaku and NuSTAR spectra.
3 RESULTS
3.1 Timing results
Ark 564 is highly variable in the soft X-rays and therefore it has been the target for several time lag studies. Now with these NuSTAR observations, we can attempt to extend the timing analysis up to energies above 10 keV. Time lag anal-ysis of other AGN observed with NuSTAR has been very elucidating for high-frequency reverberation studies, reveal-ing both the iron K and Compton hump lag in MCG-5-23-16 (Zoghbi et al. 2014) and Swift J2127.4+5654 (Kara et al. 2015a). To perform a frequency-resolved time lag analysis on frequencies longer than the NuSTAR orbital frequency (∼ 10−3 Hz), we use the Maximum likelihood technique
de-scribed inZoghbi et al. (2013b). This is in essence a time-domain approach, which directly fits the light curves for the most likely frequency-dependent phase lag (Miller et al. 2010). The errors represent the 68% confidence intervals on the values that change -2log(L/Lmax)by 1 (seeZoghbi et al.
2013bfor more details).
In Fig.3, we show the lag-energy spectrum at frequen-cies [1 − 6] × 10−5 Hz computed using the Maximum likeli-hood method. The lag-energy spectrum shows the time lag between each bin of interest and a broad reference band, which we take to be the 3–50 keV band in this case (with the bin-of-interest removed). As the reference band is nearly the same for each bin-of-interest, the meaningful time lag is the relative time lag between each small bin. We see the lag increases steadily with energy, similar to the results found inAr´evalo et al. (2006) andKara et al. (2013) using XMM-Newtondata. Unfortunately, due to limited statistics we were unable to probe higher frequencies, where iron K reverberation was found previously.
In addition to finding hard lags using a sophisticated frequency-resolved Maximum Likelihood approach, we can also see the hard lag by eye during the bright flare. Fig. 4 shows the Suzaku and NuSTAR light curves in several energy bands from softest (top; red) to hardest (bottom; blue). We zero-in on the time just around the flare (t0= 1.703 × 10⁸ s for comparison to Fig. 1). The peak of the flare is around t0 + 104 s in the 0.7–3 keV band and by the 10–50 keV band, the peak has shifted by several thousands of sec-onds. The amplitude of the lag found during this short flare is consistent with what we find from the frequency-resolved timing analysis performed on the entire light curve (Fig.3), and is similar in energy-dependence and timescale to the low-frequency lags found in archival XMM-Newton data (Legg et al. 2012;Kara et al. 2013).
(a) powerlaw
ra
ti
o
0.6
0.7
0.8
0.9
1
1.1
1.2
(b) xillver (w/ powerlaw)
ra
ti
o
0.6
0.7
0.8
0.9
1
1.1
1.2
(c) xillver (w/ cutoffpl)
ra
ti
o
0.6
0.7
0.8
0.9
1
1.1
1.2
(d) xillverCp (w/ nthcomp)
ra
ti
o
0.6
0.7
0.8
0.9
1
1.1
1.2
Energy (keV)
10
5
20
Figure 5.The ratio of the full FPMA+FPMB NuSTAR spec-tra to different models. (a) The ratio plot to a simple powerlaw. (b) The ratio plot to an ionised reflection model with no high-energy cut-off. (c) The ratio plot to an ionised reflection model with high-energy cut-off. The best fit cut-off energy using the xillver model is Ecut = 42 ± 3 keV. (d) The ratio plot to xil-lverCp, an ionised reflection model irradiated by a Comptoniza-tion continuum (nthcomp; rather than a cutoff powerlaw). The best fit coronal electron temperature using the xillverCp model is Te= 15 ± 2 keV. The details of the parameters for the best fit xillver and xillverCp can be found in the first two columns of Table1.
3.2 Spectral results 3.2.1 NuSTAR fits
Ark 564 shows similar spectral properties to other well-known extreme Narrow-line Seyfert I galaxies, like 1H0707-495 and IRAS 13224-3809. It shows a strong soft excess, strong reprocessing features and a very steep spectrum. The benefit of Ark 564 is that it is ten times brighter in soft X-rays than either of these sources, and therefore, it provides us with the best opportunity for studying the high-energy emission in a very steep spectrum NLS1.
We begin our fitting procedure by examining the 3– 50 keV NuSTAR spectrum (Fig.5). The ratio to a simple powerlaw model (Fig.5-a) shows a strong iron K emission line, and so we start by modelling this with an ionised re-flection model with cut-off energy fixed to the maximum value to see if the curvature of the high-energy emission can be described by the Compton reflection hump (xillver;
NuSTAR NuSTAR+Suzaku
Xillver XillverCp Bremss + Relxilllp Xstar(Bremms + Xillver)
nH× 1024 (cm−2) – – – 1.4+0.7
−0.6
log(ξwind) (log(erg cm s−1) – – – 3.7 ± 0.1
zwind – – – 0.413 ± 0.02 h(G M/c2) – – 2.6+47 −0.03 – a – – 0+0.99 −0. – i(deg) 22+7 −2 45 ± 45 63 ± 6 45 ± 45 Γ 2.27 ± 0.08 2.32+0.02 −0.01 2.54+0.04−0.09 2.389 ± 0.004 log(ξ) (log(erg cm s−1) >4.3 4.43 ± 0.06 4.02+0.04 −0.06 4.6 ± 0.1 AFe 5.8+3.0 −1.9 1.4 ± 0.2 3.6+0.9−2.85 1.1 ± 0.3 Ecut(keV) 42 ± 3 – 63+4−2 46 ± 3 Te (keV) – 15+2−1 – – R 1.19+139 −0.8 1.18+2.1−1.18 0.7+0.37−0.5 1.0 ± 0.6 Arefl× 10−4 0.26+0.04 −0.15 0.24+0.3−0.06 3 ± 1 1.4 ± 1 kT(keV) – – 0.19+0.06 −0.03 0.25+0.060.04 ABremss – – 0.5+1.0 −0.3 0.43 ± 0.2 χ2/d.o.f. 378/374 380/374 1248/1235 1246/1234
Table 1.Parameters of the best fit spectral models for two models fit to the NuSTAR data alone and two models fit to the combined NuSTAR+Suzaku spectra. In order from top to bottom, the parameters are: the column density of the wind (nH), log of the ionization
parameter of the wind (ξwind), blueshift on the absorption feature (zwind), height of the continuum point source (h), inclination of the
disc (i), photon index (Γ), log of the disc ionization parameter (ξ), iron abundance of reflector (AFe), continuum cut-off energy (Ecut),
coronal temperature (Te), reflection fraction (R), normalization of the reflection component (Arefl), and the plasma temperature (kT )
and normalization (ABremss) of thermal bremsstrahlung component. The fits, in order from left to right show: NuSTAR alone fit with a
powerlaw with exponential cut-off and ionized reflection (xillver), NuSTAR alone fit with a physical Comptonization model and ionized reflection xillverCp, NuSTAR+Suzaku fit with relxilllp and an additional Bremsstrahlung component, and finally NuSTAR+Suzaku fit with ionised reflection and Bremsstrahlung component through an ionized outflowing wind.
Figure 6.Results of the MCMC analysis of the ionised reflection model applied to the NuSTAR data. We show the outputs for photon index Γ, iron abundance AFe, cut-off energy Ecut(keV) and
ionization parameter log(ξ) (log(erg cm s−1)). The 1D histograms
show the probability distribution for each parameter normalized to unity.
Garc´ıa et al. 2013). We obtain a fairly good description be-low 10 keV, but find strong residual curvature above 10 keV (Fig. 5-b). Therefore, we allow the high-energy cut-off to vary, and find a cut-off is constrained to be 42±3 keV (Fig. 5-c, and best fit parameters in Column 1 of Table1). Allowing the cut-off to vary does not significantly change any of the other reflection parameters.
To examine the dependences on the fitting pa-rameters, we performed Markov Chain Monte Carlo (MCMC) analysis, similar toParker et al.(2015), using the XSPEC EMCEE code by Jeremy Sanders2. This is a script
to use emcee (a pure-Python implementation of of Good-man & Weare’s Affine Invariant MCMC Ensemble sampler) to analyze X-ray spectra in xspec. We use 50 walkers with 10,000 iterations each, burning the first 1,000. The walk-ers started at the best fit values found in xspec, following a Gaussian distribution in each parameter, with the stan-dard deviation set to the delta value of that parameter. The MCMC results of the ionised reflection model applied to the NuSTARdata are shown in Fig.6for four relevant parame-ters: photon index, iron abundance, cut-off energy and ion-ization parameter. The ionion-ization parameter is pegged to its maximum value, and there is a degeneracy between this pa-rameter and the iron abundance (higher ionization parame-ter requires a higher iron abundance). The photon index and cut-off energy are both tightly constrained, though there is a slight degeneracy between these parameters.
The ionised reflection model is driven to extremely high ionisation parameters in order to fit the feature at 11 keV,
which is produced by the iron K edge near 7-8 keV and the continuum photoelectric absorption of iron, both smeared by multiple scatterings in the hotter region of the disc’s atmo-sphere. The resulting feature occurs at higher energies than other Seyfert galaxy observed with NuSTAR (see a sample of NuSTARreflection spectra in Fig. 1 ofFabian et al. 2014). The high ionisation smears the reflection spectrum, and we find that high ionisation alone is enough to broaden the iron line in these data (e.g. additional relativistic broadening is not statistically required). As the reflecting surface becomes more ionised, the reflection spectrum begins to resemble the irradiating continuum. To counteract this, the iron abun-dance is driven to super-solar values to fit the very clear iron line in the spectrum (hence the degeneracy between ionization parameter and iron abundance).
We still obtain a fairly good fit if we re-quire the iron abundance to be fixed to solar value ( χ2/dof = 405/375 = 1.08), though the super solar iron
abundance is preferred at > 4σ confidence. The result of fixing the iron abundance to solar values is that the ionisation parameter decreases, causing stronger residuals at ∼ 11 keV. We also attempted fits including neutral distant reflection (which could potentially lower the iron abundance), but the normalization of the distant reflector was orders of magnitude below the ionized reflection, and so did not improve the fit.
In order to get a better estimate of the corona electron temperature, we fit the spectrum with xillverCp (Garcia et al., in prep.), which is a model of ionised reflection irradi-ated by a physical Comptonisation continuum, rather than a phenomenological cut-off powerlaw. The thermal Comp-tonization model used is nthcomp (Zdziarski et al. 1996; ˙Zycki et al. 1999), which assumes a central spherical plasma surrounded by a geometrically thin disc. XillverCp re-sulted in an equally good fit as those with xillver, and the best-fit parameters were similar ( χ2/dof = 380/374 = 1.02).
See Fig.5d and Column 2 of Table1for details. The elec-tron temperature is constrained to be 15+2
−1 keV, which is
similar to the temperature suggested by the cut-off power-law fit (assuming Ecut = 2 − 3kTe). Given the photon index
(Γ = 2.32+0.02
−0.01) and electron temperature from nthcomp,
and using the equation for the photon index through solving the Kompaneets equation (Zdziarski et al. 1996), the corre-sponding optical depth is τ = 2.7 ± 0.2.
Interestingly, the one parameter that does vary be-tween xillverCp and xillver models is the iron abun-dance, which is close to solar values in model with a Comp-tonization continuum. This result might suggest that adding 2nd-order effects beyond the simplest reflection models could help solve the mystery of why some sources show statistically super-solar iron abundances.
3.2.2 Suzaku + NuSTAR fits
Next we take the best fit ionized reflection model to the full NuSTARspectrum, and apply it to the 50 ks Suzaku obser-vation (concurrent with 50 ks of the NuSTAR spectrum). In Fig. 7 we show the residuals of these data to the best fit ionised reflection model to the full NuSTAR spectrum, allowing for differences in normalization and photon index in the two epochs. One can clearly see that while the simple ionised reflection is a good description of the NuSTAR
spec-NuSTAR Suzaku ra ti o 0.8 0.9 1 1.1 Energy (keV) 10 5
Figure 7.The best fit xillver model fit to the entire NuSTAR observation, now renormalized (i.e. letting photon index and nor-malization vary) to the 3-10 keV band of the 50 ks Suzaku obser-vation and the 50 ks of the NuSTAR obserobser-vation that was taken concurrently. While the unblurred reflection is a good fit to the NuSTAR data, the higher resolution Suzaku spectrum is not well fit. The ionized reflection model has a narrow core of the iron line that is not seen in the higher resolution Suzaku spectrum. This motivates the need for additional spectral complexities beyond a simple ionised reflection model, even though it is not required by the NuSTAR data alone (see Fig.5).
trum, the Suzaku spectrum, which contains a similar num-ber of counts in the iron K band, has clear residuals (Suzaku has higher spectral resolution; 150 eV at 6 keV compared to 400 eV at 6 keV of NuSTAR). The model contains a narrow peak at 6–7 keV that is not present in the data. We take this as evidence of further complexities in the iron line band.
Based on this evidence, we attempt to fit the entire spectrum from 1–50 keV with a relxilllp model in order to further broaden the iron line. This results in a fairly good fit ( χ2/d.o.f = 1299/1237 = 1.05). In order to fit the soft
ex-cess with the same relativistic reflection model as the iron line and Compton hump, the ionization parameter has de-creased, and the iron abundance is pegged to its maximal value of 10 times solar value. Also, the black hole spin is required to be at its maximal value, and the coronal height is required to be very small. This suggests that the extreme relativistic parameters are driven by the soft excess and not by the iron line or Compton hump.
We find significant improvement by including an ad-ditional Bremsstrahlung component that contributes to the soft excess (see Column 3 of Table1. This leads to a ∆ χ2
= 51 for 2 additional degrees of freedom. The Bremsstrahlung component is largely phenomenological, though for a rel-atively low mass black at high accretion rate the disk is expected to be much denser than the standard assumption of ne = 1015 cm−3 (see Fig. 1 of Garc´ıa et al. 2016). Re-cently, these authors showed that higher density discs (e.g. ne= 1018 cm−3) could lead to a significant increase in the free-free emission (by a factor of ∼ 5 − 10). Qualitatively similar results are found if we use an additional Comptoni-sation component (e.g. CompTT;Titarchuk 1994) in lieu of the Bremsstrahlung component (similar toDewangan et al. 2007), which could be understood as the effect of bulk Comp-tonization due to turbulence in radiation pressure dominated
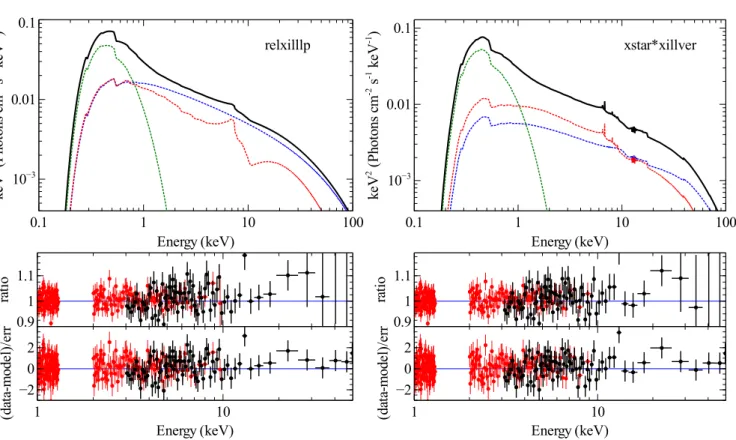
relxilllp k eV 2 ( P h o to n s cm -2 s -1 k eV -1 ) 10−3 0.01 0.1 Energy (keV) 0.1 1 10 100 ra ti o 0.9 1 1.1 (d at a-m o d el )/ er r −2 0 2 Energy (keV) 1 10 ra ti o 0.9 1 1.1 (d at a-m o d el )/ er r −2 0 2 Energy (keV) 1 10 xstar*xillver k eV 2 ( P h o to n s cm -2 s -1 k eV -1 ) 10−3 0.01 0.1 Energy (keV) 0.1 1 10 100
Figure 8. Left: The best-fit (relxilllp and Bremsstrahlung model fit to the simultaneous Suzaku and NuSTAR (50 ks exposure) observations; χ2/d.o.f = 1248/1235 = 1.01). Below are the ratio of the data to the model and the ∆χ2. Right: Same, but for the best-fit
model of xillver and Bremsstrahlung components through an ionised outflow (χ2/d.o.f = 1246/1234 = 1.01). See the last two columns of
Table1for parameters.
accretion flows (Kaufman et al. 2017). The blurred reflection and Bremsstrahlung model fit to the Suzaku and NuSTAR spectra can be seen in Fig.8-left. One can see that only very modest relativsitic blurring is required, and near solar iron abundances provide very good fits.
Alternatively, the Suzaku and NuSTAR spectra can be equally well described by the ionised reflection and a Bremsstrahlung component through an ionised outflowing wind. We use a photoionization table derived using the XSTAR code version 2.2.1bn (Kallman & Bautista 2001). We consider a Γ = 2 power-law continuum and standard Solar abundances. We tested different broadenings due to turbulent velocities of 5,000 km s−1, 10,000 km s−1, and
30,000 km s−1. The latter is providing the best-fit and it is consistent with the large width observed for the absorp-tion feature. This table is equivalent to the one used in
Tombesi et al. (2015). We show the results of this fit in
Fig. 8, and in Column 4 of Table 1. This model also only
requires solar iron abundance and a low cut-off energy.
The definitive results from our spectral fitting are that the reflection is very highly ionised for an AGN and that the coronal electron temperature is amongst the lowest yet observed. Deeper observations are required to distinguish between relativistically blurred reflection and ionised reflec-tion through a fast, outflowing wind. Of course, the solureflec-tion could also be some combination of the two.
4 DISCUSSION
Ark 564 is one of the most well-studied AGN in the X-ray band because it demonstrates the extremes of black hole accretion. Namely, it is one of the brightest AGN in soft X-rays, and is highly variable. It has a steeper spectrum than most Seyfert galaxies and a strong soft excess. In this paper, we have presented the first NuSTAR observations of this well-known object. In summary, our results are:
(i) These NuSTAR observations show the best view of the iron K complex in Ark 564, and reveal a higher equivalent width line than had been seen in previous, (potentially piled-up) XMM-Newton observations.
(ii) The feature above the iron line (due to a combination of the iron K edge and photoelectric absorption smeared by Compton scattering in the hot upper layers of the disc) is seen up to ∼ 11 keV. This is higher than other AGN observed with NuSTAR, and is similar to the profiles seen in black hole binaries, where the ionisation is typically larger.
(iii) The NuSTAR data are well described with a simple ionised reflection model with a high ionisation parameter, and do not require additional relativistic broadening or ad-ditional absorption from an ionised wind (though both of these models are adequate descriptions of the data).
(iv) Whether pure reflection or reflection plus absorption and regardless of a cut-off powerlaw continuum or a Comp-tonisation continuum, all of the attempted model fits de-scribed above require that the electron temperature of the corona is ∼ 15 keV. This is one of the coolest temperature coronae measured to date.
(v) These NuSTAR data show the canonical hard lag as shown by the Fourier analysis and seen by eye in the data due to the fortuitous observation of a flare seen by both Suzakuand NuSTAR. This further suggests that we are see-ing some direct emission from the continuum (rather than a highly obscured source).
In this section, we discuss the discovery a very low-temperature corona in Ark 564 in the context of previous studies of Ark 564 that suggest it is accreting at close to the Eddington limit and that it is an analog to a black hole binary in the luminous hard state.
4.1 Low-temperature coronae in high-Eddington accretors
In 2001 there was a large multiwavelength campaign of Ark 564 with XMM-Newton, Chandra, ASCA, Hubble and FUSE, which resulted in a broadband, simultaneous Spectral Energy Distribution (Romano et al. 2004). These authors find that the peak of the SED is in the Extreme UV/Soft X-rays and that Ark 564 has an intrinsic luminosity close to the Eddington limit. This is consistent with the results from this analysis: The average 2-10 keV luminosity over the entire observation (as derived from the best fit xillver model fit to the NuSTAR and Suzaku data) is 3.9×1043erg/s.
Therefore, L/LEdd= 1.1, assuming a bolometric correction of 9.2 ± 4.5(from SED fitting;Vasudevan & Fabian 2007) and a black hole mass of log(M/M⊙) = 6.4 ± 0.5 (Zhang & Wang
2006). This high-Eddington luminosity is not completely surprising, as it has been suggested that NLS1s harbor low-mass black holes accreting at the Eddington limit (e.g. Boroson & Green 1992).
Pounds et al.(1995) suggested that the steep spectrum
in another NLS1 RE J1034+39 could be explained in the context of super-Eddington accretion. In this model the hard X-ray component had such a steep spectrum because the strong radiation field from the super-Eddington disc is cool-ing the corona more than in other sub-Eddcool-ington Seyferts. In such a scenario, in addition to a steeper spectrum, we also expect a lower temperature corona (or a lower cut-off energy), which is what we see in Ark 564.
Alternatively,Laor & Davis (2014) describe a scenario (similar toProga 2005) in which UV line driven winds are launched in higher Eddington sources, causing an effective disc truncation radius that increases with Eddington ratio. They use this physical model to explain the observed con-stant 1000˚A turnover in AGN SEDs that is very weakly de-pendent on mass (in tension with standard thin-disc solu-tions).Laor & Davis(2014) suggest that the hot inner flow within the disc truncation radius could be Compton cooled, thus producing the observed hard X-ray emission. Within this framework, higher Eddington sources would be cooled by relatively cooler seed photons, thus producing the lower temperature cut-off that is observed. This result is consis-tent with our reflection fitting results for Ark 564, where only weak relativistic blurring is required, but could be in tension with observations of other NLS1s (e.g. 1H0707-495, IRAS 13224-3809), where extreme relativistic broadening is observed.
4.2 Ark 564 as an analogue of the luminous-hard state in BHB
Ark 564 is one of the brightest and most rapidly variable soft ray emitters, and therefore has been subject of many X-ray timing studies. The source was observed for several years with RXTE, ASCA and on short timescales with XMM-Newton, which allowed McHardy et al. (2007) to perform power spectral density analysis over many decades in tem-poral frequency. The authors find that Ark 564 does not behave like any other Seyfert galaxy for which such long campaigns have been carried out. Most sources show a high frequency PSD slope of α ∼ −2, and a low-frequency slope of α ∼ −1 down to very low frequencies, which is reminiscent of the PSD of black hole binaries in the thermal-dominated state. Ark 564, however, shows a second low-frequency break and a slope of α ∼ 0 at the lowest frequencies, very similar to BHB PSDs in all other states apart from the thermal-dominated state. Given the observed high-Eddington nature of this source, the authors suggest that Ark 564 is an AGN akin to the luminous hard state in BHBs.
The hard X-ray spectral results presented in this pa-per are consistent with the interpretation that Ark 564 is in the luminous hard state. We compare our spectral results with those of Garc´ıa et al. (2015) using RXTE spectra of the BHB GX 339-4 in the hard state during an outburst. These authors find that as the source goes into outburst the temperature of the corona decreases by an order of magni-tude. They also find that the ionization parameter in the reflection models is largest as the source hits its peak lu-minosity. These two correlations are consistent with our re-sults of Ark 564 compared to other Seyferts observed with NuSTAR. The electron temperature of the corona is lower by a factor of two or more, and the ionization parameter is amongst the highest as well. This further supports the analogy between Ark 564 and black hole binaries in their luminous hard states.
While the spectral evidence found in this paper cor-roborates the temporal results of McHardy et al. (2007) in suggesting that Ark 564 is an analogy to a black hole binary in its luminous hard state, we do emphasize that there are clear differences between AGN and BHB that may break the one-to-one link between the two mass regimes. For example, it has long been understood that AGN discs are more radiation pressure dominated than those in BHBs (Shakura & Sunyaev 1973), and, as discussed above, UV line driven winds can be important in cooler AGN discs, which can affect the AGN disc structure.
4.3 Implications for coronal parameters
Recently,Fabian et al.(2015) compiled a sample of all the high-energy cut-offs observed with NuSTAR and populated these sources on the compactness-temperature (ℓ − Θ) plane, where Θ = kTe/mec2is the coronal electron temperature
nor-malized by the electron rest energy and ℓ = (L/R)(σT/mec3)
is the dimensionless compactness parameter (Guilbert et al.
1983). Fabian et al. (2015) defined L as the luminosity of
the powerlaw component from 0.1–200 keV and R as the radius of the corona estimated by X-ray reverberation esti-mates, where available, or simply assumed to be 10rg, where
Theoretical constraints limit the allowed parameter space on the ℓ − Θ plane, the most important of which is the pair-production limit. In compact and high-temperature coronae, electrons lose a significant fraction of their energy to photons, which can become so energetic that photon-photon collisions produce electron-positron pairs (i.e. when the product of the photon energies exceeds 2 (in units of mec2). Thus any additional energy input will lead to an
in-creased number of pairs, but does not increase the source temperature. Nearly all sources observed up to that point by NuSTAR lay just below the pair-production limit for thermal Comptonisation, suggesting that these coronae are pair-dominated plasmas.
We compare our results of Ark 564 with the results of
Fabian et al. (2015). Our modelling of the spectrum with
nthcomp irradiating an ionized accretion disc, found an electron temperature of 15 keV (or Θ = 0.03). Following
Fabian et al.(2015), we measure the luminosity of the
pow-erlaw component from 0.1–200 keV to be 1.1 × 1044 erg/s.
Ark 564 does have a reverberation lag measurement, and so we use the height of the corona constrained by modelling the reverberation lags to estimate the radius of a spheri-cal corona (R = 4.6 rg;Emmanoulopoulos et al. 2014). This
leads to a compactness of ℓ = 1140. Ark 564 lays well below the thermal pair-production limit (see Fig. 2 ofFabian et al. 2015), and thus, assuming a thermal Comptonisation model, we find that the corona in this source is not a pair-dominated plasma, but rather is mostly normal matter.
However, recently,Fabian et al.(2017) re-examined the case of hybrid coronae (Zdziarski et al. 1993), where the plasma contains both thermal and non-thermal particles, as might be expected for a highly magnetized corona powered by the dissipation of magnetic energy. In such a compact, highly magnetized corona, heating and cooling are so intense that the electrons might not have time to thermalize before inverse Compton cooling. If a small fraction of electrons follow a non-thermal distribution that exceeds MeV tem-peratures, this can cause run-away pair production. Cooled pairs could share their available energy, thus reducing the mean energy per particle and reducing the temperature of the thermal population. So unless we have the sensitivity to probe the hard non-thermal tail of the electron distribution, a low cut-off energy could either be interpreted as a thermal plasma that is not pair dominated or as a pair-dominated hybrid plasma. Further deep hard X-ray observations are required to distinguish these two scenarios.
Ark 564 lays definitively below the thermal pair produc-tion limit and very close to the limit where electron-electron coupling timescale is equal to the timescale for Compton cooling. Indeed the only sources from Fabian et al. (2015) in that part of the parameter space are two black hole bina-ries, GRS 1915+105 (Miller et al. 2013) and GRS 1739-278
Miller et al.(2015), observed during the luminous phases of
their low/hard states. This is consistent with the idea that Ark 564 is an AGN analogue to the luminous hard state in black hole binaries.
5 CONCLUSIONS
We have presented the analysis of the new NuSTAR obser-vation of the steep spectrum Narrow-Line Seyfert 1 galaxy
Ark 564. This source is an order of magnitude brighter than other steep spectrum NLS1s measured by NuSTAR, which has allowed for the first determination of the cut-off energy in these types of sources. We find a very low temperature of 15 ± 2 keV, amongst the lowest measured by NuSTAR of any Seyfert galaxy. Steep spectrum NLS1s are thought to be accreting at close to the Eddington limit, and so further observations of Comptonisation at these most extreme lim-its are important for understanding the connection between the accretion disc and its corona.
ACKNOWLEDGEMENTS
EK thanks Julian Malzac, Pierre-Olivier Petrucci, Andrea Marinucci and the participants of the FERO8 meeting in Moravia, Czech Republic for interesting discussions on ac-cretion disc coronae. EK thanks the NuSTAR GO Program for support under grant NNX15AV26G. EK thanks the Hub-ble Fellowship Program. Support for Program number HST-HF2-51360.001-A was provided by NASA through a Hub-ble Fellowship grant from the Space Telescope Science In-stitute, which is operated by the Association of Universi-ties for Research in Astronomy, Incorporated, under NASA contract NAS5-26555. ACF acknowledges ERC Advanced Grant 340442. CSR thanks support from NASA under grant NNX17AF29G.
REFERENCES
Ar´evalo P., Uttley P., 2006, Monthly Notices of the RAS,367, 801 Ar´evalo P., Papadakis I. E., Uttley P., McHardy I. M., Brinkmann
W., 2006, Monthly Notices of the RAS,372, 401 Balokovi´c M., et al., 2014, Astrophysical Journal,794, 111 Boroson T. A., Green R. F., 1992, Astrophysical Journal
Supple-ments,80, 109
Brandt W. N., Mathur S., Elvis M., 1997, Monthly Notices of the RAS,285, L25
Brenneman L. W., et al., 2014, Astrophysical Journal,788, 61 Czerny B., Niko lajuk M., R´o˙za´nska A., Dumont A.-M., Loska Z.,
Zycki P. T., 2003, Astronomy and Astrophysics,412, 317 De Marco B., Ponti G., Cappi M., Dadina M., Uttley P., Cackett
E. M., Fabian A. C., Miniutti G., 2013, Monthly Notices of the RAS,431, 2441
Dewangan G. C., Griffiths R. E., Dasgupta S., Rao A. R., 2007, ApJ,671, 1284
Done C., Sobolewska M. A., Gierli´nski M., Schurch N. J., 2007, Monthly Notices of the RAS,374, L15
Emmanoulopoulos D., Papadakis I. E., Dovˇciak M., McHardy I. M., 2014, Monthly Notices of the RAS,439, 3931
Fabian A. C., Rees M. J., Stella L., White N. E., 1989, Monthly Notices of the RAS,238, 729
Fabian A. C., et al., 2009, Nature,459, 540
Fabian A. C., Parker M. L., Wilkins D. R., Miller J. M., Kara E., Reynolds C. S., Dauser T., 2014, Monthly Notices of the RAS,439, 2307
Fabian A. C., Lohfink A., Kara E., Parker M. L., Vasudevan R., Reynolds C. S., 2015, Monthly Notices of the RAS,451, 4375 Fabian A. C., Lohfink A., Belmont R., Malzac J., Coppi P., 2017,
preprint, (arXiv:1701.06774)
Garc´ıa J., Dauser T., Reynolds C. S., Kallman T. R., McClintock J. E., Wilms J., Eikmann W., 2013, Astrophysical Journal, 768, 146
Garc´ıa J. A., Steiner J. F., McClintock J. E., Remillard R. A., Grinberg V., Dauser T., 2015, Astrophysical Journal,813, 84
Garc´ıa J. A., Fabian A. C., Kallman T. R., Dauser T., Parker M. L., McClintock J. E., Steiner J. F., Wilms J., 2016, Monthly Notices of the RAS,462, 751
Gierli´nski M., Done C., 2004, Monthly Notices of the RAS, 349, L7
Giustini M., Turner T. J., Reeves J. N., Miller L., Legg E., Krae-mer S. B., George I. M., 2015, Astronomy and Astrophysics, 577, A8
Guilbert P. W., Fabian A. C., Rees M. J., 1983, Monthly Notices of the RAS,205, 593
Haardt F., Maraschi L., 1993, Astrophysical Journal,413, 507 Harrison F. A., et al., 2013, Astrophysical Journal,770, 103 Kalberla P. M. W., Burton W. B., Hartmann D., Arnal E. M.,
Bajaja E., Morras R., P¨oppel W. G. L., 2005, Astronomy and Astrophysics,440, 775
Kallman T., Bautista M., 2001, Astrophysical Journal Supple-ments,133, 221
Kara E., Fabian A. C., Cackett E. M., Uttley P., Wilkins D. R., Zoghbi A., 2013, Monthly Notices of the RAS,434, 1129 Kara E., et al., 2015a, Monthly Notices of the RAS,446, 737 Kara E., et al., 2015b, Monthly Notices of the RAS,449, 234 Kara E., Alston W. N., Fabian A. C., Cackett E. M., Uttley P.,
Reynolds C. S., Zoghbi A., 2016, Monthly Notices of the RAS, 462, 511
Kaufman J., Blaes O. M., Hirose S., 2017, Monthly Notices of the RAS,
Khanna S., Kaastra J. S., Mehdipour M., 2016, Astronomy and Astrophysics,586, A2
Kotov O., Churazov E., Gilfanov M., 2001, Monthly Notices of the RAS,327, 799
Laha S., Guainazzi M., Dewangan G. C., Chakravorty S., Kemb-havi A. K., 2014, Monthly Notices of the RAS,441, 2613 Laor A., Davis S. W., 2014, Monthly Notices of the RAS,
438, 3024
Legg E., Miller L., Turner T. J., Giustini M., Reeves J. N., Krae-mer S. B., 2012, Astrophysical Journal,760, 73
Lohfink A. M., et al., 2016, Astrophysical Journal,821, 11 Marinucci A., et al., 2014, Astrophysical Journal,787, 83 Marinucci A., Tortosa A., NuSTAR AGN Physics Working Group
2016, Astronomische Nachrichten,337, 490
Markowitz A., et al., 2003, Astrophysocal Journal,593, 96 McHardy I. M., Ar´evalo P., Uttley P., Papadakis I. E., Summons
D. P., Brinkmann W., Page M. J., 2007, Monthly Notices of the RAS,382, 985
Miller L., Turner T. J., Reeves J. N., Braito V., 2010, Monthly Notices of the RAS,408, 1928
Miller J. M., et al., 2013, Astrophysical Journal Letters,775, L45 Miller J. M., et al., 2015, Astrophysical Journal Letters,799, L6 Mizumoto M., Ebisawa K., Sameshima H., 2014, Publications of
the ASJ,66, 122
Osterbrock D. E., Pogge R. W., 1985, Astrophysical Journal, 297, 166
Papadakis I. E., Brinkmann W., Page M. J., McHardy I., Uttley P., 2007, Astronomy and Astrophysics,461, 931
Parker M. L., et al., 2014, Monthly Notices of the RAS,443, 1723 Parker M. L., et al., 2015, Astrophysical Journal,808, 9 Pounds K. A., Done C., Osborne J. P., 1995, Monthly Notices of
the RAS,277, L5
Proga D., 2005, Astrophysical Journal Letters,630, L9 Risaliti G., et al., 2013, Nature,494, 449
Romano P., et al., 2004, Astrophysical Journal,602, 635 Shakura N. I., Sunyaev R. A., 1973, Astronomy and Astrophysics,
24, 337
Svensson R., 1982, Astrophysical Journal,258, 335 Titarchuk L., 1994, Astrophysical Journal,434, 570
Tombesi F., Cappi M., Reeves J. N., Palumbo G. G. C., Yaqoob T., Braito V., Dadina M., 2010, A&A,521, A57
Tombesi F., Mel´endez M., Veilleux S., Reeves J. N., Gonz´ alez-Alfonso E., Reynolds C. S., 2015, Nature,519, 436
Tortosa A., et al., 2016, preprint, (arXiv:1612.05871)
Uttley P., McHardy I. M., Papadakis I. E., 2002, Monthly Notices of the RAS,332, 231
Vasudevan R. V., Fabian A. C., 2007, Monthly Notices of the RAS,381, 1235
Walton D. J., Nardini E., Fabian A. C., Gallo L. C., Reis R. C., 2013, Monthly Notices of the RAS,428, 2901
Wilkins D. R., Gallo L. C., Grupe D., Bonson K., Komossa S., Fabian A. C., 2015, Monthly Notices of the RAS,454, 4440 Zdziarski A. A., Lightman A. P., Maciolek-Niedzwiecki A., 1993,
Astrophysical Journal Letters,414, L93
Zdziarski A. A., Fabian A. C., Nandra K., Celotti A., Rees M. J., Done C., Coppi P. S., Madejski G. M., 1994, Monthly Notices of the RAS,269, L55
Zdziarski A. A., Johnson W. N., Magdziarz P., 1996, Monthly Notices of the RAS,283, 193
Zhang E.-P., Wang J.-M., 2006, Astrophysical Journal,653, 137 Zoghbi A., Fabian A. C., Uttley P., Miniutti G., Gallo L. C.,
Reynolds C. S., Miller J. M., Ponti G., 2010, Monthly Notices of the RAS,401, 2419
Zoghbi A., Fabian A. C., Reynolds C. S., Cackett E. M., 2012, Monthly Notices of the RAS,422, 129
Zoghbi A., Reynolds C., Cackett E. M., Miniutti G., Kara E., Fabian A. C., 2013a, Astrophysical Journal,767, 121 Zoghbi A., Reynolds C., Cackett E. M., 2013b, Astrophysical
Journal,777, 24
Zoghbi A., et al., 2014, Astrophysical Journal,789, 56
˙Zycki P. T., Done C., Smith D. A., 1999, Monthly Notices of the RAS,309, 561