p-ISSN 2300-1240 2018, volume 7, issue 2
Date of submission: August 1, 2018; date of acceptance: September 21, 2018. * Contact information: [email protected], University of Macerata, Department of Economics and Law, via Armaroli n. 43, 62100 Macerata, Italy, phone: +39 0733 2583242; ORCID ID: https://orcid.org/0000-0003-0773-5950.
** Contact information: [email protected], University of Macerata, De-partment of Economics and Law, via Armaroli n. 43, 62100 Macerata, Italy, phone: +39 0733 2583231; ORCID ID: https://orcid.org/0000-0002-7558-3795.
*** Contact information: [email protected], University of Macerata, De-partment of Economics and Law, via Armaroli n. 43, 62100 Macerata, Italy, phone: +39 0733 2583238; ORCID ID: https://orcid.org/0000-0002-3303-2725.
Bartolacci, F., Soverchia, M., & Zigiotti, E. (2018). Managing solid urban waste in Italy: an econom-ic, financial, and environmental performance analysis. Copernican Journal of Finance & Account-ing, 7(2), 9–28. http://dx.doi.org/10.12775/CJFA.2018.006
F
rancescaB
artolacci* University of MacerataM
ichelas
overchia** University of Maceratae
rMannoZ
igiotti*** University of MacerataManaging solid urBan waste in italy
:
an econoMic,
Financial,
and environMentalperForMance analysis
Keywords: waste management, separate waste collection, performance analysis, Italy. J E L Classification: M21, Q53, Q56.
Abstract: The present article focuses on Italian solid urban waste management compa-nies in the aim of ascertaining whether the best practices in this field, and specifically regarding separated waste collection (paper, plastic, glass, organic compostable, and
non-recyclable waste), are sufficiently widespread as per European Union directives relative to the circular economy. In addition to this analysis, the paper also evaluates the financial performance of a companies’ group which should operate economically to guarantee continuity of management and provision of services to the community at large. The analysis concerns companies operating in approximately 900 municipalities located throughout the Italian territory. The results show a quite variegated situation, in which the northern regions appear to represent the macro-area where the most ef-ficient firms operate, realizing the highest level of separated waste collection despite having the lowest unitary revenues, both per ton collected and per inhabitant served.
Introduction
The European Commission (EC) has adopted an ambitious package for the cir-cular economy which affects the entire lifecycle of products (European Com-mission, 2015; European Parliament, 2017). This encompasses the earliest phases of design, in which the necessary resources to be procured are identi-fied, and continues through the transformation processes of the materials, and therefore, includes the waste that are potentially generated during the entire process of production, distribution, and consumption.
An important part of the circular economy ‘circle’ regards waste manage-ment which should follow the ‘hierarchical principle’, that establishes an order of priority. Preventing negative environmental impacts caused by waste rep-resents the first step, followed by preparing materials to be re-used, recycling, energy recovery, and finally, disposal. The EC package considers landfill as the last step in solid urban waste (UW) disposal that must be limited both quan-titatively and qualitatively (Gharfalkar, Court, Campbell, Ali & Hillier, 2015, p. 305; Tisserant, Pauliuk, Merciai, Schmidt, Fry, Wood & Tukker, 2017, p. 628; Cossu & Williams, 2015, p. 1; Velenturf & Purnell, 2017, p. 1).
All of these conditions should serve as guidelines for the management choices made by waste management companies, which take the responsibil-ity for providing the local public services from collection to disposal of UW. This becomes particularly significant when taking into consideration the criti-cal conditions under which these companies operate. UW collection, treatment and disposal are usually very costly activities (Koushki, Al-Duaij & Al-Ghim-las, 2004, p. 957; Greco, Allegrini, Del Lungo, Gori Savellini & Gabellini, 2015, p. 364), because they usually require high investments in terms of plants and machineries, and huge operating costs for personnel, services, vehicles’ depre-ciation. Moreover, among the various forms of waste collection, study findings confirm that separated waste collection (SC) represents the most expensive
option for waste management companies (Koushki Parviz, Al-Duaij & Al-Ghim-las, 2004, pp. 959–960).
In light of these premises, this paper focuses on UW management compa-nies which should match environmental and financial sustainability (Bartolac-ci, Paolini, Quaranta & Soverchia, 2018, p. 129; Horváthová, 2012, p. 91; Lohri, Camenzind & Zurbrügg, 2014, p. 542; Nishitania, Jannah, Kaneko & Hardinsyah, 2017, p. 10; Qi, Zeng, Shi, Meng, Lin & Yang, 2014, p. 349; Song, Zhao & Zeng, 2017, p. 1051). In particular, the research objective consists of determining, through an exploratory analysis, whether the best practices for waste man-agement – in terms of SC – are sufficiently widespread in Italy to meet the con-ditions outlined in the EC circular economy package. In addition, the econom-ic-financial performance of the companies’ group is evaluated to determine whether it is such as to guarantee the continuity of management and ensure the provision of the service to the community.
To reach our research objective we have also focused on certain aspects that can affect company performance, such as geographical location and/or the availability of waste treatment and disposal plants; the latter could be indica-tive of a degree of diversification of waste management activities.
The waste management sector in Italy
The services connected to waste management processes (collection, transpor-tation, and treatment) are considered public utilities. In fact, Italian legislation requires municipalities to carry them out, precisely because of their social, en-vironmental and economic relevance (Bognetti & Robotti, 2003, p. 117). In par-ticular, municipalities can manage these services either directly or outsource them to companies (often owned by the same municipalities); to date, this last option is the most common in Italy (Italian Competition Authority, 2016). Occa-sionally, such of them are multi-utility companies, providing various services (i.e. electricity, water, pharmacies) in addition to waste collection, transporta-tion and treatment.
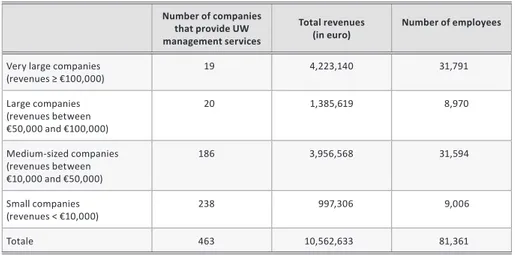
Recent studies have highlighted that the Italian waste management sector includes 463 companies, of which 71% are mono-utilities and the remainder are multi-utilities (Utilitatis, 2016, p. 27). In this rather fragmented and low-competition sector (Citroni, Lippi & Profeti, 2016, p. 2; Italian Competition Au-thority, 2016), the providers are predominantly small and medium-sized com-panies (see table 1); they supply waste collection services to approximately
8,000 Italian municipalities that are extremely diverse in terms of the geo-mor-phological characteristics, the population density, etc.
Table 1. Italian companies that operate in the waste management sector in 2013
Number of companies that provide UW management services
Total revenues
(in euro) Number of employees
Very large companies
(revenues ≥ €100,000) 19 4,223,140 31,791 Large companies (revenues between €50,000 and €100,000) 20 1,385,619 8,970 Medium-sized companies (revenues between €10,000 and €50,000) 186 3,956,568 31,594 Small companies (revenues < €10,000) 238 997,306 9,006 Totale 463 10,562,633 81,361 S o u r c e : Utilitatis, 2016.
Regardless of the private or public nature of the companies, they must strive for a satisfactory and lasting economic and financial sustainability, in order to be able to provide indispensable services over the long term. As well known, the economic and financial performance of companies must be moni-tored, even in cases of public entities, because an organization’s financial bal-ance is a pre-requisite for its business viability (Macpherson, 2001, p. 13; Sar-giacomo, 2013, pp. 20–21). This is why it is important to implement a corporate control system that is both integrated and multidimensional, and that takes into account the specificities of the performance of the companies in question. Their multidimensionality must include the efficiency of the internal processes and the operational effectiveness, as well as the quality of the services provid-ed because of the neprovid-ed to evaluate the social impacts and, more generally, the performance outcomes which, in this case, assume environmental significance (Pollit & Bouckaert, 2011, pp. 7–8). In other words, satisfactory economic and financial performance levels do not necessarily coincide with equally satisfac-tory levels of services provided and of outcomes, measured in terms of environ-mental protection and safeguarding, for example.
The research methodology and the course of the research process
In order to achieve the objective outlined above, an empirical study referred to the four-year period 2012–2015 was conducted on a group of 52 Italian me-dium-sized companies, constituting a fairly homogeneous group of firms that could be compared. They were mostly operating in the field of UW collection, transport, treatment and disposal in approximately 900 municipalities in Italy. The pertinent financial information was obtained from financial state-ments, the waste collection data was taken from the ISPRA (Higher Institute for Environmental Prevention and Research) database, and the information on population served and on territorial characteristics (extension and population density) was available from the ISTAT (National Statistics Institute) database.
The set of companies analyzed is fairly representative, considering the 900 municipalities served (about 10% of all Italian municipalities) and the ten million or more citizens who are provided with these services over an area of over 30,000 sq. km. As regards the three geographical macro-areas, the highest percentages are found in the North, in terms of number of mu-nicipalities and territorial extension (65% and 47%, respectively, according to 2015 data), whereas the percentage of the population served is greatest in the South and on the Islands (40%) because of greater population density in this macro-area1.
As for the size of the 52 companies in the group, the average annual rev-enues, which appears in item A.1 of the Income Statement (Conto economico, in Italian), amounts to €23,610,009 in the North, 41,187,692 in the Center, and 25,420,363 in the South and Islands. When we take out the data for the two out-lier municipalities (Florence in the Center and Naples in the South), which are considerably larger than the other 50 companies in the group, the average an-nual revenues amounts to €28,814,176 in the central part and €17,467,114 in the southern part of the country. In the companies’ group, the average number
1 These observations obviously refer to the group of companies and, therefore, to the group of municipalities analyzed in this study; some of more densely populated mu-nicipalities in the North are served by listed companies and are, therefore, not part of this analysis, for the reasons concerning the size homogeneity, mentioned above.
of employees is 158 for the North, 259 for the Center (166, adjusting for Flor-ence), and 337 for the South (252, adjusting for Naples)2.
In light of the above mentioned, the performance of the 52 companies was measured in each of the four years under analysis (2012–2015). The findings were reclassified by geographical macro-area and by the presence/absence of at least one waste treatment and disposal plant. In particular, according to the first classification, the group consists of 20 companies in the North, 11 in the Center, and 21 in the South. As for the presence/absence of a plant, the classifi-cation consists respectively of 28 and 24 companies.
Empirical findings
1. Economic and financial performance
To investigate the economic and financial performance of the analyzed companies, specific indicators were calculated using their financial statements data; those are ratios used in literature and among practitioners as bench-marks to assess the following three areas of performance: (i) profitability; (ii) productivity-efficiency; (iii) financial-equity profile.
To evaluate the profitability, the company’s ROI and ROE were utilized. The first indicator measures the Return On Investment, by relating Operating in-come (or Ebit Earnings before interests and taxes) to the Total assets. The second indicator measures the Return On Equity, by relating Net income (the bottom line of the Income Statement) to the Net equity. The literature often suggests using these ratios to assess the economic and financial performance in relation to environmental practices at the firm level (Hart & Ahuja, 1996, p. 30; Judge & Douglas, 1998, p. 241; Khanna & Damon, 1999, p. 1; Rubio-Rome-ro, Arjona-Jiménez & López-Arquillosa, 2013, p. 84).
As concerns the ROI, it is worth noting that in the calculation of the posi-tive component of the indicator only the principal revenues indicated in A.1 of the Income Statement were taken into account, whereas “Other revenues” list-ed in A.5, deriving for the most part from activities not directly relatlist-ed to the core business, were expunged. This method of calculation actually penalizes 2 These numbers are considerably higher than those for the entire country, as re-corded by Istat 2012 (published in Italian Competition Authority, 2016, 80) which show an average annual revenues of € 5.3 mil and 48 employees.
the analysis because, by utilizing such restrictive parameters, it ignores some of the revenues which are nevertheless relevant, in a wide sense, to the ordi-nary management of the company. Therefore, a rectified version of the Return on Investment (ROI Adjusted) was calculated that also included, among compa-ny revenues, those listed under item A.5 of the Income Statement.
To measure productivity and efficiency, according to the literature, two in-dicators were calculated (Listowski, Ngo & Guo, 2013, p. 67). The first one (Rev-enues per employee) provides a dimensional measurement of the company as well as of the employees productivity, strictly referred to the revenues deriving from the core business, as the numerator represents only the revenues listed in A.1 of the Income Statement. The second one (Production costs/Production value) measures the core business efficiency, which will increase with the re-duction of the costs’ impact on the Prore-duction value.
Finally, in order to assess the financial-equity profile of the companies, two indicators were calculated. These are useful to establish the consistency of the company’s net equity and its financial stability (Higgins, 2012, p. 8).
The first indicator (Net equity/Total assets) shows the proportion of invest-ments (or Total assets) covered by the equity brought in by the shareholders; hence, the residual portion of the investments is financed by debts of varied na-ture (financial, commercial, etc.). It follows that, the higher is the incidence of Net equity on Total assets, the better capitalized and, therefore, more balanced the company will appear, in terms of its financial-equity profile. Indirectly, this indicator provides information on the relationship between Debts and Net eq-uity (Debt/Net eqeq-uity); it is used as a benchmark for evaluate the degree of in-debtedness of a company and, therefore, the risk to financers and the compa-ny’s creditworthiness.
The second indicator (Net debt of liquidity/Ebitda) measures the compa-ny’s ability to repay its financial and operating debt, with the financial resourc-es generated by the current management. The ratio exprresourc-essresourc-es the number of years that the ordinary financial flow (i.e., Ebitda Earnings before interests, taxes, depreciation, and amortization) would take to repay the company’s en-tire debt, assuming the trend for the coming years is implicitly constant. The lower the quotient, the better the pay-back capability and, therefore, the finan-cial profile of the company, will appear to creditors3.
3 The indicator could become negative, either because of the numerator (debts in-ferior to company liquidity) or the denominator (negative Ebitda). Because they are
1.1. Profitability performance
By calculating the profitability performance per geographical macro-area, the following results were obtained:
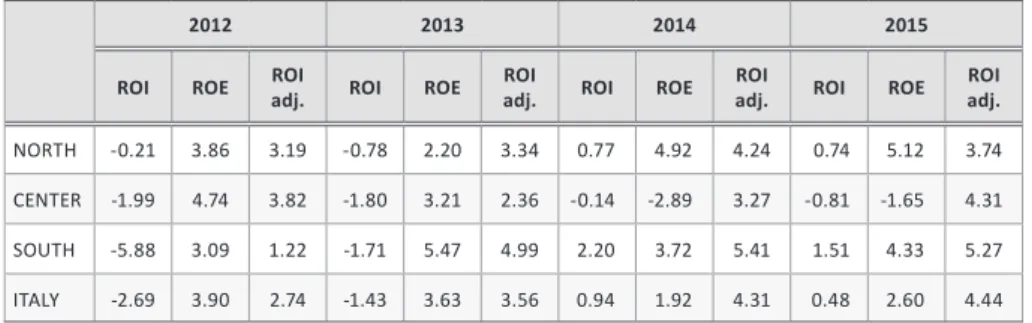
Table 2. Annual profitability indicator averages
per geographical macro-areas (in %)
2012 2013 2014 2015
ROI ROE ROI adj. ROI ROE ROI adj. ROI ROE ROI adj. ROI ROE ROI adj.
NORTH -0.21 3.86 3.19 -0.78 2.20 3.34 0.77 4.92 4.24 0.74 5.12 3.74
CENTER -1.99 4.74 3.82 -1.80 3.21 2.36 -0.14 -2.89 3.27 -0.81 -1.65 4.31
SOUTH -5.88 3.09 1.22 -1.71 5.47 4.99 2.20 3.72 5.41 1.51 4.33 5.27
ITALY -2.69 3.90 2.74 -1.43 3.63 3.56 0.94 1.92 4.31 0.48 2.60 4.44
Outliers ROE: Legnano (North); Benevento, Nuoro, and Trani (South). S o u r c e : own study.
Overall, the ROI values in the four-year period for all of the companies re-veal an unsatisfactory performance in terms of profitability that is sometimes negative (see the entire four years in Central Italy).
The situation looks decidedly different if attention is shifted to ROI adjust-ed, which shows positive values for all of the geographical macro-areas and a national rising trend over the four-year period. This bears witness to what was mentioned above in terms of the weight of Other Revenues (extraneous to the core business) in guaranteeing balanced profitability.
What is less easily interpreted is the ROE trend, impacted by the company’s financial management (in many cases, interests play a significant role), as well as the extraordinary revenues/costs and taxes. The North shows a consistently positive and growing trend over the four-year period (excluding the one outlier from the average); the South is also generally positive in the entire timeframe, but with a decreasing trend (somewhat buffered by the three outliers taken out
only rare cases, in Table 6, para 4.1.3 the negative values were excluded from the calcu-lation of the averages so as not to alter the overall trend.
of the average); and the Center exhibits up and down trends, with positive fig-ures in the first two years and negative ones in the last two4.
By calculating the profitability performance based on whether or not there is a treatment and disposal plant, yields the following results.
Table 3. Annual profitability indicator averages calculated
with/without disposal plant (%)
2012 2013 2014 2015
ROI ROE ROI adj. ROI ROE ROI adj. ROI ROE adj.ROI ROI ROE ROI adj.
w/ plant -2.70 -1.07 1.44 -0.92 5.82 2.46 -0.28 -5.61 2.49 -1.62 2.77 2.02
w/o plant -3.08 -1.75 3.79 -1.89 5.04 5.36 2.83 2.64 6.86 3.46 0.02 7.35
Outliers ROE: Benevento, Legnano, and Nuoro (w/o plant); Trani (w/ plant). S o u r c e : own study.
The ROI with a plant is always negative, with a four-year average of -1.38%; the ROI without a plant is negative in the first two years and positive in the oth-er two, with a four-year avoth-erage of 0.33%. The adjusted ROI shows constantly positive values for both categories. Nevertheless, the best performance is from companies without a treatment and disposal plant (four-year average of 5.84% vs. 2.10%). As for the ROE, excluding the four outliers previously mentioned, there is further confirmation that waste management companies without a plant perform better than the others (four-year average of 1.49% vs. 0.48%). 1.2. Productivity-efficiency performance
Productivity-efficiency performance assessment, subdivided by geographical macro-area, yields the following results.
4 The ROE must be interpreted in combination with the Net equity (as the denomi-nator of the quotient) because, given the same annual income, companies with less of its own equity will show a higher ROE and rely more heavily on the financial lever. It fol-lows that in such a case, there is increased risk for creditors who find themselves hav-ing to finance most of the assets and therefore they bear the (greater) risk of default. Thus, the ROE indicator must be read in combination with the one for Net equity/Total assets, as shown in Table 6, para 4.1.3.
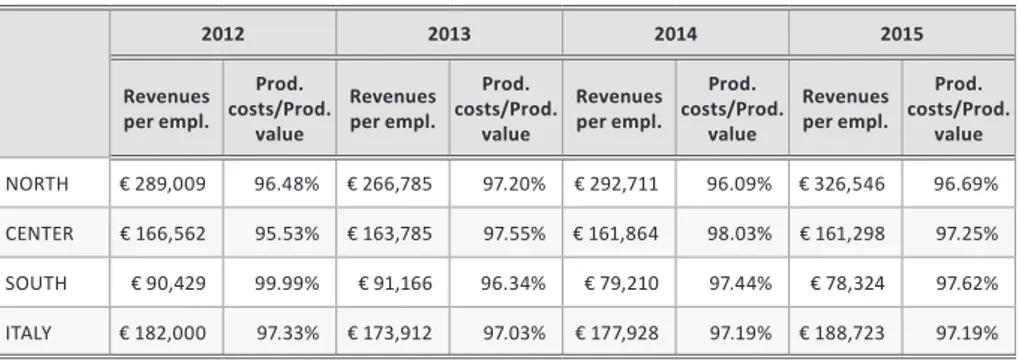
Table 4. Annual productivity-efficiency indicator averages
per geographical macro-area
2012 2013 2014 2015 Revenues per empl. Prod. costs/Prod. value Revenues per empl. Prod. costs/Prod. value Revenues per empl. Prod. costs/Prod. value Revenues per empl. Prod. costs/Prod. value NORTH € 289,009 96.48% € 266,785 97.20% € 292,711 96.09% € 326,546 96.69% CENTER € 166,562 95.53% € 163,785 97.55% € 161,864 98.03% € 161,298 97.25% SOUTH € 90,429 99.99% € 91,166 96.34% € 79,210 97.44% € 78,324 97.62% ITALY € 182,000 97.33% € 173,912 97.03% € 177,928 97.19% € 188,723 97.19% S o u r c e : own study.
The evidence shows that productivity is notably higher in the North than in the other two macro-areas and constantly above the national average; however, the data is partially influenced by the two previously cited outliers (Florence in the Center and Naples in the South). Nevertheless, if the outliers are eliminat-ed from the Revenues per employee indicator, the results for the Center (mini-mum €149,283/maxi(mini-mum €154,511) and the South (mini(mini-mum €74,901/maxi-mum €87,703) worsen, confirming the well-entrenched low productivity of the Center and the South. By contrast, the second indicator (Production costs/Pro-duction value) shows that the efficiency values of the three macro-areas are relatively close in range. In terms of the national averages, however, the North remains slightly above these performance figures.
By reclassifying the productivity-efficiency performance based on whether or not there is a treatment and disposal plant yields the following results.
Table 5. Annual productivity-efficiency indicator averages calculated
with/without disposal plant
2012 2013 2014 2015 Revenues per empl. Prod. costs/Prod. value Revenues per empl. Prod. costs/Prod. value Revenues per empl. Prod. costs/Prod. value Revenues per empl. Prod. costs/Prod. value w/ plant € 225,995 98.75% € 213,304 97.43% € 231,450 98.39% € 252,350 98.64% w/o plant € 132,646 91.46% € 128,259 96.34% € 117,397 95.47% € 120,175 95.49% S o u r c e : own study.
The first indicator reveals a high productivity trend for companies with a treatment and disposal plant (a four-year average of €230,775) and it is sig-nificantly higher than the one for companies without such a plant (four-year av-erage of €124,619). The second indicator for efficiency shows that it is generally higher in companies without a plant, although the difference is relatively mod-est, with the exception of the year 2012.
1.3. Financial-equity profile
The financial-equity indicators, subdivided by geographical area, are reported as follows:
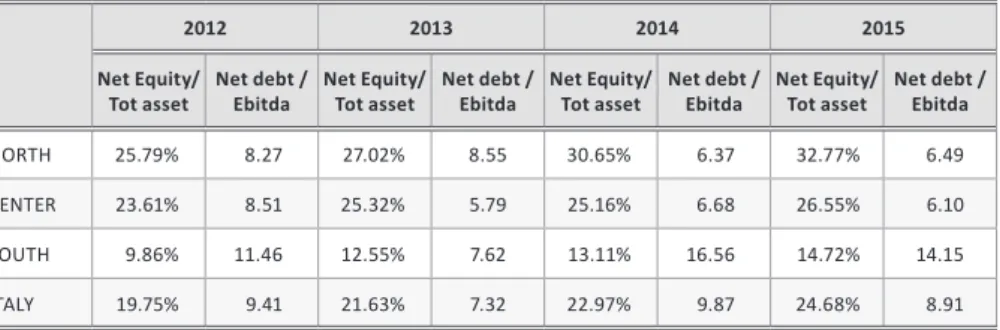
Table 6. Annual financial-equity indicator averages per geographical macro-area
2012 2013 2014 2015
Net Equity/
Tot asset Net debt /Ebitda Net Equity/Tot asset Net debt /Ebitda Net Equity/Tot asset Net debt /Ebitda Net Equity/Tot asset Net debt /Ebitda
NORTH 25.79% 8.27 27.02% 8.55 30.65% 6.37 32.77% 6.49
CENTER 23.61% 8.51 25.32% 5.79 25.16% 6.68 26.55% 6.10
SOUTH 9.86% 11.46 12.55% 7.62 13.11% 16.56 14.72% 14.15
ITALY 19.75% 9.41 21.63% 7.32 22.97% 9.87 24.68% 8.91
Net debt/Ebitda: negative values not included. S o u r c e : own study.
The first indicator shows an improving trend over time for the three areas, revealing a common effort to strengthen companies’ financial-equity profile. Conversely, the geographical factor shows a clear tendency for the best finan-cial-equity conditions to be found in the North and in the Center (with a grow-ing negative disparity between the two areas, over time) and a marked finan-cial-equity deficiency in the southern area.
This latest performance, taken together with the ROE profitability index for southern area companies (see table 2), shows that the good performance seen over the four-year period does not derive from satisfactory company profitabil-ity but from the low level of Net equprofitabil-ity which is put in relation to Net income. In fact, the companies located in the South show profitability and equity profiles
that are much worse than those of competitors located in the other geographi-cal macro-areas.
The second indicator confirms this conclusion, as the pay-back period for southern area companies is considerably longer (except for the year 2013) than it is in the other companies in the central and northern areas.
Calculating the same indicators based on the presence/absence of a disposal plant in the same location yields the following outcomes.
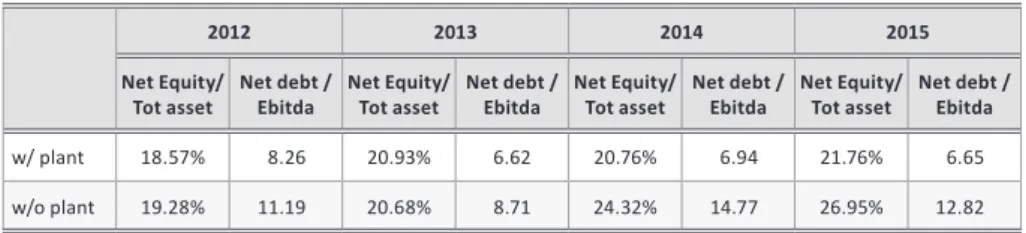
Table 7. Annual financial asset indicator averages calculated
with/without disposal plant
2012 2013 2014 2015
Net Equity/
Tot asset Net debt /Ebitda Net Equity/Tot asset Net debt /Ebitda Net Equity/Tot asset Net debt /Ebitda Net Equity/Tot asset Net debt /Ebitda
w/ plant 18.57% 8.26 20.93% 6.62 20.76% 6.94 21.76% 6.65
w/o plant 19.28% 11.19 20.68% 8.71 24.32% 14.77 26.95% 12.82
Net debt/Ebitda: negative values not included. S o u r c e : own study.
For the first indicator, companies without a disposal plant show a better equity over invested capital ratio, except for 2013 when the percentages were nearly identical. This finding was, in a way, expected because, with no change to equity, the presence or absence of one or more disposal plants, owned out-right or through other legal terms, entails greater investment and therefore, to a predictable worsening of the indicator. This must be read together with the ROI, which also mirrors the trend of being higher in those companies with-out disposal plants. If for no other reason, this is due to the fact that the lat-ter companies highlight lower total assets than those that do have treatment and disposal plants. In fact, the four-year average amount of invested capital in the companies with a plant rises to €58,699,597 compared to €13,330,773 for those without.
As for the second indicator, it shows a definite tendency in favor of compa-nies with a treatment and disposal plant, which show much lower values in all four years compared to companies without such facilities.
This finding stands out in contrast to the profitability indicators, analyzed in paragraph 1.1, that showed a higher capacity to generate income in compa-nies without a disposal plant.
2. Environmental performance
In 2012–2015, in Italy, UW amounted to over 29 million tons. The per capita values show a downward trend, albeit less significantly so in the last year. The Center, with 543 kg per inhabitant, is the macro-area with the highest UW per capita values; nevertheless, it is also the area which saw the greatest reduction of this indicator over the four years (a decline of 6.60% for the Center, 4.06% for the South, and 2.02% for the North).
During each year of the observation period in Italy, of the SC, between 12 and 14 million tons was destined for recycling. The SC values went from 39.98% to 47.49%, the per capita SC increased by 14.47%, with per capita UW falling by 3.63%.
The nation-wide seven percentage point increase in SC shows that in recent years more advanced systems for the recycling of UW have been introduced, in a more or less widespread manner. The fact that many municipalities made SC mandatory most likely contributed favorably to the increase.
Nevertheless, the values highlights evident differences between the per-centages in the North and those in the Center, and ever more so in the South. The fact that SC is not a homogeneous practice throughout the Italian territory is confirmed by the per capita SC values.
After this brief description of the national trends, attention is turned to the findings from the 52 companies, in order to pursue the research objective: we take a look at how the data on the diffusion of best practices pertaining to ur-ban waste management can be put in relation to those companies’ economic and financial performance.
The companies that were monitored are quite representative of national statistics, as they collect 13.70% of the UW in Italy and 13.43% of the SC (2015 data). Moreover, the trend shown by some of the indicators is in line with the national trend. For example, in the 4-year period under analysis, the 52 compa-nies saw a 4.38% reduction in per capita UW, along with increases of 9.12% in SC per capita and of 5.08% in SC% (see table 8).
Table 8. Waste production of the analyzed companies
Per capita UW Per capita SC SC%
2012 516.88 199.08 40.04
2013 504.01 202.25 41.23
2014 509.67 214.97 43.17
2015 494.22 217.24 45.12
Per capita UW and per capita SC shown in Kg. S o u r c e : own study.
The observed performance in terms of SC% is undoubtedly influenced by the type of collection adopted by the municipalities and by the waste manage-ment companies entrusted with providing the service.
The SC systems differ from one municipality to another which can be a com-bination of: on-street containers, door-to-door, collection centers (usually for bulky items, WEEE, and/or other categories). In addition, there can be local variations in how waste must be separated; the most common guidelines con-cern packaging materials (glass, paper, plastic, aluminum), as well as bulky items and WEEE (Symbola, 2015, pp. 2–3).
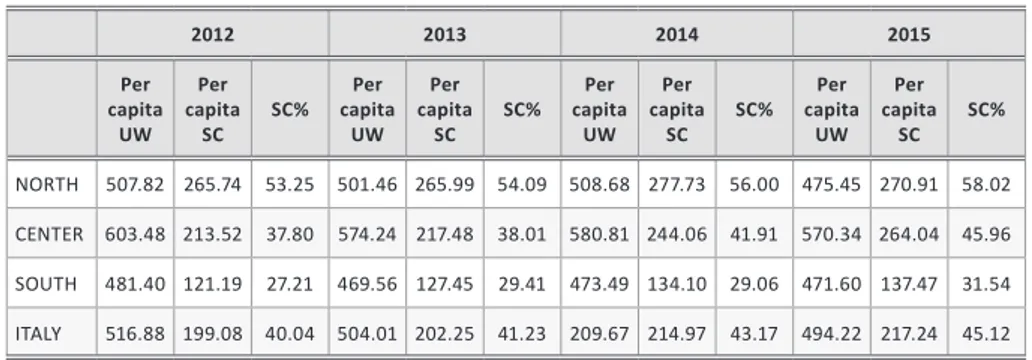
Table 9. Waste production of the analyzed companies, by geographical macro-area
2012 2013 2014 2015 Per capita UW Per capita SC SC% Per capita UW Per capita SC SC% Per capita UW Per capita SC SC% Per capita UW Per capita SC SC% NORTH 507.82 265.74 53.25 501.46 265.99 54.09 508.68 277.73 56.00 475.45 270.91 58.02 CENTER 603.48 213.52 37.80 574.24 217.48 38.01 580.81 244.06 41.91 570.34 264.04 45.96 SOUTH 481.40 121.19 27.21 469.56 127.45 29.41 473.49 134.10 29.06 471.60 137.47 31.54 ITALY 516.88 199.08 40.04 504.01 202.25 41.23 209.67 214.97 43.17 494.22 217.24 45.12
Per capita UW and per capita SC shown in Kg. S o u r c e : own study.
From observation of the macro-area specific values, the Center emerges as the leader in UW per capita production and is the area with the best outcomes
in terms of increased SC% and per capita SC (see table 9). From year to year, the North leads, instead, in per capita UW and SC.
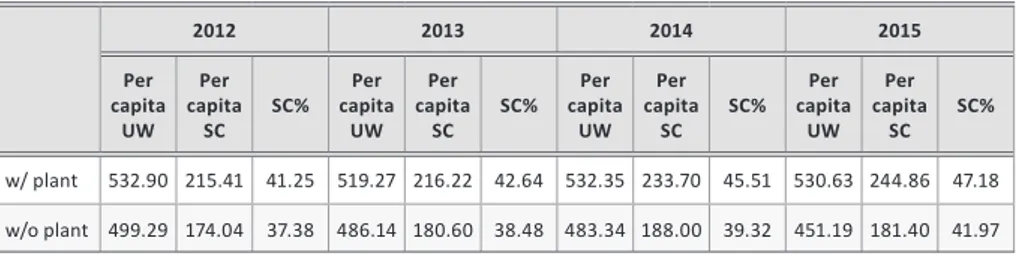
Table 10. Waste production of the analyzed companies calculated
with/without disposal plant
2012 2013 2014 2015 Per capita UW Per capita SC SC% Per capita UW Per capita SC SC% Per capita UW Per capita SC SC% Per capita UW Per capita SC SC% w/ plant 532.90 215.41 41.25 519.27 216.22 42.64 532.35 233.70 45.51 530.63 244.86 47.18 w/o plant 499.29 174.04 37.38 486.14 180.60 38.48 483.34 188.00 39.32 451.19 181.40 41.97
Per capita UW and per capita SC shown in Kg. S o u r c e : own study.
The findings reported in table 10 are not as predictable. They show better performances in SC% and in per capita SC when the company has at least one disposal plant (waste-to-energy plant, composting, landfill, etc.).
Therefore, a greater diversification of activities in which waste collection is combined with waste treatment and disposal would seem to favor the recy-cling of the materials collected separately by the same companies. The dynamic management of a company in which various forms of waste treatment are un-dertaken appears to improve both the company’s productivity and its environ-mental performance.
Discussion and conclusions
In order to investigate the relationship between environmental performance and economic-financial performance, an analysis of the ratio of two indicators is proposed. The numerator is Revenues (item A.1 in the Income Statement) and the denominator is first, the UW to calculate the unitary revenues per ton of all collected UW, and second, the population served to calculate the per cap-ita revenues.
The results obtained provide information on the company’s degree of ef-ficiency and, indirectly, on the costs borne by the beneficiaries of the services provided. In fact, the revenues of the analyzed companies derive mostly from
the taxes levied on the citizens5, although there may be other sources of reve-nue from the sale of waste destined for recycling.
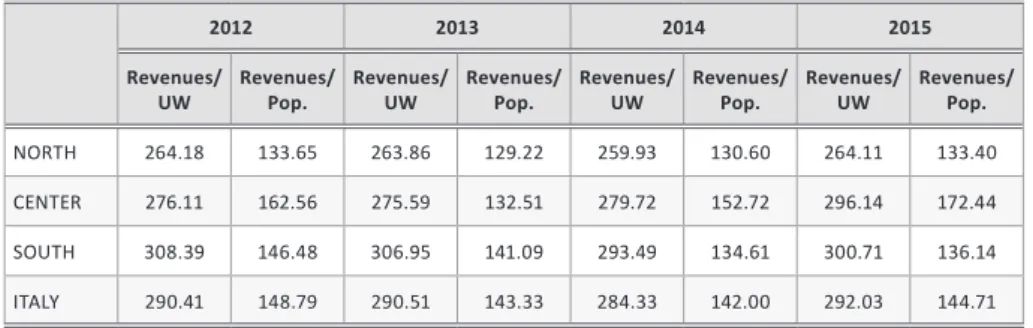
An in-depth look at the data reported in table 11 reveals that the unitary revenues for UW and population served in the North are lower than those in the other two macro-areas. Therefore, in the North the waste management compa-nies operate most efficiently on average, as they can guarantee a service char-acterized by a higher SC level, despite lower unitary revenue. This may depend on several factors related to company choices, among which the logistic solu-tions, the organization of employees, the innovative level of plants and vehicles adopted in the company.
Table 11. Combined environmental and financial performances,
by geographical macro-areas
2012 2013 2014 2015
Revenues/
UW Revenues/Pop. Revenues/UW Revenues/Pop. Revenues/UW Revenues/Pop. Revenues/UW Revenues/Pop.
NORTH 264.18 133.65 263.86 129.22 259.93 130.60 264.11 133.40
CENTER 276.11 162.56 275.59 132.51 279.72 152.72 296.14 172.44
SOUTH 308.39 146.48 306.95 141.09 293.49 134.61 300.71 136.14
ITALY 290.41 148.79 290.51 143.33 284.33 142.00 292.03 144.71
S o u r c e : own study.
This was followed by the calculation of the indicators in relation to the pres-ence or abspres-ence of a treatment and disposal plant (landfill or other plants). The findings do not yield particularly significant differences on a time scale. Rath-er, they show a (slightly) higher unitary revenues per ton of UW and per capita revenues in companies where there is at least one type of treatment and dis-posal plant (see table 12). Although the difference in the two cases (w/ plant and w/o plant) is not so significant, it is observed in both indicators and hence consistent.
As regards this last profile, it is worth recalling what has already been stat-ed concerning the composition of the revenues, considering the fact that the
5 In Italy, the solid UW tax serves to cover the entire cost of the waste management service, with no goal to incentivize – except through a mild price cap – any mechanisms to reduce such costs.
scarcity of accounting details does not allow verification of whether the per capita revenues translate ipso facto into a greater tax burden for users (who must pay higher taxes), or whether they are attributable (at least in part) to economic exploitation of the plants, in which case there should be a consequent reduction in the tax charged to the users. In fact, the Income statement regu-lations, that even waste management companies under analysis must follow, does not call for a separation of each line item mentioned above and the compa-nies do not always provide an explanatory note with specific details.
Findings from previous studies in literature highlight that the cost of door-to-door waste collection is the most expensive factor in SC (Italian Competition Authority, 2016). However, it is also true that having a treatment and disposal plant and being able to recycle UW should lead to a costs’ reduction for the com-pany as well as a possible increase in revenues and, in the best case, to a more convenient relationship between revenues and costs.
Table 12. Combined environmental and financial performances,
calculated with/without treatment facility
2012 2013 2014 2015
Revenues/
UW Revenues/Pop. Revenues/UW Revenues/Pop. Revenues/UW Revenues/Pop. Revenues/UW Revenues/Pop.
w/ plant 291.55 155.92 295.65 153.52 291.82 154.06 293.69 154.56
w/o plant 289.09 140.47 284.51 131.44 275.60 127.93 290.09 133.23
S o u r c e : own study.
In conclusion, it emerges from the study that SC has increased gradually, across all of the macro-areas, both in percentages and in per capita values. Nev-ertheless, the increase does not appear to be particularly significant, especially considering the ambitious objectives established by the circular economy pack-age; in fact, according to the European Parliament, at least 70% by weight of so-called UW should be recycled or prepared for re-use; i.e., checked, cleaned, or repaired. Furthermore, the uneven diffusion of SC shown in the macro-areas of Italy could further slow the progress toward an integrated and uniform recy-cling process within the country as a whole.
The results prove how important is to monitor the economic and financial performance of companies mainly engaged in achieving those objectives. In fact, this kind of analysis, supporting the decision process of policy makers,
can help in making waste management more efficient and productive for those operators while realizing the European objectives.
It is equally important to underscore that, beyond the real impact of SC on the production of UW and its future trends, the quality of the waste collect-ed becomes a pivotal factor in reclaiming resources and enhancing the value of secondary raw materials. Collection methods can impact on the amount of waste disposed and on the quantity that is actually recycled.
This is a crucial aspect that has not been the object of analysis in the pre-sent work; it would require studying the various methods of waste collection (on-street, door-to-door, etc.) along with the various qualitative performances of SC and its costs.
Exploring these highly interesting themes would mean fine-tuning the anal-ysis conducted in this study, a goal the authors of this article plan to pursue in the future.
References
Bartolacci, F., Paolini, A., Quaranta, A.G., & Soverchia, M. (2018). The relationship be-tween good environmental practices and financial performance: evidence from Italian waste management companies. Sustainable Production and Consumption, 14(2), 129–135. http://dx.doi.org/10.1016/j.spc.2018.02.002.
Bognetti, G., & Robotti, L. (2003). The reform of local public utilities in Italy. Annals of Public and Cooperative Economics, 74(1), 117–137. http://dx.doi.org/10.1111/1467-8292.00218.
Citroni, G., Lippi, A., & Profeti, S. (2016). Local public services in Italy: still fragmenta-tion. In H. Wollmann, I. Koprić, G. Marcou (Eds.). Public and Social Services in Europe. From Public and Municipal to Private Sector Provision. Berlin: Springer.
Cossu, R., & Williams, I.D. (2015). Urban mining: concepts, terminology, challenges. Waste Management, 45, 1–3. http://dx.doi.org/10.1016/j.wasman.2015.09.040. European Commission (2015). Closing the loop. An EU action plan for the Circular
Econo-my. COM(2015) 614 final, Brussels.
European Parliament (2017). Circular economy package. Four legislative proposals on waste. Brussels.
Gharfalkar, M., Court, R., Campbell, C., Ali, Z., & Hillier, G. (2015). Analysis of waste hi-erarchy in the European waste directive 2008/98/EC. Waste Management, 39, 305– 313. http://dx.doi.org/10.1016/j.wasman.2015.02.007.
Greco, G., Allegrini, M., Del Lungo, C., Gori Savellini, P. & Gabellini, L. (2015). Drivers of solid waste collection costs. Empirical evidence from Italy. Journal of Cleaner Pro-duction, 106, 364–371. http://dx.doi.org/10.1016/j.jclepro.2014.07.011.
Hart, S.L., & Ahuja, G. (1996). Does it pay to be green? An empirical examination of the relationship between emission reduction and firm performance. Business
Strategy and the Environment, 5(1), 30–37. http://dx.doi.org/10.1002/(SICI)1099-0836(199603)5:1<30.
Higgins, R. (2012). Analysis for Financial Management: Tenth edition. New York: McGraw-Hill.
Horváthová, E. (2012). The impact of environmental performance on firm perfor-mance: Short-term costs and long-term benefits? Ecological Economics, 84, 91–97. http://dx.doi.org/10.1016/j.ecolecon.2012.10.001.
Italian Competition Autority (2016). Indagine conoscitiva sui rifiuti solidi urbani (Fact-finding survey on solid urban waste). Rome.
Judge, W.Q., & Douglas, T.J. (1998). Performance implications of incorporating natu-ral environmental issues into the strategic planning process: an empirical assess-ment. Journal of Management Studies, 35, 241–262. http://dx.doi.org/10.1111/1467-6486.00092.
Khanna, M., & Damon, L.A. (1999). EPA's Voluntary 33/50 Program: Impact on Toxic Re-leases and Economic Performance of Firms. Journal of Environmental Economics and Management, 37(1), 1–25. http:// dx.doi.org/10.1006/jeem.1998.1057.
Koushki Parviz, A., Al-Duaij, U., & Al-Ghimlas, W. (2004). Collection and transportation cost of household solid waste in Kuwait. Waste Management, 24(9), 957–964. http:// dx.doi.org/10.1016/j.wasman.2004.03.013.
Listowski, A., Ngo, H.H., & Guo, W.S. (2013). Establishment of an economic evaluation model for urban recycled water. Resources, Conservation and Recycling, 72, 67–75. http://dx.doi.org/ 10.1016/j.resconrec.2012.12.011.
Lohri, C.R., Camenzind, E.J., & Zurbrügg, C. (2014). Financial sustainability in municipal solid waste management – Costs and revenues in Bahir Dar, Ethiopia. Waste Man-agement, 34(2), 542–552. http://dx.doi.org/10.1016/j.wasman.2013.10.014. Macpherson, M. (2001). Performance measurement in not-for-profit and
public-sec-tor organizations. Measuring Business Excellence, 5(2), 13–17. http://dx.doi. org/10.1108/13683040110397220.
Nishitania, K., Jannah, N., Kaneko, S., & Hardinsyah (2017). Does corporate environ-mental performance enhance financial performance? An empirical study of indone-sian firms. Environmental Development, 23, 10–21. http://dx.doi.org/10.1016/j.en-vdev.2017.06.003.
Pollit, C., & Bouckaert, G. (2011). Public management reform. Oxford: Oxford University. Qi, G.Y., Zeng, S.X., Shi, J.J., Meng, X.H., Lin, H., & Yang, Q.X. (2014). Revisiting the re-lationship between environmental and financial performance in Chinese industry. Journal of Environmental Management, 145, 349–356. http://dx.doi.org/10.1016/j. jenvman.2014.07.010.
Rubio-Romero, J.C., Arjona-Jiménez, R., & López-Arquillosa, A. (2013). Profitability analysis of biogas recovery in Municipal Solid Waste landfills. Journal of Cleaner Pro-duction, 55(15), 84–91. http://dx.doi.org/10.1016/j.jclepro.2012.12.024.
Sargiacomo, M. (2013). Public Sector Management in Italy. Milan: McGraw-Hill.
Song, H., Zhao, C., & Zeng, J. (2017). Can environmental management improve financial per-formance: An empirical study of A-shares listed companies in China. Journal of Clean-er Production, 141, 1051–1056. http://dx.doi.org/10.1016/j.jclepro.2016.09.105.
Symbola (2015). Waste end. Economia circolare, nuove frontiera del made in Italy (Waste end. Circular economy, new border for made in Italy). Rome: Symbola Foundation. Tisserant, A., Pauliuk, S., Merciai, S., Schmidt, J., Fry, J., Wood, R., & Tukker, A. (2017).
Sol-id waste and the circular economy – a global analysis of waste treatment and waste footprints. Journal of Industrial Ecology, 21(3), 628–640. http://dx.doi.org/10.1111/ jiec.12562.
Utilitatis (2016). Green Book. Rome.
Velenturf, A.P.M., & Purnell, P. (2017). Resource recovery from waste: restoring the balance between resource scarcity and waste overload. Sustainability, 9(9), 1–17. http://dx.doi.org/10.3390/su9091603.