UNIVERSITÀ POLITECNICA DELLE MARCHE
FACOLTÀ DI MEDICINA E CHIRURGIA
Corso di Dottorato di Ricerca in Salute dell’Uomo
XXX Ciclo
Action of ciliary neurotrophic factor on mouse brain
feeding centers
Dottoranda:
Docente tutor:
Martina Senzacqua
Prof. Saverio Cinti
1. SUMMARY (Italiano e Inglese) 2
2. INTRODUCTION 6
2.1. Central control of food intake 6
2.1.1. Hypothalamic circuits involved in energy homeostasis 7 2.1.2. Brainstem circuits involved in energy homeostasis 10 2.1.3. Appetite and satiety peripheral signals 15
2.2. The Ciliary neurotrophic factor (CNTF) 19
2.2.1. CNTF and CNTF receptor distribution 21
2.2.2. CNTF and energy balance 23
3. AIMS OF THE PROJECT 26
4. MATERIALS AND METHODS 27
4.1. Animals and experimental conditions 27
4.2. Tissue processing 27
4.3. Primary antibodies 28
4.4. Peroxidase immunoistochemistry 30
4.5. Immunofluorescence and confocal microscopy 31
4.6. Morphometric analysis 31
4.7. RNA isolation, cDNA Synthesis, and RT-qPCR 32
5. RESULTS 34
5.1. CNTF-responsive cells in the mouse hypothalamus 34 5.2. Mismatch of CNTF-responsive and CNTF-producing cells in the
tuberal hypothalamus
43
5.3. CNTF-responsive cells in the mouse area postrema 44 5.4. CNTF induces c-Fos expression in the mouse NTS 49 5.5. The action of CNTF on the mouse brainstem is not dependent on
leptin but engages leptin-responsive NTS neurons
52
5.6. Mismatch of CNTF-responsive and CNTF-producing cells in the mouse area postrema
54
6. DISCUSSION 57
1. RIASSUNTO
Il fattore neurotrofico ciliare (CNTF) è un fattore neurotrofico in grado di indurre sazietà e aumentare la spesa energetica sia nell’uomo che in roditori. Esso agisce a livello cellulare con un meccanismo simile a quello della più nota leptina, attraverso la via di trasduzione Jak-STAT3. Studi recenti hanno evidenziato che nell’ipotalamo tuberale di topo il CNTF è normalmente espresso da cellule gliali e il suo meccanismo d’azione è potenziato in modelli sperimentali di obesità. Mediante studi di immunoistochimica, abbiamo dimostrato per la prima volta che la somministrazione di CNTF induce l’attivazione non solo di STAT3, ma anche di STAT1 e STAT5 nell’ipotalamo tuberale, in particolare nelle cellule ependimali del terzo ventricolo, nei beta-taniciti e in cellule gliali dell’eminenza mediana. In questa sede, inoltre, il CNTF attiva nei beta-taniciti e nelle cellule dell’eminenza mediana il c-Fos, marker di attivazione cellulare. Abbiamo quindi verificato l’interessante ipotesi che il CNTF, oltre ad un’azione a livello ipotalamico, potesse avere un’azione anche a livello dei centri truncali, i quali costituiscono un’altra importante sede per il controllo del comportamento alimentare. Abbiamo dimostrato in questo successivo studio, che il CNTF nell’area postrema, così come nell’eminenza mediana, attiva le diverse isoforme STAT3, STAT1 e STAT5. Studi di co-localizzazione hanno evidenziato che gran parte delle cellule gliali responsive al CNTF nell’area postrema esprimono i tipici marker di immaturità, tra i quali nestina e vimentina. Dopo 120 minuti dal trattamento con CNTF abbiamo osservato una forte attivazione di c-Fos nei neuroni del nucleo del tratto solitario e una debole attivazione dello stesso marker in alcuni neuroni colinergici del nucleo motore dorsale del vago. Il doppio trattamento con CNTF (120 minuti, per indurre espressione di c-Fos) e con leptina (25 minuti, per indurre fosforilazione di STAT3) ha permesso di dimostrare la co-localizzazione dei due marker in una piccola popolazione di neuroni nella porzione caudale del nucleo del tratto solitario. Inoltre, nell’area postrema, si evidenzia una notevole discrepanza tra le numerose cellule che rispondono al
del CNTF e del suo recettore è stato confermato anche da studi di RT-qPCR, sia a livello dell’area postrema che dell’ipotalamo. In conclusione, il CNTF rappresenta un nuovo fattore di sazietà coinvolto nella regolazione del bilancio energetico che, oltre ad una principale azione a livello dell’ipotalamo, esercita un’azione parallela e ridondante anche a livello del tronco encefalico. Esso, inoltre, non agisce solamente su neuroni ma anche su cellule gliali, dove modula non solo il sistema di trasduzione Jak-STAT3, ma anche Jak-STAT1 e Jak-STAT5.
1. SUMMARY
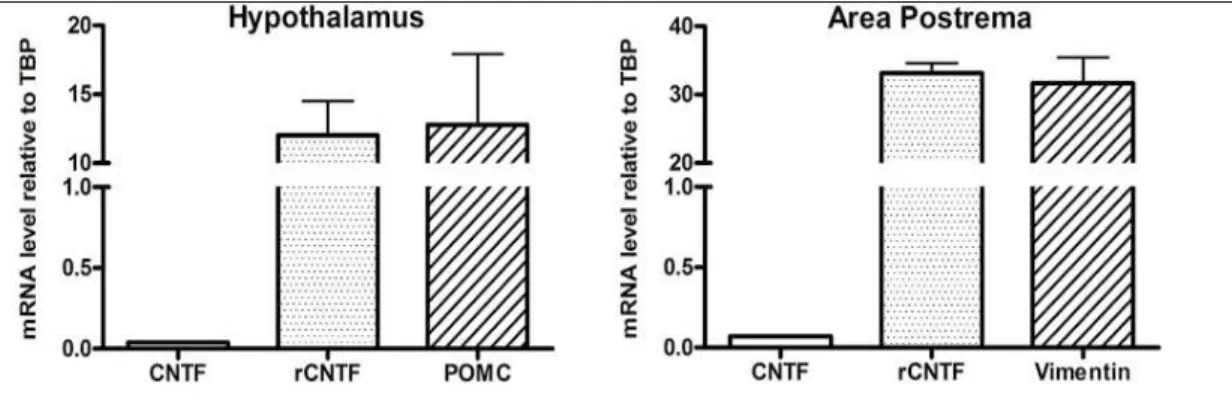
The ciliary neurotrophic factor (CNTF)induces satiety and increase of energy expenditure in rodents and humans through a leptin-like activation of the Jak-STAT3 signaling pathway. Recent studies demonstrated that CNTF is constitutively produced by hypothalamic glial cells and that its expression is up-regulated in obese mice. By immunohistochemistry studies, here we show for the first time that after systemic treatment, rat recombinant CNTF induced activation of STAT1 and STAT5 in the tuberal hypothalamus in mice, in particular in ependymal cells bordering the third ventricle floor and lateral recesses, and in median eminence β-tanycytes and glial cells. Moreover, STAT activation was accompanied by c-Fos expression in β-tanycytes and median eminence cells of CNTF- treated mice. We also tested the hypothesis that CNTF affects the brainstem centers involved in feeding and energy homeostasis. In the area postrema of mice, as well as in the median eminence, CNTF activates STAT3, STAT1 and STAT5. Co-localization studies showed that a significant proportion of CNTF-responsive glial cells were also positive for immaturity and plasticity markers, such as nestin and vimentin. After 120 min from the treatment, we observed a strong c-Fos expression in several neurons of the rostral and caudal solitary tract nucleus (NTS), and a weak c-Fos immunostaining in some cholinergic neurons of the dorsal motor nucleus of the vagus. Treatment with CNTF (120 min, to induce c-Fos expression) and leptin (25 min, to induce STAT3 phosphorylation) demonstrated the co-localization of the two markers in a small percentage of neurons in the caudal NTS portion. In contrast to the high responsiveness to CNTF, in the area postrema CNTF immunoreactivity is weak and sparse, and mainly detected in glial cells of the funiculus separans and the meninges. RT-qPCR in micropunched area postrema and hypothalamus mouse tissues confirms the high discrepancy between the CNTF and CNTF receptor expressions in both the two brain regions examined.
acts not only on neuronal cells but also on glial cells, where it modulates not only the Jak-STAT3 transduction system, but also Jak-STAT1 and Jak-STAT5 activities.
2. INTRODUCTION
2.1. Central control of food intake
Obesity has reached epidemic levels worldwide, accompanied by the increased prevalence of multiple obesity-associated clinical conditions such as insulin resistance and diabetes, cardiovascular diseases, some cancers, mood related disorders, and numerous other health problems (Kenny, 2011). The brain plays a central role in energy homeostasis by integrating multiple peripheral metabolic inputs, such as nutrients, gut-derived hormones, and adiposity-related signals. Central nervous system regulates diverse aspects of body metabolism and feeding behaviour, including hunger and satiety, food-seeking behaviour, gastric emptying, nutrient uptake in the gut, thermogenesis, pancreatic insulin secretion, as well as the effects of insulin in the liver, adipose tissue, and skeletal muscle (Morton et al., 2006; Broberger, 2005). Lesioning studies performed in several species in the late 1930’s through the 1950’s highlighted the importance of hypothalamus in the regulation of body weight and demonstrated the presence in the hypothalamus of two opposite neuronal centers: the lateral (lateral hypothalamic area, LHA) and dorsal (paraventricular nucleus of hypothalamus, PVN) areas of the hypothalamus were described as “feeding centers”, whereas more ventral structures (arcuate nucleus, ARC and ventromedial nucleus, VMN) were described as “satiety centers” (Hetherington and Ranson, 1939, 1940, 1942a,b). The validity of this “dual center” model has been discussed and questioned for twenty years. More recently, the notion of specific centers of the brain that control food intake has been replaced by that of discrete and complex neuronal pathways that generate integrated responses to various central and peripheral afferent inputs (Schwartz et al., 2000).
After the discovery of leptin (Zhang et al., 1994), an anorexigenic adipose tissue-derived hormone that circulates in proportion to fat mass, numerous studies focused on the neuronal hypothalamic structures mediating the leptin
hypothalamus as a crucial site of central energy sensing, with central leptin-insensivity being a hallmark of obesity (Frederich et al., 1995; Seeley et al., 1996).
Recently, also brainstem neurons have been described as involved in central control of energy balance, by processing energy status information and having an important role in ingestive control (Schwartz, 2006; Schwartz, 2009). Collectively, circulating signaling peptides that modulate food intake and energy expenditure provide metabolic and nutritional information to the CNS by acting on hypothalamic as well as brainstem neuronal circuits (Young, 2012; Morton et al., 2014; Schneeberger et al., 2014).
2.1.1. Hypothalamic circuit involved in energy homeostasis
The hypothalamus, a small structure representing less of 1% of the total volume of the brain, is an important center that controls many physiological aspects critical for survival including temperature, reproduction, biological cycles, hormonal balance and energy regulation.
It is constituted by distinct hypothalamic nuclei involved in energy balance, including the arcuate nucleus (ARC), the paraventricular nucleus (PVN), the lateral hypothalamic area (LHA), the dorsolmedial nucleus (DMN) and the ventromedial nucleus (VMN) (Schwartz et al., 2000).
ARC is situated in the mediobasal hypothalamus, adjacent to the floor of the third ventricle and it’s the best-studied region for the neuronal control of energy balance. ARC is particularly sensitive to hormonal and nutrient fluctuations in the bloodstream thanks to its position, immediately adjacent to the median eminence (ME), a circumventricular organ that has a fenestrated blood-brain barrier (Johnson and Gross, 1993). Moreover, ARC like many of the key nuclei controlling energy balance, is in close proximity to the third ventricle. The ventricle wall contains layers of ciliated ependymal cells and tanycytes (Rodríguez et al., 2005). Tanycytes are unique glial cell type of the mature brain with a distinct morphology: they are directly in contact with the cerebrospinal fluid at their apical surface, and send a single and long basal process into the brain parenchyma. They form a blood-cerebrospinal fluid
barrier at the level of circumventricular organs (Langlet et al., 2013a) and they play a crucial role in brain homeostasis, regulating the access of peripheral metabolic signals to the ARC (Langlet, 2014).
Additionally tanycytes, similarly to various types of glial cells, may interact with other neural cells, communicating via changes in intracellular Ca2+, responding to several transmitters and releasing ATP (Dale, 2011).
In the ARC, distinct and antagonistic neuronal populations coordinate various peripheral and central signals as hormones, neuropeptides and neurotransmitters to control the hunger/satiety status (Schwartz et al., 2000). There are two major populations of neurons controlling appetite and energy expenditure: a subset of neurons that co-express orexigenic neuropeptide Y (NPY) and agouti-related peptide (AGRP) and a population of neurons that co-express the anorexigenic neuropeptides cocaine-and amphetamine-regulated transcript (CART) and proopiomelanocortin (POMC) (Hahn et al., 1998). Both types of neurons (NPY/AGRP and POMC/CART) are regulated by leptin and insulin but in an opposing manner.
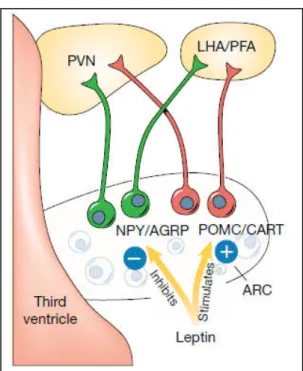
Thus, NPY/AGRP neurons are inhibited by leptin and insulin, and consequently are activated in conditions where leptin or insulin levels are low (Schwartz et al., 1996, Hahn et al., 1998, Sipols et al., 1995). Conversely, conditions characterized by reduced insulin or leptin inhibit POMC and CART expression in the ARC, and administration of these hormones can prevent or attenuate these neuropeptide response (Schwartz et al., 1997, Kristensen et al., 1998). NPY/AGRP and POMC/CART neurons of the ARC are defined as “first-order neurons”and project to “second-order neurons” of the PVN, the perifornical area (PFA) adjacent to the fornix and the LHA, and to brainstem neurons of nucleus of solitary tract (NTS) (Schwartz et al., 2000) (Fig. 1). POMC neurons produce the anorectic peptide α-melanocyte stimulating hormone (α-MSH) by post-transcriptional processing of POMC. α-MSH binds to the melanocortin receptors 3 and 4 (MC3R and MC4R) on second-order neurons and activates catabolic pathways, leading to reduced food intake and increased energy expenditure (Cowley et al., 1999). Different modifications in
syndrome in both rodents and humans (Huszar et al., 1997; Butler et al., 2000; Gropp et al., 2005).
On the other hand, central administration of NPY increases food intake via Y1 or Y5 receptors, which are highly expressed in the ARC, PVN, and VMH (Raposinho et al., 2001). Likewise, central administration of AgRP induces hyperphagia and weight gain by inhibiting the binding of α-MSH to MC3R/MC4R (Schwartz et al., 2000). Selective ablation of NPY/AgRP neurons in adult mice results in anorexia and weight loss (Luquet et al., 2005), confirming a critical role of these neurons in the regulation of energy homeostasis.
Fig. 1 - First order NPY/AgRP and POMC/CART neurons regulated by leptin
2.1.2. Brainstem circuits involved in energy homeostasis
Much of the credit for recognition of the contribution of brainstem structures in control of food intake goes to Grill and colleagues. They showed that sapid stimuli administered by mouth elicited the same mechanical ingestive responses in de-cerebrated rats and in control ones (Grill and Norgren, 1978a, b). They also demonstrated that the glucoprivic feeding resulting from insulin-induced hypoglycemia was evident even in de-cerebrated rats (Flynn and Grill, 1983), suggesting that glucose related ingestive behaviors could also be generated in caudal brain structures. Moreover, the same group showed that the satiety hormone cholecystokinin reduced food intake in de-cerebrated rats, compelling further evidence that caudal brainstem can regulate food intake in the absence of hypothalamic influences (Grill and Smith, 1988).
The brainstem contains heterogeneous populations of neurons with distinct biophysical and neurochemical properties that express appetite-modulatory neuropeptides such as NPY and POMC; these neurons also express receptors mediating the effects of the same neuropeptides, indicating the existence of local circuits that contribute to the regulation of ingestive behaviors (Schneeberger et al., 2014). Moreover, in the brainstem receptors for a variety of circulating hormones such as leptin, ghrelin, glucagone-like peptide 1 (GLP1), amylin, and cholecystokinin (CCK) have been described (Schwartz et al., 2006).
Vagal signaling from the gastrointestinal tract is an important afferent to the brainstem, conveying information about luminal distension and nutritional content (Travagli et al., 2006). The importance of vagus nerve transmission has been demonstrated with several studies by eliminating or stimulating its activity. For example, chronic or acute vagal stimulation leads to a reduction in body weight and food intake (Gil et al., 2011). Vagal afferents also play important roles in the regulation of meal size and duration (Schwartz et al., 1999).
anatomically and functionally integrated to provide autonomic, behavioral and endocrine responses to energy-related peripheral cues and are collectively referred to as the dorsal vagal complex (DVC) (Young, 2012).
NTS is a structure bordering the posterior part of the 4th ventricle and it is the
main sensory relay for the viscera, that integrates sensory information from gastrointestinal tract and abdominal organs, as well as taste information from the oral cavity (Travers et al., 1987). Afferent inputs related to satiety from the liver, the gastrointestinal tract during food ingestion and from peptides that are released upon nutrient stimulation, such as CCK, are transmitted through the vagus nerve and sympathetic fibres to the NTS, where they are integrated with descending hypothalamic inputs (Schwartz et al., 2000) (Fig. 2). In particular, ARC POMC neurons project into NTS, where high expression of MC4R has been reported (Kishi et al., 2003).
The NTS also receives projections from orexin neurons located in the LHA (Ciriello et al., 2003), and the delivery of orexin A into the brainstem increases food intake (Parise et al., 2011). The orexigenic nature of the LHA and the anatomical connection with the NTS suggest that this system may serve as a mechanism to limit satiety signals from gastrointestinal tract.
Another hypothalamic nucleus sending projections into the NTS is the PVN: contralateral disruption of PVN outputs and related NTS inputs causes hyperphagia and obesity (Kirchgessner and Sclafani, 1988), indicating that PVN-brainstem pathways potentiate satiety signals at the level of NTS and play a significant role in the regulation of energy balance.
Adiposity signals such as leptin and insulin potentiate the satiating effect of CCK to activate NTS neurons (Emond et al., 1999).
Administration of MC4 receptor agonists or antagonists in the 4th ventricle elicits the same feeding response of those induced by injecting these compounds into the third ventricle (Grill et al., 1998).
These findings, combined with the evidence that leptin receptors and POMC neurons are both present in NTS, demonstrate definitively the involvement of NTS in energy homeostasis. Thus, the NTS like the ARC may contain neurons that respond to leptin and, through ascending projections to key forebrain
areas, contribute to adaptive feeding responses to changes in body fat content (Schwartz et al., 2000).
DMX is directly ventral to the NTS, adjacent to the central canal and is the
main source of vagal innervation of various organs within the gastrointestinal tract, including the stomach, gut and pancreas (Kalia, 1981). It has an important role in the regulation of gut motility and secretion (Young, 2012), but it is also a major brain region involved in mediating pancreatic secretion, as revealed by more recent studies (Mussa and Verberne, 2013).
AP is a circumventricular organ adjacent to the NTS at the posterior extreme
of the 4th ventricle. Circumventricular organs (CVOs) have been described as the “windows of the brain” because they have a fenestrated vasculature, so they lack a complete blood-brain barrier (BBB) (Johnson and Gross, 1993). For this reason, CVOs allow chemical messages to leave the brain and permit substances that do not normally cross the BBB elsewhere to alter brain functions (Horsburgh and Massoud, 2013). The vasculature of the CVOs differs from general brain vasculature. Firstly CVOs lack the expression of the tight junction proteins such as claudin-5, occludin and zonula occludens-1 (ZO-1); secondly the expression of the transport proteins such as glucose transporter 1 and transferrin receptor is not detectable (Morita and Miyata, 2012).
In addition to AP and ME mentioned above, other CVOs are the organ vasculosum of the lamina terminalis (OVLT), the subfornical organ (SFO), the neurohypophysis (NH), the pineal gland (PG) and the subcommissural organ (SCO).
CVOs are generally connected with adjacent neuronal nuclei: for example, the ME is in contact with the ARC through numerous reciprocal innervations and the AP is strictly interconnected with the NTS.
The border zone between the AP and the NTS is made of a continuous monolayer of columnar cells immunoreactive for both the tight junction protein ZO-1 and the astrocyte marker glial fibrillary acidic protein (GFAP) (Wang et al., 2008). The function of this diffusion barrier between AP and
adjacent to the CVO (Wang et al., 2008). In this border zone, called “funiculus separans” also extracellular matrix markers are highly expressed: extracellular matrix is indeed important for CVOs function, for diffusion of molecules between AP and NTS and for the maintenance of extracellular matrix hydration (Pόcsai and Kálmán, 2014).
In the early 1950’s Borison and colleagues identified the AP as the chemoreceptor trigger zone involved in controlling the emetic reflex (Borison and Wang, 1953). Chemosensitive receptors in the AP detect emetic agents in the blood and relay their information to neurons of adjacent brain regions to cause vomiting and nausea (Hornby, 2001). Other functions related to cardiorespiratory and fluid homeostasis were identified over the ensuing 40 years (Young, 2012). Moreover, the position of AP within the brain, the lack of BBB and other ultrastructural peculiarities suggested that this CVO was highly specialized to sense blood- and CSF-borne chemical information. In addition, AP receives neuronal information directly from various thoracic and abdominal viscera via several cranial nerves, and projections from PVN (Riediger, 2012). Another property of AP is the presence of a large variety of receptors for a number of neuroactive compounds and chemical substances such as neurotransmitters, hormones and toxins (Young, 2012). All these features underscore the importance of AP in feeding behaviour and energy homeostasis. This role in ingestion was proposed for the first time in 1981 (Edwards and Ritter 1981); studies on AP ablation, demonstrated that AP-lesioned (APX) rats were hypophagic and showed lower body weight compared to sham-lesions animals, although they over-consume highly palatable food. Furthermore, APX leads to loss of hypoglycaemic or glucoprivic feeding responses induced by insulin, suggesting a role of AP in central nervous glucose sensing (Hyde and Miselis, 1983). Therefore, AP is not simply a conduit through which signals flow into the brain, but it is now being recognized as the initial site of integration for these signals as they enter the circuitry of the central nervous system (Price et al., 2008).
In conclusion, brainstem neurons make key contributions to the control of energy balance by processing energy status informations at different levels; by sensing circulating metabolites and hormones released in the bloodstream by
peripheral organs; by receiving vagal inputs from gastrointestinal tract; by receiving neuronal inputs from midbrain and forebrain nuclei and by projecting into local brainstem circuits and other brain regions to provide information that will be integrated to control energy balance (Schneeberger et al., 2014).
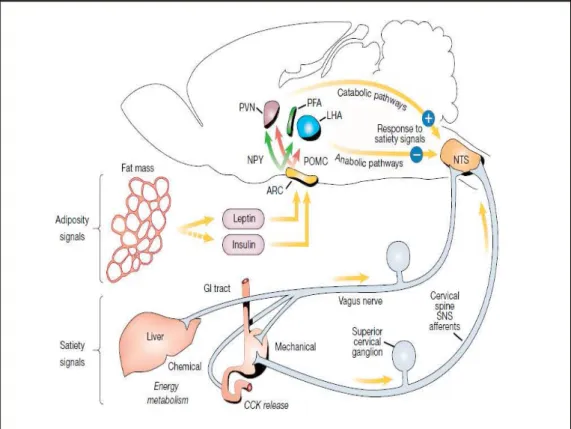
Fig. 2 - Neuroanatomical model of pathways by which adiposity signals, leptin
and insulin, interact with central autonomic circuits regulating meal size. Leptin and insulin in the ARC stimulate POMC/CART neurons and inhibit NPY/AGRP neurons. These pathways projects to PVN and LHA/PFA, that are connected with hindbrain autonomic centres involved in energy balance. NTS integrates these hypothalamic inputs with vagal afferent signals from the liver, the gastrointestinal tract and from peptides such as CCK. Net neuronal output from the NTS leads to the termination of meals and is potentiated by catabolic projections from the PVN and inhibited by input from the LHA/PFA (Schwartz et al., 2000).
2.1.3. Appetite and satiety peripheral signals
Peripheral signals play important role in the regulation of food intake, as well as glucose homeostasis and energy expenditure. To be an ‘adiposity’ signal, a circulating compound must meet several criteria: 1) it must circulate in proportion to the total amount of stored fat, 2) it should interact with the brain directly, presumably by crossing the blood-brain barrier, to act on receptors in the CNS that are involved in the regulation of food intake and energy expenditure, and 3) changes in its level or activity should produce predictable changes in energy balance, by altering food intake and energy expenditure (Seeley and Woods, 2003). All these criteria are suited exactly by leptin, the hormone discovered in 1994 (Zhang et al., 1994) that changed the landscape in the understanding of the central regulation of energy balance.
Leptin, the product of the ob gene, is the anorexigenic adipose tissue-derived
hormone that circulates in proportion to fat mass (Considine et al., 1996). This adipokine can interact with the CNS crossing the BBB through a saturable transport system (Schwartz et al., 1996).
Tartaglia and co-workers in 1995 identified and cloned the rodent and human leptin receptor, a molecule belonging to the gp130 family of cytokine receptors. After leptin binding, the homodimerization of the receptor activates preferentially the Janus kinase/signal transducer and activator of transcription (JAK/STAT) pathway, a mechanism of action in common with other cytokines (Cattaneo et al., 1999). Leptin also acts through phosphatidylinositol-3-OH kinase (PI3K), a pathway important for both food intake and glucose homeostasis (Niswender et al., 2001). There are multiple leptin receptor isoforms, with the long form (LEPRb) being essential for the effect of leptin. The lack of leptin or LEPRb in both rodents and human causes a phenotype characterized by hyperphagia, reduced energy expenditure and severe obesity (Tartaglia et al., 1995; Lee et al., 1996; Montague et al., 1997). Obese patients generally exhibit leptin resistance, which is the inability of high circulating leptin levels to exert central anorexigenic actions, which precludes the use of leptin as a therapeutical anti-obesity agent.
The leptin receptor is highly expressed in hypothalamic nuclei; in the ARC it’s expressed in both AgRP and POMC neurons, where leptin produces opposite effects, stimulating POMC neurons and inhibiting AgRP neurons (Cowley et al., 2001). More recent studies demonstrate the presence of leptin receptor also in the DVC, in particular in a subpopulation of glial cells located in the AP/NTS border, suggesting the action on leptin also at the level of brainstem (Dallaporta et al., 2009).
Insulin, a hormone produced by β-cells, has traditionally been associated with
glucose metabolism, but compelling evidence indicates that it also acts as an anorectic signal within the CNS. Its involvement in the control of food intake was suggested by Woods et al., in 1979. Insulin, similarly to leptin, is secreted in the bloodstream in proportion to fat stores and its receptor is expressed in hypothalamic areas involved in the control of appetite; insulin up-regulates arcuate POMC and decreases NPY and AgRP expression (Marks et al., 1990; Schwartz et al., 1996). Deletion of leptin receptors in POMC neurons results in moderate obesity without any effect on glucose homeostasis (Balthasar et al., 2004), while deletion of insulin receptors alone from POMC neurons fails to influence energy or glucose homeostasis (Konner et al., 2007); these studies highlight different functional role of both signals on melanocortin neurons. In rat brain, insulin-receptors were also detected in AP, NTS and DMX (Pardini et al., 2006).
Ghrelin is a hormone mainly produced by the stomach and regulated by the
ingestion of nutrients (Ariyasu et al., 2001). Circulating ghrelin levels are increased under fasting conditions and reduced after refeeding. It has been described as a “hunger signal” because its secretion stimulate appetite (Cone, 2005). Ghrelin activates arcuate NPY/AgRP neurons, while inhibits POMC neurons by increasing GABA release onto them (Cowley et al., 2003; Zigman and Elmquist, 2003). Ghrelin exerts its biological actions on energy balance through the growth hormone segretagogue receptor (GHSR) that is present in hypothalamic nuclei, but also in the AP, where two different subpopulation of neurons coexist, one of which is depolarized by ghrelin, whereas the second
Amylin is an anorexigenic hormone co-secreted with insulin by pancreatic
β-cells in response to meal-related stimuli (Young, 2005). Amylin reduces food intake at near physiological doses via a reduction of meal size (Lutz et al., 1994). Numerous studies demonstrated that AP mediates amylin’s suppressive effect on food intake; in fact, while vagal afferents are not required for amylin’s anorexigenic actions, APX blocks feeding inhibitory action of amylin (Lutz et al., 2001). Amylin receptors are highly expressed in the AP and electrophysiological studies demonstrate that amylin exert strong excitatory effects in 44% of the recorded spontaneously active AP neurons; these effects were blocked by the amylin receptor antagonist AC187 and appear to be mediated by the intracellular second messenger cyclic GMP (Riediger et al., 2001). Moreover, amylin induces the expression of immediate early gene c-Fos, a marker of neuronal activation, in the AP neurons and about 50% of these neurons are noradrenergic (Potes et al., 2010). Interestingly, in the AP at least a proportion of the neurons responsive to amylin are also glucose responsive (Riediger et al., 2002). Recent studies indicated that amylin reduced eating in rats under euglycemic and hyperglycemic, but not hypoglycemic, conditions (Lutz, 2012).
CCK is postprandially secreted from the mucosa of the small intestine and its
systemic delivery suppresses food intake in both animals models and humans (Gibbs and Smith, 1977; Kissileff et al., 1981). CCK receptors are expressed in the brainstem and hypothalamus, but the anorectic effects of CCK are critically mediated by vagal sensory neurons that project into the NTS/AP (Moran et al., 1997). NTS POMC neurons are activated by CCK and brainstem MC4R signalling is required for CCK-induced suppression of appetite (Fan et al., 2004). Moreover, other studies demonstrate that ghrelin attenuates, and leptin synergistically potentiates, the effect of CCK on appetite (Barrachina et al., 1997; Lee et al., 2011).
GLP-1 is another peripheral anorectic signal manly secreted from intestinal
mucosa that acts directly in the CNS to control food intake; GLP-1 levels are high following a meal and are low under fasting conditions. GLP-1 receptor is expressed in key CNS areas involved in the control of energy balance such as the hypothalamus and brainstem (Merchenthaler et al., 1999).
Peptide YY similarly to GLP-1, is manly released from intestinal mucosa in
response to nutrient ingestion (Adrian et al., 1985). It exerts anorexigenic effects in the ARC (Challis et al., 2003), but also in the brainstem and vagal-brainstem circuits (Koda et al., 2005). The peripheral delivery of this peptide has been shown to increase neuronal activity in NTS and AP neurons (Blevins et al., 2008).
2.2 The Ciliary Neurotrophic Factor (CNTF)
The ciliary neurotrophic factor (CNTF) is a peptide originally described by Adler et al., in 1979 for its ability to support survival of parasympathetic neurons from chick ciliary ganglion. It exerts important effects on neuronal and glial precursors during the development of the central and peripheral nervous system, and on the postnatal maintenance of sensory, sympathetic and motor neurons (Sendtner et al., 1994; Sleeman et al., 2000). Its expression is particularly high in peripheral nerve Schwann cells and in cerebral white matter astocytes (Stöckli et al., 1991; Guthrie et al., 1997).
CNTF is a 23 kDa molecule of 200 amino acid belonging to the interleukin-6 (IL-6)-cytokine family. This family includes IL-6, interleukin 11 (IL-11), leukemia inhibitory factor (LIF), oncostatin M (OSM), cardiotrophin-1 (CT-1), leptin, cardiotrophin-like-cytokine (CLC) and neuropoietin (Bauer et al., 2007). These multifunctional cytokines exhibit a similar helical structure characterized by four antiparallel α-helices (Bazan, 1990). Members of the IL-6 family activate the signal transducing receptor protein, glycoprotein 130 (gp130) and for this reason these molecules can display overlapping biological activities (Heinrich et al., 2003). Indeed, cytokines act on many different target cells (pleiotropism) and frequently affect the action of other cytokines in an additive, synergistic or antagonistic manner; their actions are often redundant, i.e. similar biological responses can be achieved by several different cytokines (Heinrich et al., 1998).
Cytokines belonging to the IL-6 family usually signal through tyrosine kinases of the JAK family and transcription factors of the STAT family, but they can also activate the mitogen-activated protein kinase (MAPK) signal or a cascade involving PI3K (Heinrich et al., 2003). CNTF binds to a three-part receptor complex (CNTFR) consisting of the ligand-specific binding subunit receptor α (CNTFRα), which is attached to the cell membrane by a glycosylphosphatidylinositol linkage, and the signal-transducing subunits gp130 and LIF receptor b (LIFRb) (Ip et al., 1993).
CNTF binding to CNTFRα triggers gp130 and LIFRb heterodimerization, giving rise to the active receptor complex (Simi and Ibanez, 2010); this
receptor complex activates the Janus family of tyrosine kinases (Jak1/Jak2), thereby leading to tyrosine phosphorylation, dimerization and nuclear translocation of signal transducers and activators of transcription (STATs), mainly STAT3 (Bonni et al., 1997). Phosphrylated STAT3 (PSTAT3) dimers bind to specific response elements in DNA promoter regions to activate the transcription of target genes (Fig. 3). Besides STAT3, six other members of STAT family have been described: STAT1, STAT2, STAT4, STAT5a and STAT5b, and STAT6 (Cattaneo et al., 1999; Kisseleva et al., 2002). Activation of JAK/STATs stimulates cell proliferation, differentiation, migration and inhibits apoptosis (Kisseleva et al., 2002). The signal transducers gp130 and LIFR share sequence similarity and signalling capabilities with the leptin receptor and leptin acts through the same signalling pathway (Gloaguen et al., 1997).
CNTF shows distinctive features compared to other growth factors acting on the nervous system. First, its amino acid sequence lacks a signal peptide, suggesting a citosolic rather than a vesicular-mediated secretory process (Lin et al., 1989); therefore, its release from cells requires a non-conventional and as yet unidentified mechanism. In addition, CNTF is hardly detectable during embryonic development and its synthesis begins, or increase greatly, in the nervous system after birth, reaching adult levels during the postnatal period (Stöckli et al., 1991). Masu and colleagues in 1993 firstly demonstrated that the ablation of the CNTF gene by homologous recombination resulted in a progressive atrophy and loss of motor neurons in adult mice, but this modification did not affect embryonic development and first postnatal weeks of life (Masu et al., 1993). On the contrary, CNTFRα null mice died within 24h postnatally because of a suckling defect caused by severe motor neuron deficits in the brainstem and spinal cord motor nuclei (DeChiara et al., 1995). This evidence suggests the existence of a second putative ligand for the CNTF receptor whose role is critical at least in embryonic and neonatal periods (Derouet et al., 2004).
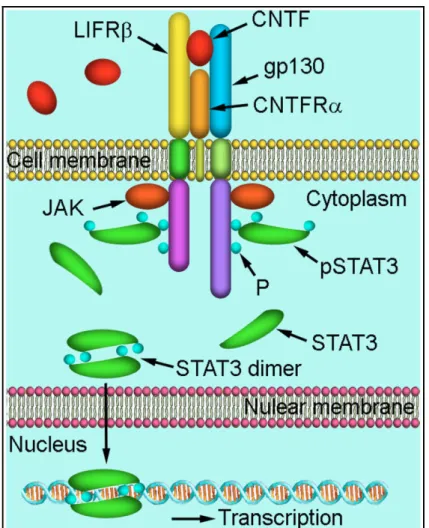
Fig. 3 - Schematic illustration of CNTF signaling through STAT3. CNTF
binds to the receptor complex of CNTFRα, gp130, and LIFRβ and activates JAK kinase. Activated JAK kinase phosphorylates tyrosine residues (P) of the intracellular domain of gp130 and LIF, which provide docking sites for STAT3. After STAT3 is phosphorylated at the docking sites by JAK kinase, phospho-STAT3 (pSTAT3) forms dimers and translocates to the nucleus to induce gene transcription (Wen et al., 2012).
2.2.1. CNTF and CNTFRα distribution
CNTF was described for the first time as present in high amount in chick ciliary neurons (Adler et al., 1979); subsequent studies demonstrated CNTF presence and bioactivity in the adult rat sciatic nerve and in peripheral nerves of rabbit and rat (Manthorpe et al., 1986).
Immunohystochemical studies on rats and mice showed a high expression of CNTF in glial cells of central and peripheral nervous system, in particular in peripheral Schwann cells and in white matter astrocytes (Stöckli et al., 1991;
Sendtner et al., 1992; Henderson et al., 1994). CNTF was also detected in the olfactory bulb and optic nerve (Stöckli et al., 1991).
Whereas CNTF expression is low in normal CNS grey areas, it is up-regulated after mechanical or ischemic lesions (Guthrie et al., 1997; Lee et al., 1997b), suggesting a role of CNTF in the protection of injured neurons and of axonal projections (Stöckli et al., 1991; Dallner et al., 2002).
CNTFRα shows a more widespread expression respect to its ligand and is widely present in the hypothalamus, thalamus, brainstem, cerebral cortex, olfactory bulb and other areas (Lee et al., 1997a). CNTFRα is expressed mainly from neurons, in both the developing and adult nervous system (Ip et al., 1993; Lee et al., 1996; MacLennan et al., 2000); the expression of this receptor by cultured astrocytes suggested that glial cells might also represent CNTF targets (Rudge et al., 1994).
CNTFRα was also found in peripheral organs, such as heart, lungs, skeletal muscle, adrenal gland, skin, kidney, liver and testis (MacLennan et al., 2000). CNTF injected intraperitoneally or intravenously may reach distinctive areas of the brain parenchyma by diffusing through the circumventricular organs which lacks the BBB; as a consequence, detection of nuclear P-STAT3 immunoreactivity after CNTF treatment has been proposed as a reliable tool for the characterization of CNTF responsive cells, bearing the CNTFRα (MacLennan et al., 2000). In the hypothalamus of mice and rats systemic injection of recombinant CNFT induced P-STAT3 expression in the brain meninges and in some perivascular cells, in ARC neurons, in the ependymal wall of the ventricular system and in the circumventricular organs, such as the vascular organ of the lamina terminalis (VOLT) and the ME (Lambert et al., 2001; Anderson et al., 2003).
Recent immunohistochemistry studies provide evidence that tanycytes and ependimal cells of the third ventricle produce CNTF and contain its functional receptor. The close spatial relationship of producing and CNTF-responsive cells in the ependymal layer is consistent with the possibility that the mouse ependyma is provided with CNTF-dependent paracrine and/or
2.2.2. CNTF and energy balance
Because CNTF can promote the survival of motor neurons (Sendtner et al., 1990), it has been tested as a therapeutic agent for amyotrophic lateral sclerosis (ALS). Unfortunately, CNTF did not alter disease progression, leading instead to unexpected side effects like weight loss and anorexia (Miller et al., 1996). However, most of the patients developed anti-CNTF antibodies (ALS CNTF Treatment Study Group, 1996). Some years later, a variant of CNTF with improved potency and stability, Axokine (CNTFAx15), was tested in a randomized dose-ranging trial on obese patients, leading to a significant weight loss after treatment. Unfortunately, nearly 70% of the treated subjects again developed antibodies against Axokine after approximately three months of treatment (Ettinger et al., 2003) and the trials were stopped.
From these observations, many research groups started to investigate the role of CNTF in energy balance and they described the ability of this cytokine to mimic leptin action, reducing appetite and activating similar molecular pathways in the CNS (Anderson et al., 2003; Kelly et al., 2004). In addition to weight loss, CNTFAx15 administration lowered hyperinsulinemia, hyperglycemia, and hyperlipidemia associated with obesity (Gloaguen et al., 1997; Lambert et al., 2001; Watt et al., 2006).
Studies aimed at elucidating the mechanism of action of exogenously administered CNTF, or Axokine, stressed the role of this molecule in the hypothalamus and it was suggested that the anorectic response to CNTF could be due to a leptin-like action in the hypothalamus via activation of Jak1/Jak2-STAT3 signaling in the ARC (Lambert et al., 2001).
Interestingly, CNTF can also be effective in suppressing food intake in conditions in which leptin is ineffective, like in diet-induced obese mice, in ob/ob and db/db mice and in MC4R- deficient mice (Gloaguen et al., 1997; Lambert et al., 2001; Xu et al., 1998). Moreover, CNTFRα deletion in hypothalamic leptin receptor-expressing neurons failed to impair the anorectic effect of CNTFAX15 (Stefater et al., 2012); thus CNTF may also act on hypothalamic targets that are partially different from leptin’s ones.
Another important benefit of central administration of CNTF, or CNTF analogs, is the ability to remain effective after therapy has terminated: in a study by Lambert and co-workers (2001), mice maintained a decreased body weight after the CNTF treatment was finished. One possible explanation is that the delay in weight gain could be linked to neurogenesis in the hypothalamus. In fact, central administration of CNTF was found to promote cell proliferation in the adult mouse hypothalamus and many of these newborn cells expressed neuronal markers and can respond to leptin. In addition, killing the newborn cells blocks the long-term, but not the short term, effects of CNTF on body weight (Kokoeva et al., 2005).
In the normal mouse hypothalamus, CNTF is expressed in the ependyma of the third ventricle and in astrocytes (Severi et al., 2012). Subsequent studies showed that CNTF expression significantly increases in the ependymal layer and tanycytes of the tuberal and mammillary regions of mice rendered obese by an high fat diet (HFD) and that it decreases in mice kept in calorie restriction (CR) conditions. Interestingly, changes in CNTF expression were paralleled by changes in its receptor, CNTFRα. Collectively, these data suggest that in mice an HFD is associated with increased CNTF signalling in the hypothalamus, whereas CR is associated with reduced hypothalamic CNTF signalling. These findings support the notion that CNTF is a novel, glial-derived modulator of the energy balance and upregulation of CNTF signalling in the hypothalamus of HFD mice can be a compensatory mechanism counteracting the positive energy balance (Severi et al., 2013). In contrast, ob/ob mice showed no evidence of increased hypothalamic CNTF signalling; this suggests that leptin does not affect hypothalamic CNTF signalling and that diet composition may affect CNTF expression and signalling more than food amount in the mouse hypothalamus. (Severi et al., 2013).
CNTF has metabolic effects not only in the brain, but also in peripheral tissues, such as muscle, liver and adipose tissue. In the skeletal muscle, it improves insulin sensitivity enhancing oxidation of fatty acids and decreasing the synthesis and deposition of lipids and metabolites (Watt et al., 2006).
tissue (Zvonic et al., 2003) and studies with db/db mice treated with recombinant CNTF, showed an up-regulation of UCP1 expression in brown adipose tissue (Liu et al., 2007). Ott and colleagues (2002) demonstrated also a direct role for CNTF signalling in brown adipocytes in vitro, with treatment with CNTF leading to the phosphorylation of STAT3 and p42/44 MAP kinase. In conclusion, CNTF has a dual action: it reduces appetite at the level of hypothalamus and has metabolic effects on peripheral tissues, increasing insulin sensitivity on muscle and liver and stimulating thermogenesis in the adipose tissue (Matthews and Febbraio 2008).
Collectively these data suggest that endogenous CNTF has an important role in regulating energy homeostasis, and that unravelling its mechanism of action may reveal novel targets for the pharmacological treatment of obesity.
3. AIMS OF THE PROJECT
The experimental evidences detailed above suggest that CNTF, expressed by hypothalamic glial cells and tanycytes, could be a novel, endogenous, glial-derived peptide involved in the control of energy balance. Moreover, the strong mismatch between CNTF-producing and CNTF-responsive cells in coronal sections of the mouse tuberal hypothalamus suggests that CNTF could be a circulating satiety factor. In order to better elucidate the action of CNTF on mouse hypothalamus, this study aimed to assess whether circulating CNTF, besides activating STAT3, also activates other cellular pathways.
Furthermore, we tested the hypothesis that, similar to other better-characterized satiety factors, circulating CNTF may act not only at hypothalamic level, but also on brainstem centers, that are further important brain regions involved in the regulation of energy homeostasis.
4. MATERIALS AND METHODS
4.1. Animals and experimental conditions
Adult Swiss CD-1 mice and adult ob/ob, db/db, and wild type C57BL/6 mice were purchased from Charles River Laboratories (Calco, Italy). CNTF-deficient mice, where the CNTF gene has been eliminated by homologous recombination (Masu et al., 1993), were provided by Dr. M. Sendtner (Wuerzburg, Germany). All animals were housed in plastic cages under constant environmental conditions in a 12 h light/dark cycle at 22 °C. They had ad libitum access to food and water and handling was limited to cage cleaning. They were killed for experimental procedures at 12-14 weeks of age. All efforts were made to minimize animal suffering and to reduce the number of animals used. Experiments were carried out in accordance with Italian Istitutional Guidelines (EC Council Directive 86/609/EEC of 24 November 1986).
4.2. Tissue processing
For morphological analyses, mice were anesthetized with 2,2,2-tribromoethanol (Avertin) (Sigma-Aldrich, Saint Louis, MO, USA) and perfused transcardially with 4% paraformaldehyde in 0.1 M phosphate buffer (PB), pH 7.4. Brains were carefully removed from the skull, postfixed with the same fixative solution for 24 h at 4°C and washed in PB. Free-floating coronal sections (40-µm-thick) of brainstem and hypothalamus were cut with a Leica VT1200S vibratome (Leica Microsystems, Vienna, Austria) and kept in phosphate buffered saline (PBS), pH 7.4, at 4°C until use. Adjacent brain sections were used to identify the exact location of individual hypothalamic nuclei and areas by Nissl staining (Paxinos and Franklin, 2001).
Before sacrifice, some mice received a single intraperitoneal injection (0.3 mg/kg of body weight) of recombinant rat CNTF (R&D Systems, Minneapolis, MN, USA) and/or mouse recombinant leptin (Sigma-Aldrich, Saint Louis, MO, USA; 3 mg/kg of body weight) for different periods of time
(see Results). Control mice were injected with pyrogen-free saline. The volumes of CNTF, leptin and vehicle ranged from 180 to 220 µl according to body weight; injections were performed using a Hamilton syringe.
For RT-qPCR assays animals were anesthetized and decapitated, the brain was rapidly removed from the skull and placed with its ventral side up in a pre-cooled adult mouse coronal brain matrix (ASI Instruments, Warren, MI, USA). A 2 mm-thick midsagittal slice was cut from each brain; the AP and the bottom portion of the tuberal hypothalamus, containing the ME and the ARC, were micropunched with a size 1.0 mm Harris Uni-Core device (Electron Microscopy Sciences, Hatfield, PA, USA). Samples were snap-frozen in liquid nitrogen and stored at -80°C. The remaining part of the slice was fixed, cut and stained according to standard procedures to assess whether micropunching was successful. Samples from sections where the AP or the mediobasal hypothalamus were not precisely dissected out were discarded.
4.3. Primary antibodies
The primary antibodies used in the study are shown in Tab.1:
Description Marker Host/isotype IHC IF Manufacturer
anti-phospho- specific-(Tyr701)-STAT3 Rabbit/IgG Goat/IgG 1:1000 1:1000 1:700 1:700 9131, Cell Signaling Technology Inc. (Beverly, MA, USA) Sc-7993, Santa Cruz Biotech. (Santa Cruz, CA, USA) Signaling
anti-phospho- specific-(Tyr705)-STAT5 Rabbit/IgG 1:1000 1:700 9314, Cell Signaling Technology Inc Choline Acetyltransferase (ChAT)
Rabbit/IgG 1:1000 AB143, Merk Millipore (Darmstadt, Germania) Dopamine β Hydroxylase (DBH) Rabbit/IgG 1:500 PA5-34664, Thermo Fisher Scientific (Waltham, Massachusetts, USA) Glial Fibrillary Acidic Protein (GFAP) Mouse/IgG 1:1000 G3893, Sigma-Aldrich (St Louis, MO, USA) Glutamic acid decarboxylase 67 (GAD67) Mouse/IgG 1:800 MAB 5406, Merk Millipore Human Neuronal
Protein (HuC/D) Mouse/IgG 1:50 A21271, Life technologies (Carlsbad, CA,
USA)
Nestin Mouse/IgG 1:300 MAB353, Merk Millipore Tryptophan hydroxylase 2 (TPH2) Rabbit/IgG 1:700 51124, Cell Signaling Technology Inc. Cell Marker
Vimentin Goat/IgG 1:300 sc-7557, Santa Cruz Biotech.
Activity marker
c-Fos Goat/IgG 1:5000 1:4000 sc-52-G, Santa Cruz Biotech.
anti-CNTF CNTF Goat/IgG 1:100 1:50 AF-557-NA, R&D Systems
(Minneapolis, MN, USA)
Tab.1 - Primary antibodies used for immunohistochemistry (IHC) and
immunofluorescence (IF).
4.4 Peroxidase immunohistochemistry
Immunohistochemical detection of CNTF was performed according to standard procedures. In brief, free-floating sections were reacted with 0.3% H2O2 (in dH2O; 30 min) to block endogenous peroxidase, rinsed with PBS and incubated with 3% normal serum blocking solution (in PBS; 60 min). Then they were incubated with the primary antibody in PBS, overnight at 4°C. After a thorough rinse in PBS, sections were incubated in 1:200 v/v biotinylated secondary antibody solution (in PBS; 30 min), rinsed in PBS and incubated in avidin-biotin peroxidase complex (ABC Elite PK6100, Vector), washed several times in PBS and finally incubated in 3,3’ diaminobenzidine tetrahydrochloride (0.05% in 0.05 M Tris with 0.03% H2O2; 5 min). After immunohistochemical staining, sections were mounted on slides, air-dried, dehydrated in ethanol, cleared with xylene and covered with Eukitt. Staining was not detected when the primary antibody was omitted.
Unmasking procedures were used for P-STAT3, P-STAT1 and P-STAT5 immunohistochemical detection (Frontini et al., 2008). Free-floating sections were reacted with 1% NaOH and 1% H2O2 (20 min), 0.3% glycine (10 min) and 0.03% sodium dodecyl sulphate (10 min). After rinsing in PBS, they were blocked with 3% normal goat serum (in 0.2% Triton X-100; 60 min) and incubated with the primary antibodies at appropriate dilutions (Tab. 1) in PBS, overnight at 4°C. The next day, the procedure was performed as described above.
4.5. Immunofluorescence and confocal microscopy
For double-labelling experiments, free-floating sections were processed according to the P-STAT3 protocol until the incubation with the primary antibody, when P-STAT3 was evaluated. In all other double labelling experiments standard immunoistochemical protocol was used. Sections were incubated overnight in a mixture of two primary antibodies raise in different species and diluted as shown in Tab.1.
The next day sections were washed twice with PBS and incubated in a cocktail of fluorophore-linked secondary antibodies at a dilution of 1:100 v/v in PBS for 1 h at room temperature. The secondary antibodies were Alexa Fluor 488 donkey anti-goat IgG, Alexa Fluor 488 donkey anti-mouse IgG, Alexa Fluor 555 donkey anti-mouse IgG, Alexa Fluor 647 donkey anti-mouse IgG and Alexa Fluor 555 donkey anti-rabbit IgG (all from Invitrogen, Carlsbad, CA, USA). All blocking solutions were done with normal donkey sera.
Sections were subsequently washed twice with PBS, mounted on standard glass slides, air-dried and coverslipped using Vectashield mounting medium (Vector). Sections were viewed under a motorized Leica DM6000 microscope at different magnifications. Fluorescence was detected with a Leica TCS-SL spectral confocal microscope (Leica Microsystems) equipped with an Argon and He/Ne mixed gas laser. Fluorophores were excited with the 488 nm, 543 nm and 649 nm lines and imaged separately. Images (1024 x 1024 pixels) were obtained sequentially from two channels using a confocal pinhole of 1.1200 and stored as TIFF files. Brightness and contrast of the final images were adjusted using Photoshop 6 (Adobe Systems, Mountain View, CA, USA).
4.6. Morphometric Analysis
The percentage of STAT3-positive cells also expressing STAT1, P-STAT5 or cell markers (listed in Tab. 1), was calculated in 5 alternate double-stained coronal sections of the brainstem and of the tuberal portion of the hypothalamus from 3 mice per experimental group. For all measurements, the results were expressed as the mean ± standard error of the mean (SEM).
4.7. RNA isolation, cDNA Synthesis, and RT-qPCR
Total RNA was extracted from micropunched tissue after homogenization using RNeasy Micro kit (Qiagen, Milano, Italy) according to the manufacturer’s instructions. Three separate micropunches of the AP and mediobasal hypothalamus were pooled by pipetting samples onto the same purification column to increase RNA yield. The quality and quantity of isolated total RNA was evaluated using the 2100 BioAnalyzer (Agilent Technologies, Milano, Italy). One microliter from each isolated RNA sample was analyzed with RNA 6000 Pico LabChips (Agilent Technologies). To determine mRNA levels, 500 ng of RNA was reverse-transcribed with a High-Capacity cDNA RT Kit with RNase Inhibitor (Applied BioSystems, Foster City, CA, USA) in a total volume of 20 µl. Real time gene expression was analyzed in triplicate by using TaqMan Gene Expression Assays (Applied BioSystems) as listed: TATA box binding protein (TBP): Mm00446973_m1; CNTF: Mm00446373_m1; CNTFRα: Mm00516693_m1; POMC: Mm00435874_ml; Vimentin: Mm01333430_ml, and Master Mix TaqMan (all from Thermo Fisher Scientific). The efficiency of each assay was evaluated using a standard curve with serial dilutions of a known template, and the equation of the linear regression line, along with the coefficient of determination (R2), were calculated. The reaction efficiency was 96.84% for CNTF, 92.56% for CNTFR, 93.71% for POMC, and 95.4% for vimentin. Reactions were carried out in a Step One Plus instrument (Thermo Fisher
followed by 40 cycles of 95 °C for 15 sec and 60 °C for 20 sec. In order to rule out genomic contamination, a control reaction where reverse transcriptase was omitted in the amplification mixture was included for each sample. Relative mRNA expression was determined by the -Ct method (2-∆Ct) using TBP levels as an endogenous control. Differences in starting total RNA and in cDNA synthesis efficiency among samples were normalized using TBP expression. Data are presented as histograms + SEM.
5. RESULTS
5.1. CNTF-responsive cells in the hypothalamus
In the mouse hypothalamus, CNTF administration activates STAT3 in arcuate nucleus neurons, in ME cells and diffusely in the third ventricle ependyma (Severi et al., 2012). We demonstrated that besides STAT3, other STAT isoforms are activated by CNTF. In particular, immunohistochemical analyses of coronal brain sections from treated and control mice were performed using polyclonal anti-P-STAT1 antibody. P-STAT1 immunoreactive cells were absent in control mouse, suggesting that STAT1 signaling is not activated in the hypothalamus in basal conditions. By contrast, systemic injection of recombinant CNTF induced STAT1 phosphorylation in cells of the ME (Fig.
4A) and other brain circumventricular organs, including the vascular organ of
the lamina terminalis (VOLT, Fig. 4B) and the subfornical organ (Fig. 4C). In particular, in the ME of treated mice P-STAT1 staining was found in the ependymal cells making up the floor of the third ventricle (roof of the ME) and in those forming the ventrolateral recesses of the third ventricle and facing the medial portion of the ARC (Fig. 4A, D and E); several cells scattered throughout the ME layers were also positive (Fig. 4D). P-STAT1 staining was mainly detected in cell nuclei, as also confirmed by double-staining and confocal microscopy analysis with the TO-PRO3 nuclear stain (Fig. 4F). However, in some cells, the cytoplasm was also variably stained; this was especially evident in the ependymal cells of the ventrolateral recesses of the third ventricle, where P-STAT1-positive tanycyte-like cells exhibited long, faintly positive processes extending to the adjacent nervous tissue (Fig. 4E). Positive cells in the ME usually displayed an elongated nucleus without evident nucleoli (Fig. 4D).
Double-staining experiments and confocal microscopy demonstrated that P-STAT1-positive ependymal cells on the floor of the third ventricle were nestin-positive β2-tanycytes (Fig. 4G-I), whereas those forming the
positive for nestin (25.20% + 2.77, n=5; Fig. 4G-I, insets) or vimentin (13.20% + 0.84, n=5; Fig. 4J-L) and only occasionally expressed GFAP, the marker of mature astrocytes (Fig. 5A-C); their morphological features were similar to radial glial cells, with long projections spanning the ME, from the ependyma to the pial layer. None of these cells co-localized with the neuronal markers NeuN or HuC/D (Fig. 5D-F).
We demonstrated that CNTF treatment activated also P-STAT5 in mouse hypothalamus: as previously reported in rats (Lerant et al., 2001; Mutze et al., 2007) and mice (Ladyman et al., 2012), the tuberal hypothalamus of control mice contained a variable number of faintly P-STAT5-positive neurons, mainly located in the ARC but also scattered in the ventromedial and dorsomedial nuclei and lateral hypothalamus. However, no P-STAT5 staining was detected in the ME, whereas punctate immunolabeling was frequently found in its internal portion, suggesting the presence of P-STAT5 immunoreactive axons (Fig. 6A). As previously observed with P-STAT1, CNTF injection induced P-STAT5 nuclear expression in the VOLT, the subfornical organ and the ME, where ependymal and glial cells exhibited a variable degree of nuclear staining (Fig. 6B). However, unlike P-STAT1 staining, some astrocytes-like cells in the medial portion of the ARC also appeared to be strongly responsive to CNTF (Fig. 6B). Co-localization studies confirmed that ependymal CNTF-responsive cells were nestin-positive β2-tanycytes (Fig. 6C-E) and vimentin-positive β1-β2-tanycytes (Fig. 6F-H), whereas some of those detected in the ME were nestin-positive (32.80 + 2.28, n=5; Fig. 6C-E) or vimentin-positive (16.00 + 1.58, n=5; Fig. 6F-H) immature glial cells. In the ARC of treated mice, the P-STAT5-positive cells were GFAP-positive astrocytes (Fig. 6I-K).
Fig.4 – P-STAT1 immunohistochemistry in coronal sections of mouse brain.
In CNTF treated mice, P-STAT1 staining was detected in ME (A), VOLT (B) and subfornical organ (SFO; C); insets show P-STAT1 immunohistochemistry in the corresponding structures of control mice. In the ME, P-STAT1 staining was detected in cell nuclei of ependymal (ep) and underlying cells (D and E); ependymal cells of the ventrolateral wall of the third ventricle (3V) exhibited long P-STAT1-positive processes (arrowheads). D and E are enlargements of the areas framed in A. In F is represented the co-localization of P-STAT1 with the nuclear stain TO-PRO3. By double-staining experiments and confocal
Fig.5 – Double label confocal microscopy showing some P-STAT1-positive
ME cells also expressing GFAP (A-C, arrowheads). None of these cells co-localized with the neuronal marker HuC/D (D-F, arrowheads).
Fig.6 - P-STAT5 immunohistochemistry in coronal sections of mouse brain. In
control mice (A) weak P-STAT5 nuclear staining was detected in neurons of the ARC and in fibers of ME (arrowheads). In CNTF-treated mice (B), P-STAT5 positive cells appeared along the ependyma (ep), in the ME and in the ARC. By double-staining experiments and confocal microscopy, P-STAT5-positive ependymal (arrowheads) and underlying (arrows) cells were also
The percentage of STAT1- and STAT5-positive cells also exhibiting P-STAT3 immunoreactivity in the tuberal hypothalamus of treated mice was evaluated by double staining experiments and confocal microscopy. Results showed that 92.62% + 4.75 (n=5) of P-STAT1-positive β-tanycytes also exhibited P-STAT3 immunoreactivity, and 72.08% + 4.82 (n=5) of P-STAT1-immunoreactive ME cells were also positive for P-STAT3 (Fig. 7A-D). Concerning P-STAT5, virtually all ependymal and ME cells expressing it in treated mice were also positive for P-STAT3 (Fig. 7E-G).
Thus, systemic CNTF administration leads to activation of multiple STAT isoform in β-tanycytes and ME glial cells, which both exhibit markers of immaturity and plasticity; on the contrary, in the ARC neurons and in the few ME neurons found just below the ependyma only STAT3 is activated (Fig.
7A-D).
To obtain further confirmation of the CNTF action in β-tanycytes and ME glial cells, the hypothalamic expression of P-STAT1, P-STAT5 and c-Fos, a marker of neuronal activation, was evaluated in control and treated mice 20, 40, 80 and 120 min after the injection. Results showed that as early as 20 min from treatment, ME glial cells already displayed P-STAT1 and P-STAT5 immunoreactivity, whereas the ependymal cells stained faintly or patchily (Fig. 8A and E). Full activation of the Jak-STAT1 and -5 pathways was found at 40 min (Fig. 8B and F) and 80 min (Fig. 8C and G). Interestingly, at 80 min c-Fos staining was also detected in β-tanycytes and ME cells (Fig. 9B) of treated but not of control mice (Fig. 9A). Double-labeling experiments demonstrated that in treated mice numerous STAT1 (Fig. 9C-E) and P-STAT5-positive (Fig. 9F-H) cells also expressed c-Fos, suggesting that CNTF determines immediate early gene activation. At 120 min P-STAT immunoreactivity declined in tanycytes and ME cells (Fig. 8D and H) whereas some GFAP-positive astrocytes mainly located on the lateral border of the ME and in the inferomedial portion of the ARC exhibited P-STAT5 and P-STAT1 immunoreactivity (Fig. 8D,H and I-K). At 120 min, c-Fos continued to be detected not only in tanycytes and ME cells, but also in the ARC. In conclusion, the action of CNTF in β-tanycytes and ME glial cells is time-dependent and induces c-Fos expression.
Fig.7 – Multiple labelling and confocal microscopy analysis of the tuberal
hypothalamus from a CNTF-treated mouse. CNTF activated STAT1 (A) and STAT3 (B) in ependymal (ep) and ME cells. Some HuC/D-positive neurons (B-C, some indicated by arrowheads) in the ME and ARC were also positive for P-STAT3 but not for P-STAT1 (D). In the botton panels, all ependymal and ME cells co-expressed P-STAT5 and P-STAT3 (E-G). Some cells
Fig.8 – P-STAT1 (A-D) and P-STAT5 (E-H) immunohistochemistry at
different timepoints after CNTF-administration. At 120 min from CNTF administration, some cells in the ARC exhibited P-STAT1 and P-STAT5 positivity (D and H, arrows); these cells co-localized with GFAP (I-K, arrows). Bar: A-H= 180 µm; I-K=30 µm.
Fig.9 – c-Fos immunohistochemistry in the mouse ME. In control animal (A),
faint c-Fos staining was detected in some scattered cell nuclei, whereas at 80 min from CNTF administration (B) ependymal (ep) and subependymal ME cells and few cells in the Arc showed c-Fos expression. By double-staining experiments, P-STAT1-positive (C-E) and P-STAT5-positive (F-H) ependymal (arrows) and ME (arrowheads) cells also expressed c-Fos. Bar: A and B=150 µm; C-H=25 µm.
5.2. Mismatch of CNTF-responsive and CNTF-producing cells in the tuberal hypothalamus
As reported previously (Severi et al., 2012, 2013), CNTF was mainly expressed in the ependyma bordering the upper portion of the lateral wall of the third ventricle, where numerous α-tanycytes were also stained. CNTF was never expressed in underlying β-tanycytes or ME cells. As a result, there was always a considerable mismatch between overlying CNTF-producing cells and underlying CNTF-responsive cells (Fig. 10A-C). This suggests that in physiological conditions ME β-tanycytes and glial cells may be stimulated by α-tanycyte-derived CNTF secreted into the cerebrospinal fluid and/or that they may be selectively targeted by circulating CNTF.
Fig.10 – P-STAT1/CNTF double labelling of mouse tuberal hypothalamus
showing the mismatch between CNTF-responding (A) and CNTF-producing (B) cells 40 min after CNTF injection.
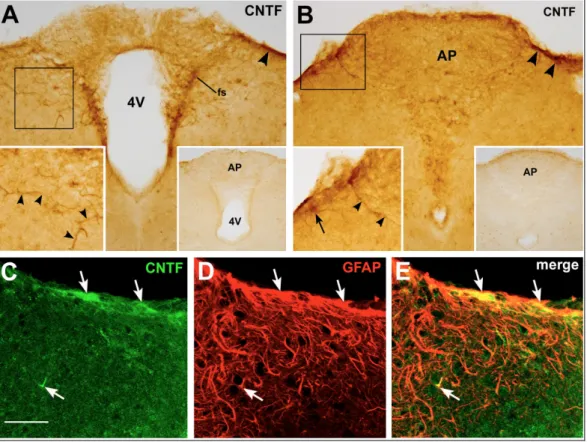
5.3. CNTF-responsive cells in the mouse AP
Similarly to what observed in the hypothalamus, CNTF administration induced STAT3, STAT1 and STAT5 phosphorylation also in the AP, where the nucleus of numerous cells was strongly stained (Fig. 11A-C). On the contrary, in the brainstem parenchyma of vehicle-treated mice, cells exhibiting nuclear P-STAT3, P-STAT1 or P-STAT5 were few, sparse and weakly labelled. Double-staining experiments, performed at different rostrocaudal levels, showed that P-STAT3 staining was ubiquitous and was also detected in the border of the AP, the funiculus separans, whereas immunoreactivity for P-STAT1 and P-STAT5 involved a smaller number of cells, mainly located in the central portion of the AP (Fig. 11D-F).
In addition, the majority of CNTF-responding cells were positive for at least two STAT isoform. In particular, 76.91% + 3.20 (n=3) of STAT3-reactive cells were also positive for P-STAT1 (Fig. 11G-I), and 77.86% + 1.31 (n=3) of STAT3-positive cells were also positive for STAT5 (Fig. 11J-L). Conversely, all STAT1- and P-STAT5-positive cells were also positive for P-STAT3. Therefore, STAT3 is the main transduction factor activated by CNTF in the mouse AP, and several CNTF-responding cells activate STAT3 as well as STAT1 and/or STAT5.
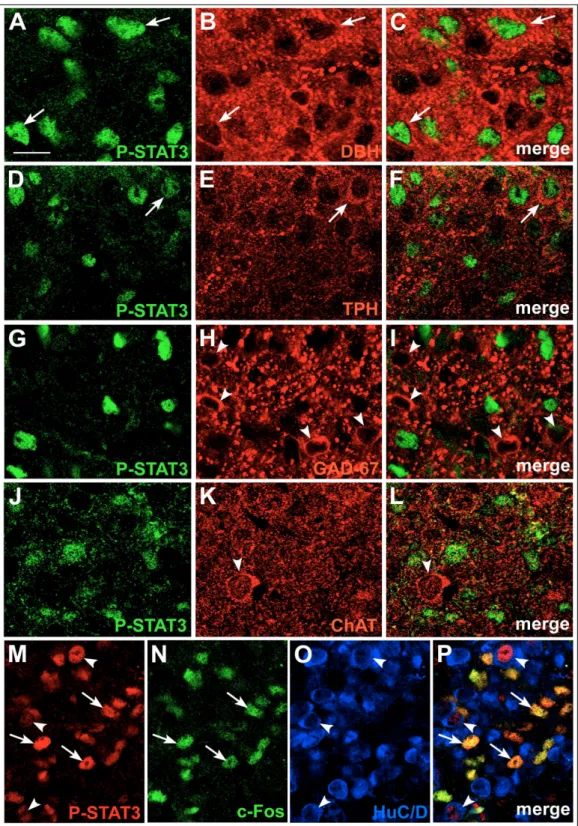
To characterize the phenotype of CNTF-responsive cells in the AP, double-immunostaining and confocal microscopy experiments were performed using mature and immature neuronal and glial markers (Tab. 1). Results showed that 14.27% + 0.25 (n=3) of P-STAT3-positive cells were HuC/D-positive neurons (Fig. 12A-C), whereas 11.97% + 0.11 (n=3) co-localized with nestin (Fig. 12D-F), 11.51% + 1.42 (n=3) with vimentin (Fig. 12G-I), and 6.57% + 0.81 (n=3) with GFAP (Fig. 12J-L). Notably, since nestin, vimentin, and GFAP immunoreactivity was seen in cell processes rather than cell bodies, the extent of co-localization was probably underestimated. These data showed that circulating CNTF acts on both neurons and glial cells of the AP, where a considerable proportion of CNTF-responsive cells exhibit immaturity markers such as nestin and vimentin; this situation is highly reminiscent of the action of CNTF on the hypothalamic ME.