For Peer Review
A FRESH APPROACH TO ENVIROMENTAL MANAGEMENT: DO ALL COMPANIES HAVE THE SAME CONTEXT INFLUENCE,
DEVELOPMENT AND PERFORMANCE?
Journal: Business Strategy and the Environment Manuscript ID: Draft
Wiley - Manuscript type: Research Article
Keywords: environmental approach, institutional support, environmental performance, environmental context, affiliation, environmental standard
For Peer Review
1
A FRESH APPROACH TO ENVIROMENTAL MANAGEMENT: DO ALL COMPANIES HAVE THE SAME CONTEXT INFLUENCE, DEVELOPMENT AND PERFORMANCE?
Abstract: Respect for the environment has rapidly gained importance in the context of
firms, regardless their level of pollution. Most of the research has been related to the most polluting sectors and is limited to the effect on performance of the adoption of cleaner practices primarily in terms of operations, financial performance and competitiveness. This paper expands the research towards a more complete picture of environmental management by examining context, development and performance to understand how other factors can influence the development of cleaner practices. In addition, we focus our research on a service sector. In our analysis, we differentiated between the affiliation and size of the companies to better understand their specificities. Based on a sample of 374 restaurants, the results show the importance of the influence of institutions and the limited influence of competitors in encouraging firms to adopt new management practices, especially for smaller firms.
Keywords: environmental approach, institutional support, environmental performance,
environmental context, affiliation, environmental standard.
INTRODUCTION
Adoption of environmental practices is a key strategy for companies regardless of whether they have been high level polluters (Bernardini, 2008). The major reason, beyond the macro-economic aspects of global climate change, is that cleaner practices allow consumption savings, improved operations and increased competitiveness (Robinot and Giannelloni, 2010; Jani and Han, 2011). In the other new societal expectations of green-based sustainability, firms face pressure from governments and competitors (Ambec and Lanoie, 2008). A number of authors suggested that companies that are not involved in environmentally sound practices are losing economic competitiveness (Fernandez-Viñe et al., 2013).
There still remain gaps in this issue. Whereas the direct effects of cleaner practices on operations, financial performance and competitiveness have been widely studied, other factors, such as the institutional role, competitive pressure and the adoption of 2 3 4 5 6 7 8 9 10 11 12 13 14 15 16 17 18 19 20 21 22 23 24 25 26 27 28 29 30 31 32 33 34 35 36 37 38 39 40 41 42 43 44 45 46 47 48 49 50 51 52 53 54 55 56 57 58
For Peer Review
standardised environmental management systems, have been poorly tested. Cleaner practices have been studied from a partial viewpoint, predominantly that of adoption and performance, but there is little research about the role that other factors have in the development of cleaner practices. Differences in adopting environmental practices and their effects on large and small companies are unclear. The major reason is that in previous research, environmental development and performance have been analysed in large and small companies separately. The focus has been primary on larger companies and/or on those that produced greater pollution, and thus the differences and similarities of employing environmental management in a certain industry remain substantially unexamined. It appears that there is room for improvement.
This paper has three aims. Taking into account the complete picture of environmental management, namely, context-development-performance, the first aim is to analyse the role of environmental context in environmental development and performance. The second aim is to conduct a structural equation multi-group analysis to compare the differences in environmental management in identical industries distinguished by affiliation. Affiliation is considered to be a suitable variable for size because it allows a comparison of business units with a similar number of employees; in one class are independent companies and in the other, all the business units having a headquarters office that manages the strategy for and influences the behaviour of all the business units. Finally, we aimed to study the influence of the adoption of a standardised environmental management system on environmental development.
This paper extends the previous research in a number of ways. First, it provides a complete picture of the chain of environmental context-development-performance, which reinforces insights previously identified and provides new ones that are critical for managerial practice. Second, it reassesses the role of the environmental context and gives new directions for analysis. Third, it provides a multi-group analysis and supplies evidence regarding the influence of a contingency factor, affiliation, which has been little studied to date. Finally, the role of a standardised management system on environmental development sheds light on this open issue.
Section two of this paper discusses the theoretical arguments concerning the model proposed. Section three describes the empirical design of the study. Section four presents a quantitative analysis, and section five presents the study findings. Section six offers a number of conclusions drawn from the research on observed business practice. 2 3 4 5 6 7 8 9 10 11 12 13 14 15 16 17 18 19 20 21 22 23 24 25 26 27 28 29 30 31 32 33 34 35 36 37 38 39 40 41 42 43 44 45 46 47 48 49 50 51 52 53 54 55 56 57
For Peer Review
3 LITERATURE REVIEW
Environmental Context
Environmental context explains the external factors that stimulate or inhibit the adoption of certain practices through which companies operate. External pressures necessitate internal changes in companies to respond to such pressures (Delmas and Toffel, 2004; Herremans et al., 2009). Previous research has stressed that in the case of environmental management, external pressure is the major promoter, and more specifically, hard regulation (Ruddell and Stevens, 1998; Chang and Wong, 2006; Martin and Rice, 2009). Hard regulation is mandatory for all companies, with few exceptions (highly regulated industries or very high polluters), whereas cleaner practices are based on soft regulation and recommendations. In this case institutional support could encourage or discourage this behaviour (Revell and Rutherfoord, 2003). Malik and Kotabe (2009) defined institutional support as the extent to which government institutions facilitate the adoption of a business practice, innovation or technology under legal compliance, in this case, cleaner development. This paper accepts this definition of institutional support. Institutional support can encourage firms to adopt cleaner production in a number of ways including the following (see Malik and Kotabe, 2009; Fernandez-Viñe et al. 2013): 1) sharing information about appropriate environmental technologies for more effective use; 2) encouraging the creation of cleaner distribution chains to create new market segments; 3) providing incentives to promote cleaner practices; and 4) supporting companies by technical and trained staff. Environmental context includes other companies that can be direct or indirect competitors and other companies operating in the field. These companies can influence themselves. Previous research suggested that mimetic behaviour is produced within the same industry or companies in the field to provide solutions to environmental challenges. Thus, management changes in the standards used by competitors encourage other companies to act similarly, although not all firms feel identical pressures or pressure from identical sources (Herremans et al., 2009). When institutional forces motivate the adoption of certain practices, companies act quickly to avoid penalties. When competitors and other companies in the field encourage cleaner practices it generally takes other companies more time to adopt them. The major reason is that companies need time to observe the development of such practices in other organisations before being ready to adopt new practices. Cleaner practices may be 2 3 4 5 6 7 8 9 10 11 12 13 14 15 16 17 18 19 20 21 22 23 24 25 26 27 28 29 30 31 32 33 34 35 36 37 38 39 40 41 42 43 44 45 46 47 48 49 50 51 52 53 54 55 56 57 58
For Peer Review
adopted under indirect pressure from competitors to preserve a certain competitive advantage and eliminate competitor differentiation (Revell and Rutherfoord, 2003; Bernardini, 2008; Martin and Rice, 2010).
Institutional support, competitors and companies in the field could influence the environmental context of a company and decisions about environmental development. The leading hypotheses are as follows:
H1. Competitors and other companies operating in the sector have a positive direct influence on adoption of cleaner practices.
H2. Institutional support has a positive influence on the adoption of cleaner practices. H3. The influence of competitors and institutional support on cleaner practices are correlated.
Environmental Development
Environmental development includes both a company's adoption of cleaner practices and their direct effects.
The adoption of cleaner practices is fundamental in all types of companies, although it is more important for higher polluters or waste generators (Marimon et al., 2012). Companies formerly adopted as a first step quick and simple practices, such as low consumption lamps, water savers and recycling (Alonso-Almeida, 2012). These practices constitute a basic hard foundation for implementing more advanced cleaner practices. Fernandez-Viñe et al. (2013) found that SMEs believe that cleaner practices are an extra cost because of the need to improve or change infrastructure and technology. With these basic core practices, companies can achieve an effect on operational performance (Trung and Kumar, 2005; Zeng et al., 2010; Ramanathan et al., 2010; Hsieh, 2012; Bagur-Femenias et al., 2013) which is considered a direct effect of cleaner practices and is termed environmental or cleaner performance (Aragon-Correa et al., 2008).
Cleaner performance involves a number of benefits including a reduction in the consumption of energy and water and a reduction in the generation of waste (Bernardini, 2008; Blanco et al., 2009; Alonso-Almeida, 2012; Hsieh, 2012). Through the application of more efficient environmental methods, a reduction in the number of invoices and, therefore, a reduction in total operational costs could be achieved (Aragon-Correa et al., 2008; Zeng et al., 2010; Alonso-Almeida, 2012).
2 3 4 5 6 7 8 9 10 11 12 13 14 15 16 17 18 19 20 21 22 23 24 25 26 27 28 29 30 31 32 33 34 35 36 37 38 39 40 41 42 43 44 45 46 47 48 49 50 51 52 53 54 55 56 57
For Peer Review
5
A strategy based on environmental development could attract new customers, who value the cleaner production and product concepts, and lead to a competitive advantage over a company’s competitors (Lopez-Gamero et al., 2009; Han et al., 2010; Jang et al., 2011). The adoption of cleaner practices may increase the feeling of added value provided by companies for customers. This strategy could be the optimum method of maintaining market position and improving business, especially in times of crisis (Lee et al., 2012).
Cleaner development could facilitate achieving higher standards in work conditions and access to institutional support to accelerate cleaner production practices (Boyle, 1999; Mohamed, 2001; Chan and Hawkins, 2010). The adoption of cleaner practices could be part of a virtuous cycle of a company in its path to sustainability.
On the basis of the previous evidence, the following hypothesis is proposed:
H4. The adoption of cleaner practices has a direct positive effect on cleaner performance.
Environmental Performance
Environmental management encompasses the effects not directly produced by the adoption of cleaner development on financial performance and market success factors. In addition to the reductions in daily operating costs, cleaner performance allows firms to achieve higher standards and a possible differentiation from competitors by creating value for customers (Lopez-Gamero et al., 2009; Robinot and Giannelloni, 2010; Jani and Han, 2011). Pleasant illumination, a comfortable temperature or more natural products could have a positive effect on a customer's intention to purchase and repurchase as a repeat customer (Alonso-Almeida et al., 2012) and, consequently, on the financial performance of a firm.
Molina-Azorín et al. (2009a), in a review of the literature on environmental management and financial performance, found that studies finding a positive effect of environmental concern on financial performance are predominant. The latest research has shown a positive relationship among environmental management and financial performance (e.g., Pereira-Moliner et al., 2012). The following hypothesis is proposed: H5. Cleaner performance has a positive direct effect on financial performance.
Companies that have a good environmental reputation have a more valuable market image (Jang et al. 2011). By having an explicitly green image or by being a silent 2 3 4 5 6 7 8 9 10 11 12 13 14 15 16 17 18 19 20 21 22 23 24 25 26 27 28 29 30 31 32 33 34 35 36 37 38 39 40 41 42 43 44 45 46 47 48 49 50 51 52 53 54 55 56 57 58
For Peer Review
adopter of environmental management, a company's customers can perceive added value and experience customer satisfaction when they consume a product or service; the image of the company is improved in the eyes of its customers and is more positive than the company image of those firms not adopting environmental management or without a positive environmental image (Longart, 2010; Hyun and Kim, 2011) (Kassinis and Soteriou, 2003; Susskind et al., 2007; Susskind, 2010; Black, 2012; Bagur-Femenias et al., 2013) The adoption of cleaner practices could create new skills and an easier work load for employees (Kassinis and Soteriou, 2003; Lee, 2009), thereby improving worker satisfaction (Bagur-Femenias et al., 2013). Based on the findings listed above, the following hypothesis is proposed:
H6. Cleaner performance has a positive direct effect on market success factors.
Cleaner performance can provide better performance by the company in two direct ways: developing market success factors and improving financial performance. Cleaner performance could have an indirect effect on financial performance through market success factors.
From an internal perspective, satisfied employees project more satisfaction with their job and perform better work (Jang et al., 2011). Customers may receive a better buying experience and gain increased satisfaction, which increases customer intentions to purchase (Hu et al., 2010; Longart, 2010; Jani and Han, 2011). Good service can have a positive effect on the company’s financial performance by encouraging sales (Susskind et al., 2007; Alonso-Almeida et al., 2012).
From an external perspective, consumers usually have confidence in companies with a strong market image, such as a strong brand, even when they have never had direct contact with the company (Jang et al., 2011). Consumers are more willing to look for and patronise a company with a strong market image (Hu et al., 2010; Bagur-Femenias et al., 2013). Sales figures and other financial factors can improve when company develops an environmental awareness that is recognised and valued by the market. Hence, the following hypothesis is proposed:
H7. Cleaner performance has an indirect impact on financial performance through market success factors.
2 3 4 5 6 7 8 9 10 11 12 13 14 15 16 17 18 19 20 21 22 23 24 25 26 27 28 29 30 31 32 33 34 35 36 37 38 39 40 41 42 43 44 45 46 47 48 49 50 51 52 53 54 55 56 57
For Peer Review
7
Companies’ affiliation and environmental management
Size is one of most relevant factors used to explain organisational behaviour. Large companies have more visibility and could feel more external pressures to answer to stakeholders´ demands (Marimon et al., 2012). Large sized companies tend to be better positioned to adopt more advanced management practices because they have more economic and human resources to introduce them (Rao et al., 1999; Dissanayaka et al., 2001).
In the case of some industries, size can be measured not only according to traditional measures as number of employees, amount of activity and sales but also through affiliation. Affiliation is a key variable in the motivation, development and performance of a specific practice because it can influence the adoption of practices independently of the actual size of a dealer or business unit (Cordano et al., 2010; Oberhofer and Fürst, 2012), which typically tend to be small (Aragon-Correa et al., 2008).
Previous research suggested that despite the benefits to joining a company group (Ma et al., 2006), companies in a group do not always achieve better performance than independent companies (Kanna and Palepu, 2000). The major reason is associated with macroeconomic issues (Kanna and Rivkin, 2001) but they typically have been pioneers in the adoption of management practices (Alvarez-Gil et al., 2001; Molina-Azorin et al., 2009b).
An affiliation-based business group is defined by Kanna and Rivkin (2001) as a set of firms, legally either independent or dependent, which take coordinated actions and are bound by a constellation of formal and informal ties. These authors asserted that members share a brand, have a common management team to manage strategy and may exchange resources‘ internally. In a number of industries, chain affiliation is common form (e.g., in the tourism, retail, apparel, transportation, and industries).
Ingram and Baum (1997) defined chain affiliation as "collections of service organisations, doing substantially the same thing (often the only differentiation is in physical space), that are linked together into a larger organisation. The relationships between the components of a chain are horizontal, although typically there are centralised parts of the chain, such as a distribution facility, that have vertical relationships to the components". As these authors asserted, "a chain can affect the fate of its components by giving them resources, reputation, and market power. By altering 2 3 4 5 6 7 8 9 10 11 12 13 14 15 16 17 18 19 20 21 22 23 24 25 26 27 28 29 30 31 32 33 34 35 36 37 38 39 40 41 42 43 44 45 46 47 48 49 50 51 52 53 54 55 56 57 58
For Peer Review
the competitive strengths of their components, chains may also influence the competitive dynamics of industries".
Regarding environmental management, the limited research that takes into account affiliation showed mixed results, although a positive relationship was predominant. Chain affiliation appears to deepen environmental development (Alvarez-Gil et al., 2001; Molina-Azorin et al., 2009b; Pereira-Moliner et al., 2012) and environmental performance (Molina-Azorin et al., 2009b; Oberhofer and Fürst, 2012). Aragon-Correa et al. (2009) found the influence of dealer affiliation was not significant in the automotive repair sector. A study on the influence of affiliation on the environmental context has not been conducted, and the following hypotheses are enunciated:
H8a. Environment context applies different pressure depending on affiliation H8b. Environmental development is different depending on affiliation. H8c. Environmental performance is different depending on affiliation.
Environmental management system standard and environmental development
One aspect of business practice that has been analysed in recent years is the adoption of standardised management systems (Guler et al., 2002; Castka and Balzarova, 2008). The application of the well-known standardised environmental management system, ISO 14001, has increased in all industries and countries (Marimon et al., 2011)., and other nationwide environmental management systems are also increasing in use (Rodriguez-Anton et al., 2012). Previous research found that companies with a standardised environmental management system develop a stronger environmental compromise regarding cleaner practices and obtain a cleaner performance (Yin and Schmeidler, 2008; Molina-Azorín et al., 2009a). The adoption of a standardised environmental management system can foster environmental development in cleaner practices and performance.
In the aforementioned improvements regarding cleaner performance, the brand image benefits from the introduction of an environmental management system because companies tend to display their certificates and use them for advertising (Terlaak and King, 2006). Rodriguez-Anton et al. (2012) found that hotel companies incorporating a standardised environmental management system perceived that they improved the public image of a hotel. These authors noted that these certificates could be used in hotel advertising as an advertising point for consumers seeking a certain environmental 2 3 4 5 6 7 8 9 10 11 12 13 14 15 16 17 18 19 20 21 22 23 24 25 26 27 28 29 30 31 32 33 34 35 36 37 38 39 40 41 42 43 44 45 46 47 48 49 50 51 52 53 54 55 56 57
For Peer Review
9
image. Because the existing evidence shows that companies that adopt a environmental management system could obtain higher environmental development, the hypothesis proposed is:
H9. Companies adopting a standardised environmental management system have higher environmental development than other companies in terms of cleaner practices and performance.
Figure 1 summarises the proposed model. ********
Please insert Figure 1 over here ********
RESEARCH METHODOLOGY AND DEVELOPMENT OF MEASURES
The fieldwork was conducted during November and December 2010 by means of personal surveys with the general manager of each firm. Ultimately, 374 valid responses were included in the analysis. The questionnaire gathered data about the environmental management and profile of the company. All the items were measured in a 7-point Likert scale, where 1 represented completely disagree and 7 completely agree, except for the financial performance items, for which we categorised the answers in five intervals to collect richer data. To ensure the validity of the data, the interviewers were trained by the research team regarding the objective of the analysis. During the interviews, all the respondents were informed about the purpose of the research and the confidentiality of the collected data.
The major reason to focus our research on the restaurant industry is two-fold. First, Spain has the highest number of restaurants per capita in the EU. In 2001,, there was one registered establishment per 169 habitants, giving a total of 279,443 restaurants, which contributed to more than 7% of the national GDP (Fehr, 2012; la Caixa, 2013). Second, the tourist industry is the greatest source of waste (Trung and Kumar, 2005). The sample was composed of casual restaurants (52.94%) and restaurants (47.06%). The average number of employees per firm for the entire sample was 8.26 (standard deviation= 7.11). The restaurants tend to be larger (12 employees) than the casual restaurant (6 employees) on average, but they are all small business units.
A casual restaurant in Spain is a restaurant in which the quality of the food and the prices tend to be higher than those of a conventional fast food restaurant but may be lower than those of a restaurant that offers full table service. In the North American 2 3 4 5 6 7 8 9 10 11 12 13 14 15 16 17 18 19 20 21 22 23 24 25 26 27 28 29 30 31 32 33 34 35 36 37 38 39 40 41 42 43 44 45 46 47 48 49 50 51 52 53 54 55 56 57 58
For Peer Review
context, a casual restaurant is commonly referred to as a casual dining establishment, whereas a restaurant may be referred to as a formal restaurant.
Finally, by typology, most of the businesses were independent firms (70.92%), and the rest belong to a chain. In the sample, 28.96% claim to have implemented one environmental standard. With regards to the scale for all the dimensions, we considered the variables used in several previous studies. We asked the interviewees not to value their perceptions about what the firm should do, but rather what the firms actually do with regards to the environment.
RESULTS
Validity and reliability of the instruments
A principal components analysis with Varimax rotation was conducted for each dimension. Each item loaded on one dimension. A minimal loading of 0.40 was used in the interpretation of these factors. The EFA factor structure of the dimensions was examined by a CFA. The maximum likelihood method of estimation was used, and it indicated that each item loaded on the identical factor that emerged in the EFA. Table 1 presents the items, the values of the internal consistency and the reliability, and the literature from the items were based on the resulting factors.
********
Please insert Table 1 over here ********
Because all of the items had factor loadings greater than 0.40, they were summed to form a measure. The internal consistency and reliability of the resulting factors were assessed using Cronbach’s alpha, the composite reliability (CR) and the average variance extracted (AVE). In all the cases, the values exceeded the minimum internal consistency criterion: >0.7 for Cronbach’s alpha (Malhotra, 2004), 0.7 for the composite reliability (Nunnally and Berstein, 1994) and 0.5 for the AVE (Barclay, Thompson, & Higgins, 1995).
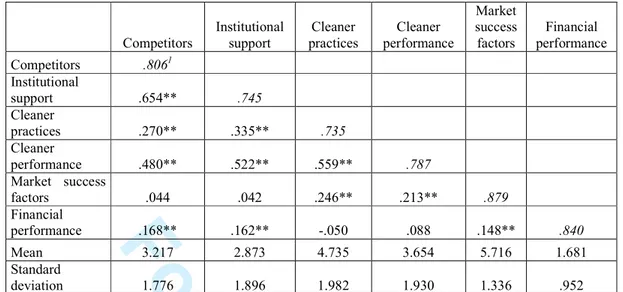
To determine the relationships between the dimensions and the discriminant validity, Table 2 presents the results of the correlation analysis, the mean values and the standard deviation of the observed dimensions and the square root of AVE in the diagonal. The results of the comparison confirmed that each construct was more closely related to its 2 3 4 5 6 7 8 9 10 11 12 13 14 15 16 17 18 19 20 21 22 23 24 25 26 27 28 29 30 31 32 33 34 35 36 37 38 39 40 41 42 43 44 45 46 47 48 49 50 51 52 53 54 55 56 57
For Peer Review
11
own dimensions than to the dimensions of the other constructs because, in all cases, the square root of each dimension’s AVE was higher than the correlation between the dimensions.
********
Please insert Table 2 over here ********
Analysis of the causal model
The hypotheses were tested using EQS software (Bentler, 1995). In accordance with Table 3, an overall conclusion about the fit of the model can be obtained by considering these indices simultaneously, as recommended by Schermelleh-Engel et al. (2003), and by obtaining at least three fit statistics indicating an acceptable fit.
********
Please insert Table 3 over here ********
In the Chi-square test divided by degrees of freedom, the values are smaller than 3, as proposed by Carmines (1981). The root mean square error of approximation (RMSEA) has a value of .06 or less, which indicates a good fit model, as indicated by Hu and Bentler (1999). The comparative fit index (CFI) value is, in all cases, higher than 0.90, indicating a better model fit (Hu and Bentler, 1999. Because more than three statistics in the model have values that are greater than the recommended values, we can affirm that these measures of overall fitness reflect the explanatory power of the proposed model. The standardised solution of the causal model is presented in Figure 2.
********
Please insert Figure 2 over here ********
Once the model had been assessed and validated, the analysis was extended to examine the effect of (a) being an independent or belonging to a chain and (b) having implemented an environmental standard in the firm, because these two variables are important on the basis of the literature review.
2 3 4 5 6 7 8 9 10 11 12 13 14 15 16 17 18 19 20 21 22 23 24 25 26 27 28 29 30 31 32 33 34 35 36 37 38 39 40 41 42 43 44 45 46 47 48 49 50 51 52 53 54 55 56 57 58
For Peer Review
Multi-group analysis: Differences in environmental management
To test whether differences between the chain and independent restaurants are statistically significant, we tested the existence of structural invariance. We compare the multiple-group model with a nested model in which the relationship between COMPETITITORS and INSTITUTIONAL SUPPORT on CLEANER PRACTICES are constrained to be equal across groups. The chi-square difference tests for the multi-group model show that the invariance test, based on a maximum likelihood test, is not statistically significant for the relationship between COMPETITITORS and CLEANER PRACTICES (∆x2 = 2.436; ∆d.f. = 1; p = 0.118) but is statistically significant for the relationship between INSTITUTIONAL SUPPORT and CLEANER PRACTICES (∆x2 = 5.256; ∆d.f. = 1; p = 0.021).
These results indicate that there are no differences in the implementation of green practices because of COMPETITORS between the independent and chain restaurants, but there are differences because of the INSTITUTIONAL SUPPORT.
Analysing the differences in depth, we see that there is a significant effect in each sub-sample. In independent restaurants, the standardised value of the effect is 0.424 and it is 0.964 in chain restaurants. Table 4 presents the standardised values of the relationships by subsample.
********
Please insert Table 4 over here ********
The multiple-group analysis shows that identical results are obtained from separate samples and that mixing both types of firms in a single model does not confound the result. We detected differences of significance according to the subsample in the relationship between INSTITUTIONAL SUPPORT and CLEANER PRACTICES.
Analysis of the influence of a standardised environmental management system on environmental development
Following the previous analysis, we studied the possible differences in the environmental development of the firms that had implemented environmental standards. In this case, we compared the multiple-group model with a nested model in which the 2 3 4 5 6 7 8 9 10 11 12 13 14 15 16 17 18 19 20 21 22 23 24 25 26 27 28 29 30 31 32 33 34 35 36 37 38 39 40 41 42 43 44 45 46 47 48 49 50 51 52 53 54 55 56 57
For Peer Review
13
relationship between CLEANER PRACTICES and CLEANER PERFORMANCE is constrained to be equal across the groups. The chi-square difference tests for the multi-group model show that the invariance test, based on a maximum likelihood test, is not statistically significant (∆x2 = 1.115; ∆d.f. = 1; p = 0.290).
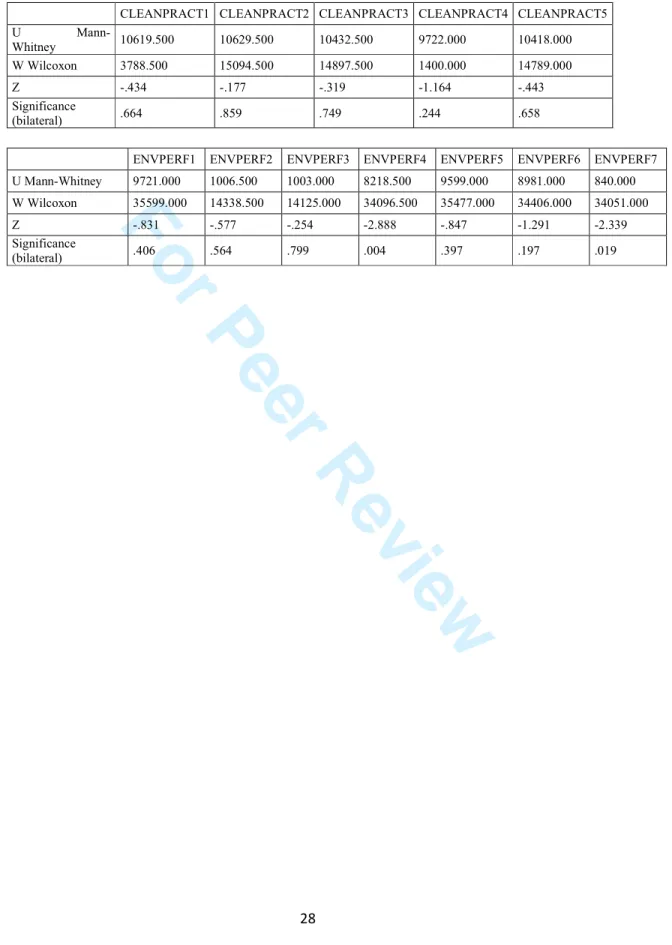
To detect possible differences, not in the relationship, but in the use of green practices and operational performance, we launched a non-parametric analysis between the sub-samples for each item of CLEANER PRACTICES and for each item of CLEANER PERFORMANCE.
In the CLEANER PRACTICES dimension, no statistically significant differences were detected. Some differences were detected in the CLEANER PERFORMANCE dimension, specifically in the fourth and seventh items, which refer to external environmental image (see Table 5).
********
Please insert Table 5 over here ********
DISCUSSION OF RESULTS
Studies regarding environmental management have focused on the direct and indirect effects that cleaner practices have on a company regardless of both the context in which the company operates and differences between companies and have utilised multi-group analysis. This research responds to the unanswered question regarding the relationships within a certain industry.
Previous research has shown that external pressure is the major driver in adopting cleaner practices. Our findings differ partially from previous ones. Previous research found that competitors were a source of pressure to adopt cleaner practices, but they are not significant influences in this study. Whereas institutional support is key to widespread cleaner practices, competitors do not represent any relevant influence. Institutional support beyond pure regulation compliance can be a source of knowledge crucial in the adoption of new management practices (Bernardini, 2008). The possibility of counting on the latest information, resolving doubts, giving advice and helping to finance new technology represent a key to encouraging companies to become involved in the development of cleaner practices, and H1 is thus supported.
2 3 4 5 6 7 8 9 10 11 12 13 14 15 16 17 18 19 20 21 22 23 24 25 26 27 28 29 30 31 32 33 34 35 36 37 38 39 40 41 42 43 44 45 46 47 48 49 50 51 52 53 54 55 56 57 58
For Peer Review
Direct competitors and other companies in the industry or field do not have a direct influence of the adoption of cleaner practices. Contrary to the institutional theory, companies in the studied sector do not emulate the behaviour of other companies with regard to environmental practises. This finding supports the notion that direct mimetic behaviour is not always the selected strategy for companies (Herremans et al., 2009), especially when there is strong institutional support, and H2 is thus rejected.
Institutional support and the behaviour of competitors are correlated, and the factors can affect each other. In an indirect way, companies could be positively influenced in their development of environmental practices by competitors or other companies operating in the same context. Hence, H3 is supported.
Related to cleaner performance, adoption of cleaner practices has a positive direct effect on cleaner performance. This finding is consistent with previous research (Enz and Siguaw, 1999; Blanco et al., 2009; Chan and Hawkins, 2010; Bagur-Femenias et al., 2013). The advancement in the adoption of cleaner practices could be a key driver to improving internal operations in a number of areas, such as daily operating activities, energy efficiency, health and safety improvements and the possibility of accessing new sources of funding. Bagur-Femenias et al. (2013) suggested that companies that do not take environmental issues seriously could miss an opportunity to achieve greater efficiency and competitiveness. Thus, H4 is supported.
Although most previous research has suggested that the relationship between cleaner performance and financial performance is direct and positively related, this research did not find this relationship. A similar result was found by Pereira-Moliner et al. (2012) in the hotel industry. A possible explanation could be the continuous increased invoiced cost of energy and water. Despite the reduction in consumption, the cost of utilities is not a factor controlled by a company, and increased rates could void any effect on profits in accounting of financial performance. Cleaner practices require investment expenditures that could annul the positive effect on financial performance. The main direct effect of cleaner practices is internal, and other variables, such as sales or an increase in customers, could not be affected directly when customers do not perceive or value the changes. Therefore, H5 is rejected.
Cleaner performance has a positive direct effect on market success factors in two main ways. First, the safety, internal learning and satisfaction of the employees may be improved. Second, customers could perceive an added value relative to competitors 2 3 4 5 6 7 8 9 10 11 12 13 14 15 16 17 18 19 20 21 22 23 24 25 26 27 28 29 30 31 32 33 34 35 36 37 38 39 40 41 42 43 44 45 46 47 48 49 50 51 52 53 54 55 56 57
For Peer Review
15
through some characteristic of the product or service. Both aspects are relevant to building a better image of the company and, therefore, a sense of better position in front of other competitors. Thus, this finding is consistent with previous research (see Pereira-Moliner et al., 2012) and H6 is supported.
Market success factors have a direct positive effect on financial performance because of cleaner development and performance. Improvements in image and customer service by employees can increase sales and repurchases (Bagur-Femenias et al. 2013). Therefore, H7 is supported.
Comparison among different affiliations in a same industry has been scarce. For that reason, this research provides a fresh approach to studying environmental management. Our findings have found a significant difference in the institutional support factor in the environmental context dimension. In the other dimensions -environmental development and performance- no significant differences were found. This research contradicts previous research that reported that chain affiliation companies have more advanced environmental development and performance (e.g., Molina-Azorin et al., 2009a; Oberhofer and Fürst, 2012). Small independent companies can achieve better internal efficiency and external competitiveness than companies affiliated with a chain. This finding is especially important in the current financial crisis in which survival is a primary company objective. Small independent companies should depend on environmental management advances to improve competitiveness. Focusing on the difference found, this research showed that institutional support is key to encouraging environmental development, and chain affiliation companies feel stronger institutional support, whereas independent companies feel a degree of help but not as intensely as chains. These findings suggest the need for greater assistance from the government to improve efficiency and efficacy in larger companies. Consequently, H8a is supported, whereas H8b and H8c are rejected because both affiliations shape the same behaviour and impacts.
Finally, as previous research noted, a standardised environmental management system provides a framework by which to deepen environmental development in two ways: practises and performance. Thus, the increase in the use and intensity of cleaner practises could determine environmental development and, therefore, the adoption of a standardised environmental management system could exert a positive influence in both areas (Yin and Schmeidler, 2008; Molina-Azorín et al., 2009b). Nevertheless, our 2 3 4 5 6 7 8 9 10 11 12 13 14 15 16 17 18 19 20 21 22 23 24 25 26 27 28 29 30 31 32 33 34 35 36 37 38 39 40 41 42 43 44 45 46 47 48 49 50 51 52 53 54 55 56 57 58
For Peer Review
findings are mixed. On the one hand, the effect of adoption of cleaner practices on number and intensity is the same for both adopters and non-adopters of standardised environmental management systems. On the other hand, the cleaner performance is significantly higher in for adopters of standardised environmental management system, specifically in some aspects that differentiate the company from its competitors and enable the administration to win public support for cleaner production. That finding is supported by previous research, which stressed the importance of standardised environmental management systems in acting as a signal for the market in the building of an environment compromise and image (Terlaak and King, 2006). Thus, environmental management certification could be used as a strategic marketing tool or as a requisite to access to certain public support to invest in new environmental technology. Therefore, H9 is partially accepted.
CONCLUSIONS
The results of this research provide evidence supporting a number of pertinent conclusions for academics, managers and policy makers.
First, the motivation to pursue cleaner practices is clear in the literature. Internally, this motivation comes from improvements in operations performance, while externally, it mainly results from hard regulation and stakeholder pressure.
This research shows that, contrary to previous research, other companies exert little effect in the adoption of cleaner practices, and institutional support is key to fostering cleaner development beyond the internal motivations of large companies; however, institutional support is more important for smaller companies.
The main reason is that small companies may have few financial resources to invest in consultations about the best practices for their business; institutional support could be a source of learning and business improvement. Thus, institutions should focus on small business with the aim of providing them with new capabilities to remain in the market. Institutions should promote appropriate soft regulation for each industry rather than only penalising them. Consequently, they would truly act as change drivers collaborating to make small companies more competitive and generate health for the country. 2 3 4 5 6 7 8 9 10 11 12 13 14 15 16 17 18 19 20 21 22 23 24 25 26 27 28 29 30 31 32 33 34 35 36 37 38 39 40 41 42 43 44 45 46 47 48 49 50 51 52 53 54 55 56 57
For Peer Review
17
Second, environmental development, in addition to the possibility of achieving new capabilities, promotes market success factors. These factors are critical to maintain performance in the market, especially in times of crisis, as some authors have noted. Companies should adopt cleaner practices, not only because of the possibility of improved financial performance in terms of consumption savings (which can be eliminated when rate goes up) but also because they encourage competitiveness through the improvement of the company’s image, promote better service due to employee satisfaction and lead to customers valuing company more highly than its competitors. Finally, the adoption of a standardised environmental management system provides extra benefits beyond environmentally cleaner performance. Companies that do not adopt more advanced clean practices but are instead able to utilise their existing clean practices more effectively can achieve higher external benefits that they can present to new or existing customers as proof of a specific environmental compromise.
At the same time, adoption of a standardised environmental management system enables in-depth development of cleaner practices by putting the emphasis on access to greater institutional support. Therefore, companies with a standardised environmental management system could acquire additional market success factors or maximise the current factors.
Environmental management appears to be a profitable business. The involvement of companies in cleaner practices leads to the acquisition of improved capabilities. This fact is relevant for a number of reasons. First, in the restaurant industry there is a predominance of small businesses with high consumption of electricity and water in addition to greater waste generation, and these businesses need to control these costs. Second, studying this industry is relevant to the Spanish economy because day-to-day operations can keep managers busy and distract them from maximising cleaner development; thus, institutional support for cleaner practices is a main driver for independent and chain-affiliated restaurants. Finally, independent business should make an effort to approach the institutions to obtain assistance. Thus, collaboration among companies and institutions is crucial for sustainable economic advancement.
Environmental management is an important driver for companies in achieving a level of differentiation and competitiveness, especially when they make a firm commitment and feel institutional support in a partnership in which the company can learn and gain advantages for their business.
2 3 4 5 6 7 8 9 10 11 12 13 14 15 16 17 18 19 20 21 22 23 24 25 26 27 28 29 30 31 32 33 34 35 36 37 38 39 40 41 42 43 44 45 46 47 48 49 50 51 52 53 54 55 56 57 58
For Peer Review
This study encourages policy makers to provide real support for companies and not only penalise them or be passive participants. Active institutional support is capable of producing quicker environmental development in the entire business system. This situation will be positive for a company and for the advancement of national and global environmental solutions. This institutional role should be focused predominantly on small businesses because they represent more than 90% of the companies in Europe and worldwide. The creation of wealth and growth worldwide is based on small companies. Great support is required to fill critical gaps and achieve advantages in environmental development.
This study introduces other issues to consider in future research, including whether these results are valid in the tourist industry and others. This study is subject to certain limitations, given that the fieldwork was performed in a specific geographical region and that the study results may be difficult to extrapolate to other countries. Although restaurants were surveyed, the conclusions may be applied to other sectors because of the economic importance of this industry in Spain.
REFERENCES
Alonso-Almeida, M.M., 2012. Water and waste management in the Moroccan tourism industry: the case of three women entrepreneurs. Women’s Studies International Forum 35, 343-353.
Alvarez-Gil, M.J., Burgos-Jiménez, J., Cespedes-Lorente, J.J., 2001. Analysis of environmental management, organizational context and performance of Spanish hotels. Omega 29, 457-471.
Ambec P.; Lanoie S. (2008) “Does It Pay to Be Green? A Systematic Overview”, Academy of Management Perspectives, 45-61.
Aragon-Correa, J.A., Hurtado-Torres, N., Sharma, S. and Garcıa-Morales, V.J. (2008), “Environmental strategy and performance in small firms: a resource-based perspective”, Journal of Environmental Management, Vol. 86 No. 1, pp. 88-103.
Boyle, C. (1999), “Cleaner production in New Zealand”, Journal of Cleaner Production, Vol. 7 No. 1, pp. 59-67.
Bagur-Femenias, L., Llach, J., Alonso-Almeida, M.M. (2013),"Is the adoption of environmental practices a strategical decision for small service companies?: An empirical approach", Management Decision, Vol. 51 Iss: 1 pp. 41 - 62
2 3 4 5 6 7 8 9 10 11 12 13 14 15 16 17 18 19 20 21 22 23 24 25 26 27 28 29 30 31 32 33 34 35 36 37 38 39 40 41 42 43 44 45 46 47 48 49 50 51 52 53 54 55 56 57
For Peer Review
19
Blanco, E., Rey-Maquieira, J. and Lozano, J. (2009), “Economic incentives for tourism firms to undertake voluntary environmental management”, Tourism Management, Vol. 30 No. 1, pp. 112-22.
FEHR (2012) “Los Sectores de la Hostelería en 2011”. Federación Española de Hostelería, Madrid, España.
La Caixa (2013) “Anuario Economico 2013”. La Caixa, Barcelona, España. Barclay,D.; Thompson, R.; Higgins, C. (1995) The partial least squares (PLS) approach to causal modelling: personal computer adoption and use an illustration. Technology Studies: Special Issue on Research Methodology, 2 (2) (1995), pp. 285– 324.
Bentler, P.M. (1995) EQS structural equations program manual, Multivariate Software, Encino, CA (1995).
Bernardini Seiffert, M.E. (2008), “Environmental impact evaluation using a cooperative model for implementing EMS (ISO 14001) in small and medium-sized enterprises”, Journal of Cleaner Production, Vol. 16 No. 14, pp. 1447-61.
Castka, P., Balzarova, M.A, 2008. The impact of ISO 9000 and ISO 14000 on standardisation of social responsibility-an inside perspective. International Journal of Production Economics 113, 74-87.
Chan, E.S.W. and Hawkins, R. (2010), “Attitude towards EMSs in an international hotel: an exploratory case study”, International Journal of Hospitality Management, Vol. 29 No. 4, pp. 641-51.
Chan, E.S.W. and Wong, S.C.K. (2006), “Motivations for ISO 14001 in the hotel industry”, Tourism Management, Vol. 27 No. 3, pp. 481-92.
Cordano, M., R. S. Marshall and M. Silverman: 2010, ‘How Do Small and Medium Enterprises Go “Green”? A study of Environmental Management Programs in the U.S. Wine Industry’, Journal of Business Ethics, 92(3), 463-478.
Delmas, M. and Toffel, M. W. (2004), Stakeholders and environmental management practices: an institutional framework. Bus. Strat. Env., 13: 209–222. doi: 10.1002/bse.409
Dissanayaka, S.M., Kumaraswamy, M.M., Karim, K., Marosszeky, M, 2001. Evaluating outcomes from ISO 9000-certified quality systems of Hong Kong constructors. Total Quality Management 12 (1), 29-40.
2 3 4 5 6 7 8 9 10 11 12 13 14 15 16 17 18 19 20 21 22 23 24 25 26 27 28 29 30 31 32 33 34 35 36 37 38 39 40 41 42 43 44 45 46 47 48 49 50 51 52 53 54 55 56 57 58
For Peer Review
Enz, C.A. and Siguaw, J.A. (1999), “Best hotel environmental practices”, Cornell Hotel and Restaurant Administration Quarterly, Vol. 40 No. 5, pp. 72-77.
Fernández-Viñé M. B., Gómez-Navarro T., Capuz-Rizo S. F. (2013). Assessment of the public administration tools for the improvement of the eco-efficiency of Small and Medium Sized Enterprises. Journal of Cleaner Production 47, 265-273.
Guler, I., Guillen, M.F., Macpherson, J.M, 2002. Global competition, institutions, and the diffusion of organizational practices: the international spread of ISO 9000 quality certificates. Administrative Science Quarterly 47, 207-232.
Han H., Hsu, L., Sheu C. (2010). Application of the Theory of Planned Behavior to green hotel choice: Testing the effect of environmental friendly activities. Tourism Management 31, 325–334
Herremans, I. M., Herschovis, M. S. & Bertels, S. (2009). Leaders and laggards: The influence of competing logics on corporate environmental action. Journal of Business Ethics, 88(3), 449-72.
Hsieh, Y. (2012). Hotel companies’ environmental policies and practices: a content analysis of their web pages. International Journal of Contemporary Hospitality Management, Vol. 24 No. 1, pp. 97-121.
Hu, H., Parsa, H.G., Self, J., 2010. The dynamics of green restaurant patronage. Cornell Hospitality Quarterly 51 (3), 344-362.
Hu, L,. Bentler, P., 1999. Cutoff criteria for fit indexes in covariance structure analysis: conventional criteria versus new alternatives. Structural Equation Modeling 6 (1), pp. 1-55.
Hyun, S.S., Kim, W., 2011. Dimensions of brand equity in the chain restaurant industry. Cornell Hospitality Quarterly 52 (4), 429-437.
Ingram, P and Baum J. A. C. (1997). Chain Affiliation and the Failure of Manhattan Hotels, 1898-1980. Source: Administrative Science Quarterly, Vol. 42, No. 1, pp. 68-102.
Jang, Y.J., Kimb, W.G, Bonn, M. (2011). Generation Y consumers’ selection attributes and behavioral intentions concerning green restaurants. International Journal of Hospitality Management 30, 803– 811.
Jani D. and Han, H. (2011). Investigating the key factors affecting behavioral intentions. Evidence from a full-service restaurant setting. International Journal of Contemporary Hospitality Management, Vol. 23 No. 7, pp. 1000-1018.
2 3 4 5 6 7 8 9 10 11 12 13 14 15 16 17 18 19 20 21 22 23 24 25 26 27 28 29 30 31 32 33 34 35 36 37 38 39 40 41 42 43 44 45 46 47 48 49 50 51 52 53 54 55 56 57
For Peer Review
21
KHANNA, T. and RIVKIN J. W. (2001). Estimating the performance effects of business groups in emerging markets. Strategic Management Journal Strat. Mgmt. J., 22: 45–74.
KHANNA T. and PALEPU K. (2000). Is Group Affiliation Profitable in Emerging Markets? An Analysis of Diversified Indian Business Groups. THE JOURNAL OF FINANCE • VOL. LV, NO. 2, 867-891.
Kassinis, G.I. and Soteriou, A.C. (2003), “Greening the service profit chain: the impact of environmental management practices”, Production and Operations Management, Vol. 12 No. 3, pp. 386-403.
Lee, S., et al., (2012). The corporate social responsibility–financial performance link in the U.S. restaurant industry: Do economic conditions matter? Int. J. Hospitality Manage. doi:10.1016/j.ijhm.2012.03.007.
Lee, K., 2009. Why and how to adopt green management into business organizations? the case study of Korean SMEs in manufacturing industry. Management Decision 47 (7), 1101-1121.
Longart P. (2010). What drives word-of-mouth in restaurants?. International Journal of Contemporary Hospitality Management, Vol. 22 No. 1, pp. 121-128.
Lopez-Gamero, M.D., Molina-Azorın, J.F. and Claver-Cortes, E. (2009), “The whole relationship between environmental variables and firm performance: competitive advantage and firm resources as mediator variables”, Journal of Environmental Management, Vol. 90 No. 10, pp. 3110-3121.
Ma X., Yao X., Xi Y. (2006). Business group affiliation and firm performance in a transition economy: A focus on ownership voids. Asia Pacific J Management 23:467– 483
Malhotra, N.K. (2004), Marketing Research: An Applied Orientation, 4th ed., Prentice Hall, Upper Saddle River, NJ.
Malik, O. R. and M. Kotabe: 2009, ‘Dynamic Capabilities, Government Policies, and Performance in Firms from Emerging Economies: Evidence from India and Pakistan’, Journal of Management Studies, 46(3), 421-450.
Marimon F, Llach J, Bernardo M. (2011). Comparative analysis of diffusion of the ISO 14001 standard by sector of activity. Journal of Cleaner Production 19(15): 1734–1744. 2 3 4 5 6 7 8 9 10 11 12 13 14 15 16 17 18 19 20 21 22 23 24 25 26 27 28 29 30 31 32 33 34 35 36 37 38 39 40 41 42 43 44 45 46 47 48 49 50 51 52 53 54 55 56 57 58
For Peer Review
Molina-Azorín, J.F., Claver-Cortes, E., Pereira-Moliner, J., Tarí, J.J., (2009b). Environmental practices and firm performance: an empirical analysis in the Spanish hotel industry. Journal of Cleaner Production 17, 516-524
Molina-Azorín, J.F., Claver-Cortés, E.,. López-Gamero, M. D Tarí, J.J. (2009a),"Green management and financial performance: a literature review", Management Decision, Vol. 47 Iss: 7 pp. 1080 - 1100
Marimon F, Alonso-Almeida MM, Rodriguez MP, Cortez CA. 2012. The worldwide diffusion of the global reporting initiative: what is the point? Journal of Cleaner Production 33: 132–144.
Martin, N. and Rice, J. (2010), Analysing emission intensive firms as regulatory stakeholders: a role for adaptable business strategy. Bus. Strat. Env., 19: 64–75. doi: 10.1002/bse.661.
Nunnally, J.C., Berstein, I.H. (1994), Psychometric Theory, 3rd ed., McGraw-Hill, New York, NY.
Oberhofer, P. and Fürst, E. (2012), Sustainable Development in the Transport Sector: Influencing Environmental Behaviour and Performance. Bus. Strat. Env.. doi: 10.1002/bse.1750.
Pereira-Moliner, J., Claver-Cortés, E., Molina-Azorín, J.P., Tarí, J.J., 2012. Quality management, environmental management and firm performance: direct and mediating effects in the hotel industry. Journal of Cleaner Production 37, 82-92.
Ramanathan, R., Black, A., Nath, P. and Muyldermans, L. (2010), “Impact of environmental regulations on innovation and performance in the UK industrial sector”, Management Decision, Vol. 48 No. 10, pp. 1493-513.
Rao, S.S., Solis, L.E., Raghunathan, T.S, 1999. A framework for international quality management research: development and validation of a measurement instrument. Total Quality Management 10 (7), 1047-1075.
Revell, A. and Rutherfoord, R. (2003), UK environmental policy and the small firm: broadening the focus. Bus. Strat. Env., 12: 26–35. doi: 10.1002/bse.347.
Robinot, E. Giannelloni, J. L. (2010). Do hotels' "green" attributes contribute to customer satisfaction?. Journal of Services Marketing, Vol. 24 Iss: 2 pp. 157 - 169.
Rodriguez-Antón, J.M., Alonso-Almeida, M.M., Celemín, M., Rubio, L., 2012. Use of different sustainability management systems in the hospitality industry. The case of Spanish hotels. Journal of Cleaner Production 22 (1), 76-84.
2 3 4 5 6 7 8 9 10 11 12 13 14 15 16 17 18 19 20 21 22 23 24 25 26 27 28 29 30 31 32 33 34 35 36 37 38 39 40 41 42 43 44 45 46 47 48 49 50 51 52 53 54 55 56 57
For Peer Review
23
Ruddell, S. and Stevens, J.A. (1998), “The adoption of ISO 9000, ISO 14001, and the demand for certified wood products in the business and institutional furniture industry”, Forest Products Journal, Vol. 48 No. 3, pp. 19-26.
Schermelleh-Enge, K., Moosbrugger, H., Müller, H. 2003. Evaluating the fit of structural equation models: tests of significance and descriptive Goodness-of-Fit measures.Psychological Research 8 (2), pp. 23-74.
Susskind, A.M., Kaemar, M.K., Borhgrevink, C.P., 2007. How organizational standards and coworker support improve restaurant service. Cornell Hotel and Restaurant Administration Quarterly 48 (4), 370-384.
Terlaak, A., King, A.A, 2006. The effect of certification with ISO 9000 quality management standard: a signaling approach. Journal of Economic Behavior and Organization 60 (4), 579-602.
Trung, Do Nam, & Kumar, S. (2005). Resource use waste management in Vietnam hotel industry. Journal of Cleaner Production, 13(2), 109–116.
Yin, H. and Schmeidler, P. J. (2009), Why do standardized ISO 14001 environmental management systems lead to heterogeneous environmental outcomes?. Bus. Strat. Env., 18: 469–486. doi: 10.1002/bse.629.
Zeng, S.X., Meng, X.H., Yin, H.T., Tam, C.M. and Sun, L. (2010), “Impact of cleaner production on business performance”, Journal of Cleaner Production, Vol. 18 Nos 10-11, pp. 975-83. 2 3 4 5 6 7 8 9 10 11 12 13 14 15 16 17 18 19 20 21 22 23 24 25 26 27 28 29 30 31 32 33 34 35 36 37 38 39 40 41 42 43 44 45 46 47 48 49 50 51 52 53 54 55 56 57 58
For Peer Review
24 Table 1. Factor loadings and internal and reliability statistics
Dimensions Description Load α CR AVE References
E N V IR O N M E N T A L C O N T E X T COMPETITORS
Competitors adopt environmental protection measures .864 .844 .846 .649 Malik and Kotabe, 2009; Fernandez-Viñe et al., (2013)
Many tourist firms adopt environmental protection measures .719
The organisations in the field adopt environmental protection measures .827
INSTITUTION. SUPPORT
Government frequently reminds about the moral obligation to protect the environment .739 .830 .832 .555
Government informs about how to protect the environment .822
Government encourages how to identify the firm as a green business .748
Government promotes activities to protect the environment in the industry .664
E N V IR O N M E T A L D E V E L O P M E N T CLEANER PRACTICES
Your organisation buys ecological products .661 .796 .853 .54 Alvarez-Gil et al. (2001);
Molina-Azorín et al. (2009b); Pereira-Moliner et al. (2012) Aragon-Correa (2008); Chan and Hawkins, (2010) Your organisation has reduced the use of cleaning products that are harmful to the environment .703
Your organisation implements energy-saving practices .769
Your organisation implements water-saving practices .807
Your organisation implements the selective collection of solid residues .726
CLEANER PERFORM.
Environmental protection activities allow your organisation to reduce the total cost of operations .743 .917 .918 .619
Environmental protection activities allow your organisation to reduce water and electricity consumption .745
Environmental protection activities allow your organisation to attract new customer and keep the current ones .842
Environmental protection activities allow your organisation to differentiate itself from your competitors .815
Environmental protection activities allow your organisation to reduce the risk of accidents and legal action .792
Environmental protection activities allow your organisation to improve business .878
Environmental protection activities allow your organisation to enable the management to win public support for cleaner
production .675 E N V IR O N M E N T A L P E R F O R M A N C E MARKET SUCCESS FACTORS
Company’s image has been improved .748 .852 .911 .773 Alvarez-Gil et al. (2001);
Aragon-Correa (2008); Molina-Azorín et al. (2009b); Lopez-Gamero et al., (2009); Zeng et al. (2010);
Pereira-Moliner et al., (2012) Customer satisfaction level is higher than that of competitors .861
Employee satisfaction level is higher than that of competitors .831
FINANCIAL PERFORM.
Sales have increased over the last two years .809 .873 .877 .705
Profits have increased over the last two years .921 Customer occupancy rate increased over the last two years .784
http://mc.manuscriptcentral.com/bse 2 3 4 5 6 7 8 9 10 11 12 13 14 15 16 17 18 19 20 21 22 23 24 25 26 27 28 29 30 31 32 33 34 35 36 37 38 39 40 41 42 43 44 45 46 47 48 49 50 51 52 53 54 55
For Peer Review
25
Table 2. Correlation analysis and discriminant validity
Competitors Institutional support Cleaner practices Cleaner performance Market success factors Financial performance Competitors .8061 Institutional support .654** .745 Cleaner practices .270** .335** .735 Cleaner performance .480** .522** .559** .787 Market success factors .044 .042 .246** .213** .879 Financial performance .168** .162** -.050 .088 .148** .840 Mean 3.217 2.873 4.735 3.654 5.716 1.681 Standard deviation 1.776 1.896 1.982 1.930 1.336 .952 1
square root of average variance extracted in the diagonal 2 3 4 5 6 7 8 9 10 11 12 13 14 15 16 17 18 19 20 21 22 23 24 25 26 27 28 29 30 31 32 33 34 35 36 37 38 39 40 41 42 43 44 45 46 47 48 49 50 51 52 53 54 55 56 57 58
For Peer Review
Table 3. Indices tested for the model fitAssessment item Values
X2 (chi-square)1 538.6676
X2/df (normed chi-square) 2.009
BB-NN (Bentler-Bonett non-normed fit index) .907
CFI (comparative fit index .917
RMSEA (root mean square error of approx.) .060
1
Satorra-Bentler scaled Chi-Square 2 3 4 5 6 7 8 9 10 11 12 13 14 15 16 17 18 19 20 21 22 23 24 25 26 27 28 29 30 31 32 33 34 35 36 37 38 39 40 41 42 43 44 45 46 47 48 49 50 51 52 53 54 55 56 57
For Peer Review
27
Table 4. Standardised values and statistics according affiliation
COMPET. ↔ INSTITUT. COMPET. → CLEANER PRACTIC. INSTITUT. → CLEANER PRACTIC. CLEANER PRACTIC. → CLEANER PERF. CLEANER PERF.→ MSF CLEANER PERF.→ FP MSF → FP Fit indices Chain β .819 .004 .424 .576 .216 -.008 .211 X2/df= 1.578 BB-NNFI= .920 CFI= .929 RMSEA= .054 Stat.1 16.136** .023 2.141** 4.363** 2.544** -.101 2.431** Indep. β .830 -.473 .964 .802 .325 .070 .233 X2/df= 1.628 BB-NNFI= .890 CFI= .902 RMSEA= .068 Stat. 1.947** -1.635 3.347** 6.782** 2.819** .654 2.604** 1 Robust method
** statistic significant at 0.05 level 2 3 4 5 6 7 8 9 10 11 12 13 14 15 16 17 18 19 20 21 22 23 24 25 26 27 28 29 30 31 32 33 34 35 36 37 38 39 40 41 42 43 44 45 46 47 48 49 50 51 52 53 54 55 56 57 58
For Peer Review
Table 5. Non-parametric analysis for CLEANER PRACTICES and CLEANER PERFORMANCE dimensions
CLEANPRACT1 CLEANPRACT2 CLEANPRACT3 CLEANPRACT4 CLEANPRACT5 U Mann-Whitney 10619.500 10629.500 10432.500 9722.000 10418.000 W Wilcoxon 3788.500 15094.500 14897.500 1400.000 14789.000 Z -.434 -.177 -.319 -1.164 -.443 Significance (bilateral) .664 .859 .749 .244 .658
ENVPERF1 ENVPERF2 ENVPERF3 ENVPERF4 ENVPERF5 ENVPERF6 ENVPERF7 U Mann-Whitney 9721.000 1006.500 1003.000 8218.500 9599.000 8981.000 840.000 W Wilcoxon 35599.000 14338.500 14125.000 34096.500 35477.000 34406.000 34051.000 Z -.831 -.577 -.254 -2.888 -.847 -1.291 -2.339 Significance (bilateral) .406 .564 .799 .004 .397 .197 .019 2 3 4 5 6 7 8 9 10 11 12 13 14 15 16 17 18 19 20 21 22 23 24 25 26 27 28 29 30 31 32 33 34 35 36 37 38 39 40 41 42 43 44 45 46 47 48 49 50 51 52 53 54 55 56 57
For Peer Review
Figure 1. Proposed model2 3 4 5 6 7 8 9 10 11 12 13 14 15 16 17 18 19 20 21 22 23 24 25 26 27 28 29 30 31 32 33 34 35 36 37 38 39 40 41 42 43 44 45 46 47 48 49 50 51 52 53 54 55 56 57 58
For Peer Review
Figure 2. Standardised solution of the causal model** p-value significant at 0.05 level (robust method) 2 3 4 5 6 7 8 9 10 11 12 13 14 15 16 17 18 19 20 21 22 23 24 25 26 27 28 29 30 31 32 33 34 35 36 37 38 39 40 41 42 43 44 45 46 47 48 49 50 51 52 53 54 55 56 57