Pasquale Pavone
Istituto di Economia, Scuola Superiore Sant’Anna, Piazza Martiri della Libertà 33, I-56127, Pisa, Italia Maria Francesca Romano
Istituto di Economia, Scuola Superiore Sant’Anna, Piazza Martiri della Libertà 33, I-56127, Pisa, Italia
1. I
NTRODUCTIONWithout claiming to fully illustrate the landscape of the investigations, we can state that the numerous investigations launched in the ‘90s by Italian universities have gradually focused on two consortia, Alma Laurea and Stella1. This has broadened the possibility of comparison and give continuity to individual initiatives while realising economies of scale.
The investigations conducted by the university consortia differ from ISTAT’s investigations because the objectives of the former ones are more complex. Universities are interested (as is ISTAT) in the professional placement of their graduates, but within a shorter time-span. Universities mainly regard surveys as vital internal assessment tools to evaluate their courses. The direct management of a survey system for all adhering universities allows them to analyse their own results as well as to compare them with other universities and courses to detect strengths, weaknesses, best practices and achievements. In addition, they can promptly adjust their organisation and teaching and modify the survey design.2
Surveys were traditionally focussed on graduates but after the Italian university reform and the legislatively ratified third level (PhD) degrees, surveys only focused on the first level and on the second level degrees. The surveys on third level degrees are instead particularly interesting for universities: if we take into account the period from 2003 to 2009, the number of PhD holders doubled in six years (as shown in Table 1) and the number of courses and fields of study gradually expanded.
1
http://www.almalaurea.it; http://vulcanostella.cilea.it/top-menu/chi-siamo
2For instance, the most recent changes in university degrees have led to survey design updates because universities are more interested in assessing newly instituted degrees.
TABLE 1
PhD holders in Italy from 2003 to 2009 Academic Year PhD Courses
2003/04 6,353 2004/05 8,466 2005/06 9,604 2006/07 10,188 2007/08 10,508 2008/09 12,219
Source: MIUR (Italian Ministry of School, University and Research)
Although universities are interested in extending their surveys to PhD holders, the problem of the reduced size of the reference population has to be solved. Sometimes population size can be a problem with first and second level degree courses, but this is always the case for PhD courses. As a proof of the increasing interest to investigate this degree level, PhD holders surveys have already been performed in some universities: Pavia (Campostrini and Gerzeli, 2009), Bologna (Girotti and Luzzatto, 2010) and Siena (Ghellini, 2009; Ghellini et al, 2009).
The first surveys on third-level graduates in more than one university and designed to be repeated were carried out by Stella3, and at a national level, by Istatt4. Both surveys were carry out on all graduates, due to the reference population size.
In designing the Stella survey, we adopted a simplified version of the questionnaire used in the Siena survey (Ghellini, 2009).. The questionnaire has a section on the employment status of PhD’s regarding their most recent job and several closed question useful to obtain elements for internal assessment of the PhD programmes.5 We added an open-ended question to obtain more suggestions and comments: the uncoded answers implied the application of text mining models in order to use also qualitative data. Moreover, the comments obtained could also be used to validate the internal assessment items, proposed as closed-ended questions. It is agreed that the opinions of PhD holders could be considered more reliable than the first and second level degree graduates.
This paper aims at highlighting and quantitatively measuring (through lexical and textual analysis) the themes in the improvements suggested by the PhD holders surveyed by STELLA, and combine them with the characteristics of the respondents. The interest is clearly focused on the substantial content of the phenomenon exploiting usual methodological approach to text analysis.
2. D
ATAThe data presented here are part of the three surveys carried out by STELLA from 2009 to 2011. The items of the questionnaire were ordered in such a way that – from the order of subjects –
3The STELLA survey was conducted from February to April 2009 on PhD holders between 2005 and 2007 in seven universities (Milano Statale, Bergamo, Brescia, Milano Bicocca, Palermo, Pisa and Scuola Superiore Sant’Anna). The University of Pavia ( a member of Stella) took part in later surveys.
4The ISTAT survey was conducted between December 2009 and January 2010 on PhD holders between 2004 and 2006 (Istat, 2010).
5See Romano (2009 and 2011) for the questionnaire used and a detailed description of survey design.
internal evaluation was more important for the universities than learning about future job opportunities: indeed, the first questions were on the evaluation of the PhD programs.
All three surveys were carry out on all graduates and performed in CAWI mode (Couper, 1998); some numerical details are reported in Table 2.
TABLE 2
Reference population and number of respondents in PhD surveys conducted by STELLA Year of PhD Population No contacts Refusals Respondents
2005-2006-2007 3,554 465 8 1,758
2008 1,493 148 65 883
2009 1,733 281 127 754
Total 6,780 894 200 3,395
The choice of the CAWI mode made the textual answers immediately available. Although the questionnaire elicited several textual answers on different topics, the analysed corpus consisted only of the responses to the open question on how to improve PhD courses. The question was worded as follows: “Sulla base della sua esperienza ha cambiamenti/miglioramenti da suggerire nell’organizzazione del corso di Dottorato?” 6
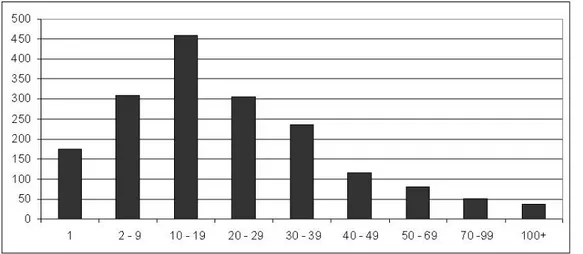
1,781 graduates (corresponding to 52.4% of the respondents) answered the question. The answers were quite heterogeneous in terms of extension. Indeed, there were 175 individuals who answered with only one word (no, nothing) up to a person who answered using 295 words. The average number of words used was about 25 (Fig.1).
Figure 1 – Distribution of the number of words contained in the responses The vocabulary consisted of 5,546 types for a total of 44,939 tokens.
The structural characteristics (categorical variables) of the individuals interviewed included: the field of study (Science, Agricultural Sciences and Veterinary Sciences, Biological and Earth Sciences, Economics and Statistics, Law, Political and Social Sciences, Engineering, Medical
6Based on your experience, do you have any suggestions on how to better organize the PhD program?
Sciences and Humanities), the university, gender and graduation year. We also included the level of satisfaction which refers to the item: “Sono molto soddisfatto dell'organizzazione didattica sperimentata durante il Dottorato”7, where 1 corresponds to “completely disagree” and 7 to ”completely agree”, and 4 to “neither agree nor disagree”8. This item received the highest number of negative scores in all the surveys (with differences between universities, fields of study and years of graduation). We assume that the most critical respondents were also the ones with the most suggestions; this allowed us to detect new themes that were unavailable in the closed questions.
3. CLASSIFICATION
PROCEDURE
AND
RESULTS
As part of the automatic categorisation of documents, a key problem is the correct attribution of one or more themes to identify the content of the text.
In default of predefined themes, we usually progress to a clustering of the documents according to their maximum similarity, subjecting a matrix of the Documents × Word type to cluster analysis. In our case, it is preferable to carry out a thematic clustering on the basis of a matrix of the Words × Structural modes type (Leclerc, 1975) because of the heterogeneity of the length of the different texts (responses). The purpose of this procedure is to see how we can exploit a univocal classification from a non-supervised clustering to produce a multiclass categorisation.
The goal of our work was achieved in three phases: (i) Information Extraction (IE), (ii) Cluster Analysis and (iii) Text Categorisation. Considering the purpose of our statistical analysis, we used TaLTaC2 software (Bolasco, 2010) for information extraction and text categorisation and SPAD software for cluster analysis.
3.1.
Information ExtractionVocabulary selection is one of the most important steps in a Text Mining (TM) procedure. According to different case studies, several methods can be followed in order to select distinct types of lexias. We can, for example, select forms according to their linguistic features in order to select words belonging to certain grammatical classes (nouns, adjectives, verbs). We can also use statistical indicators to select different types of language: the specific language, the characteristic language or the relevant language of the text (Bolasco, 2005). For our present case, the relevant language, obtained by calculating the term frequency–inverse document frequency (TF-IDF) (Salton, 1989) on the vocabulary forms, is the most suitable for our purpose. This index allows us to measure the weight of words in a given source. This weight, as an indicator of the relevance of the terms, is used (for example, on the world wide web) to measure the relevance of the content of a document with respect to a specific query, which in most cases consists of a simple list or combination of words. Such an index, calculated on the vocabulary at an occurrence threshold of 5, creates forms based on their discriminative power within the text. The TF-IDF index is
7Other items solicited opinions on some specific aspects:
- I’m very satisfied with the contents of the courses taken during my PhD program.
- I actually learned what it means to perform research during my PhD program. - My PhD degree is very useful in the job market.
- The contacts I made with my PhD professors are very useful for the job market
- The contacts I made with other people (excluding professors) during my PhD program are very useful for the job
market
8For more details, see Romano (2009 and 2011).
generally calculated as:
N
TF IDF tf
n
log
−
= ∗
(1)where the factor TF (term frequency) measures the number of occurrences of a form, while the factor IDF (inverse document frequency) is equal to the logarithm of the ratio between N (the number of documents constituting a corpus) and n (the number of documents which have that form). The index TF-IDF represents a weight assigned to each word based on its frequency and its distribution within the collection of documents, giving greater weight to the forms occurring only in a small number of documents.
By measuring the TF-IDF index on the vocabulary forms, we can extract the keywords that are concentrated only in a few documents and not spread out in the corpus. The words selected in this way will help us obtain cleaner thematic clusters because we eliminate the noise caused by forms (nouns, adjectives, articles, prepositions, etc) present in many documents.
In Table 3 we can see the ordering of the main content forms based on the TF-IDF index calculated on our data.
TABLE 3
Main forms selected with the TF-IDF calculation
Forms TF-IDF Occurrences
no 154.24 168 più 55.46 543 corsi 52.59 492 ricerca 50.77 668 dottorato 46.39 688 maggiore 45.82 257 non 37.95 445 dottorandi 37.48 352 formazione 34.76 205 didattica 32.63 184 attività 32.21 180 estero 32.17 205 corso 30.31 247 seminari 28.37 155 lavoro 28.25 191 organizzazione 27.81 134 lezioni 27.58 157 docenti 27.21 164 maggior 24.26 102 dottorando 23.51 189
3.2.
Identification of issuesThe cluster analysis allows us to group the selected words of the previous stage in clusters on the basis of distribution similarities inside the structural arrangements of individuals. The
clustering phase is an unsupervised classification of keywords used by the different types of respondents. The groups of words explain prevalent themes or semantic features that can be summarised into categories not defined a priori. For this purpose we consider the Keywords × Structural Mode matrix that profiles the selected forms to be classified on the basis of occurrences contained in the various characteristics of the individuals. By subjecting the matrix to the classical tandem chain, "simple correspondence analysis + cluster analysis", we gain a classification into K groups of words, homogeneous within them and heterogeneous between each other. The semantic field expressing this homogeneity can be seen in the proximity of the corresponding terms on the map of the factorial plane (Bolasco, 1999).
In our analysis, a matrix formed of 409 keywords in row and by the 30 modes relating to the 5 categorical variables in column (graduation year, field of study, university, gender, level of satisfaction) was subjected to factor analysis. A classification into 6 groups of keywords was then processed.
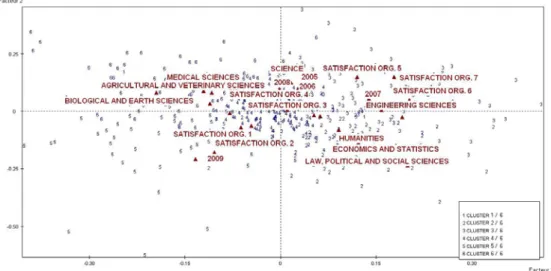
In the factorial plane in Figure 2 we can observe the distribution of words according to the 5 categorical variables chosen. The different numbers indicate the different semantic groups of the 6 subjects.
Figure 2 – Factor plan of keywords distribution compared to categorical mode
The six themes were defined on the basis of the words belonging to each group. In Table 4 we can observe some of the keywords of each thematic and structural arrangement that are more represented by each cluster. The words are listed in descending order of statistical significance, measured in terms of inertia, as ever smaller distances from the centroid of each cluster.
The first cluster concerns people who did not have any suggestions and those who were highly satisfied with the organisation of their PhD programme. The second cluster contains suggestions on how to improve the relationship between teachers and students. The third cluster contains proposals for internationalization and partnerships with companies to create job opportunities. The theme of the fourth cluster concerns the organisation of the courses. The fifth cluster contains suggestions on the educational programmes. The sixth cluster contains practical aspects such as skills and laboratories.
Since the numerical results of this item are critical (the negative judgments exceed 50% of the total responses and concern all the subject areas), it is interesting to note that the positive comments (Satisfaction 5-6-7) combined with the first and the third cluster. Moreover, if the first
cluster is not associated with specific subject areas, the field of Engineering is the one that expresses the highest number of comments related to the working world and it is associated with ratings of at least moderate satisfaction (Satisfaction 5 and 6).
The most negative numerical ratings (Satisfaction 1 and 2) are, on the other hand, associated with the second, the fourth and the fifth cluster (teacher- student relationship, organisation of courses and educational programmes). The sixth cluster is not related to the overall rating, with suggestions for technical skills and laboratories. This explains the increased presence of words used by PhDs in the fields of Biological, Earth and Agricultural Sciences and Veterinary Sciences.
TABLE 4
Semantic groups with relative structural modes
Theme T 1 T 2 T 3 Satisfaction Relationship between teachers and students Internationalization -Job Opportunities Clusters of keywords No nessun nessuno particolare suggerimento dottorandi docenti coinvolgimento coordinamento inserimento preparazione insegnamento confronto metodologia temi aspetti aggiornamento collegio accademico Formazione favorire estero scambi collaborazione aziende svolgere internazionalizzazio ne incrementare atenei esteri conferenze retribuzione incentivare lavoro futuro opportunità Relative Structural Modes Satisfaction Org. 7 Satisfaction Org. 6 Satisfaction Org. 5 2008 Univ A Law, Political and Social Sciences Humanities Satisfaction 1 Univ B Economics and Statistics Univ G Univ G Engineering Sciences 2007 2006 Satisfaction Org. 6 Satisfaction Org. 5 Satisfaction Org. 4
Theme T 4 T 5 T 6 Organization of
courses Educational program laboratories Skills and
Clusters of keywords maggior organizzazione dovrebbero meglio maggiormente progetti sistema numero studenti struttura competenze pubblicazione offerta migliore seminari lezioni organizzare incontri fornire ciclo frequenza opportuno argomento scelta esperienze approfondimento lingua inglese specifici argomenti inserire laboratorio contatto pratici tecniche partecipare esperti Relative Structural Modes Agricultural and Veterinary Science Satisfaction Org. 1 Univ C 2009 Univ H Medical Sciences Satisfaction Org. 2 Univ C
Biological and Earth Sciences
Biological and Earth Sciences Univ C 2008 Univ D Agricultural and Veterinary Science
3.3.
Text CategorisationAlthough, with cluster analysis, we can highlight the salient issues in the text, measure their intensity in individuals and match them with their structural characteristics, we must progress to a categorisation of a MultiClass type of responses on the basis of emerged thematic dictionaries (Bolasco and Pavone, 2008). To do this, we can consider the K thematic dictionaries, derived from the cluster analysis, as many textual queries for which we calculate the TF-IDF (TI) for each document. Each element of the matrix Documents × Queries (D×Q) is a TI index.
In this case the values of the TI index, calculated for each query in each document, allow us to measure the relevancy of a document with respect to the K thematic dictionaries. For example, by sorting the documents by decreasing IT value on the first textual query, we have an ordering of documents by relevance with respect to that query. Obviously, each respondent can list different enhancements so each document can have several positive TI values over different queries. These TI values are not, however, comparable with each other, as they are the expression of different textual queries. In order to classify multiple documents and estimate the probability degree of belonging to the different subjects, we have to proceed to a normalisation of the matrix values in order to make the TI comparable in a column as well as in a row. Normalisation is done by putting each TI value in relation to the maximum TI value of the textual query of belonging:
max ij ijnorm ij
TI
TI
TI
=
(2)At this point, all the values of TI of the D×Q matrix will have a value from 0 to 1. To know the fuzzy belonging value of the i-th document with respect to the j-th query (topic) we have to relativise the TI values to the total scores for the document, that is, the membership function will be given by the ratio between the TI value (ij) norm and the sum of the K normalised TIs:
1 ij norm ij K ij norm j
TI
F
TI
==
∑
(3)The new D×Q matrix will then contain fuzzy belonging values of documents to the issues represented by the textual query. At this point we can set a minimum probability threshold of Fij
by establishing the belonging of the document to the thematic category. In our case, the threshold value of probability was set at 18%9.
Thus, 1,665 responses out of 1,781 were categorised and only 6% of the responses remained unclassified. In many cases, the lack of categorisation was due to an off-topic response to the question or because the use of hapax terms was not included in the thematic dictionaries. Here are some of the answers that were not categorised:
- si consideri che in quanto dipendente medico in struttura ospedaliera ho svolto il mio dottorato e la mia attività di ricerca presso la mia struttura.10
- mi risulta che il corso sia stato ampiamente riorganizzato in seguito al suo inserimento nel contesto di una scuola dottorale. ciò rende priva di senso una mia risposta a questa domanda.11
Table 5 shows that 11% of the total respondents did not suggest improvements, while 42% suggested improvements to internationalization and employment prospects.
We must highlight that the respondents did not have any limit to the number of suggestions they could give. As highlighted in Figure 1, many thematic fields could have been therefore identified inside each response, composed by many words. The sum of categorised responses shown in Table 5 widely exceeds the number of respondents.
Excluding both the 116 non-categorised respondents and the 184 T1 theme respondents (without comments or suggestions), the remaining 1481 had, as a whole, 2663 thematic and categorised responses, with an average of 1.8 categorised responses for each subject.
In Table 5 we can see the size of the themes by field of study because 53% of the improvements suggested by respondents from the fields of Law, Political Sciences and Social Sciences concerned student-teacher relationship, while 49% of the suggestions made by respondents from the field of Engineering Sciences were for improved internationalization and employment prospects.
9 The threshold value reflects an a-priori hypothesis of indifference in the membership probability function. Empirical results of the analysis have then shown the validity of the a-priori assumption.
10 As a hospital physician, I carried out my PhD courses and my research work in my hospital.
11I understand that my PhD program was extensively reorganized after becoming part of a doctoral school. It therefore makes no sense for me to answer this question.
TABLE 5
Semantic groups with relative structural modes T1 Satisfaction Relationships T2 between teachers and students T3 Internatio nalizatio n - Job Opportun ities T4 Organiza tion of courses T5 Educatio nal program me T6 Skills and Laborato ries Number of Categorized responses 184 664 692 486 338 484 Science 0.12 0.30 0.40 0.28 0.09 0.29 Agricultural and Veterinary Sciences 0.05 0.30 0.41 0.36 0.20 0.41 Biological and Earth Sciences 0.07 0.31 0.40 0.26 0.23 0.43 Economics and Statistics 0.09 0.50 0.38 0.21 0.11 0.23 Law, Political and Social Sciences 0.13 0.53 0.29 0.22 0.28 0.17 Engineering 0.08 0.37 0.49 0.25 0.07 0.22 Medical Sciences 0.13 0.26 0.36 0.31 0.23 0.30 Humanities 0.10 0.49 0.39 0.27 0.24 0.14 All 0.11 0.40 0.42 0.29 0.20 0.29
It is remarkable how the comments were not restricted to this. In fact, only some of the identified clusters correspond to the items on which a rating was solicited. If the fourth and fifth clusters have themes that can be closer to the item “Sono molto soddisfatto dell'organizzazione didattica sperimentata durante il Dottorato”, the second, the third and the sixth cluster contain themes indirectly related to items used in the questionnaire. Yet their importance is highlighted in Table 6: they constitute the percentages of the first three sets of comments.
TABLE 6
Ranking of percentages of themes by disciplines
T1 T2 T3 T4 T5 T6 Sati-sfaction Rela-tionship between teacher and stu-dent Interna- tionali-zation - Job Op- por-tunities Organi-zation of cour-ses Educa-tional pro-gram Skills and La- borato-ries Science 5 2 1 4 6 3
Agricultural and Veterinary
Sciences 6 4 1.5 3 5 1.5
Biological and Earth
Scien-ces 6 3 2 4 5 1
Economics and Statistics 6 1 2 4 5 3
Law, Political and Social
Sciences 6 1 2 4 3 5
Engineering Sciences 5 2 1 3 6 4
Medical Sciences 6 4 1 2 5 3
Humanities 6 1 2 3 4 5
Total 6 2 1 3.5 5 3.5
Finally, the differences between themes, as well as the lack of differentiation for some of the background variables, give us further information (university, gender and graduation year).
4. DISCUSSION
AND
CONCLUSIONS
The basic condition for a text mining analysis is the quantity of textual fields completed by the respondents. The use of the CAWI mode allowed us to obtain texts of all lengths and the PhD holders provided many open-ended responses. More than half of the respondents made suggestions and the information they gave was remarkable, both for the quantity of words used and for the themes suggested. As can be seen from Figure 1, the majority of respondents were eager to share their observations and suggestions.
In our opinion, the initial aim of our textual analysis - to complete the results of the quantitative analysis - was achieved. As can be seen from Table 6, the respondents considered the new themes in the open-ended responses as the most important.
We should not underestimate that we can also place the respondents according to their individual characteristics, regardless of the numerical consistency of each subgroup. As mentioned in the introduction, this result is particularly useful in analysing data on each doctoral program since it overcomes the low number of the target population at this level of disaggregation.
A further aim was accomplished if we consider the correspondence between the numerical ratings the students gave to the aspects of their doctoral programme (organisation, external contacts, job placement) and the themes identified by textual analysis. In Figure 2 we can see the collocation of structural variables (field of study, university) to detected themes and the numerical evaluations made by the respondents, thus interweaving the qualitative and quantitative levels of analysis.
As mentioned above, the most critical numerical rating was the one related to teaching and the organization of the courses.
Finally, some of the themes found in the textual analysis did not correspond to the quantitative items. In future surveys, these new themes can be included with the same quantitative configuration as the other themes.
In conclusion, by placing text fields in a questionnaire, we can use text mining models which constitute an added value for the purpose of internal evaluation.
ACKNOWLEDGEMENTS
Although this paper is the result of a collaboration between the two authors, sections 1, 2 and 4 were written by Maria Francesca Romano and section 3 by Pasquale Pavone.
REFERENCES
S. BOLASCO (1999). Analisi Multidimensionale dei dati. Metodi, strategie e criteri di interpretazione. Roma, Carocci (2012, 1^ ed. Studi Superiori).
S. BOLASCO (2005). Statistica testuale e text mining: alcuni paradigmi applicativi. Quaderni di Statistica, no. 7, pp. 17-53.
S. BOLASCO (2010). TaLTaC2.10 Sviluppi, Esperienze ed Elementi essenziali di Analisi automatica dei Testi. LED, Milano.
S. BOLASCO, P. PAVONE(2008). Multi-class categorization based on cluster analysis and TF-IDF. In S. Heiden & B. Pincemin (eds.). JADT2008. Presses Universitaires de Lyon, vol. 1.
S. CAMPOSTRINI AND S. GERZELI (2009).Indagine sulla soddisfazione e sugli sbocchi professionali dei dottori di ricerca dell’Ateneo pavese. http://vulcanostella.cilea.it/fileadmin/Documenti/Executive_Pavia_Campostrini_Gerzeli.pdf. Last access 14/05/2013
M. P. COUPER, W. L. II NICHOLLS(1998).The History and Development of Computer Assisted Survey Information Collection. In M. P. Couper, R. P. Baker, J. Bethlehem, C. Z. F. Clark, J. Martin, W. L. II Nicholls, and J. O'Reilly (Eds.). Computer Assisted Survey Information Collection, New York, Wiley.
G. GHELLINI (2009).Indagine sulle esperienze lavorative dei dottori di ricerca dell'ateneo di Siena. In: E. Vagnoni, V. Ruggero (Eds). La formazione Universitaria. Il terzo ciclo e le scuole di dottorato. Ferrara: UnifePress, pp. 121-137.
G. GHELLINI, L. NERI, A. D'AGOSTINO (2009). Towards a Longitudinal Survey Design for PhD Evaluation. Quaderni di Statistica, no. 11, pp. 127-143.
C. GIROTTI, G.LUZZATTO (2010). Gli esiti occupazionali dei Dottori di ricerca: una indagine a Bologna. In Consorzio Interuniversitario Alma Laurea (a cura di). XI Rapporto sulla condizione
occupazionale dei laureati. Occupazione e occupabilità dei laureati. A dieci anni dalla Dichiarazione di Bologna. Il Mulino, Bologna.
ISTAT (2010). L’inserimento professionale dei dottori di ricerca. http://www.istat.it/it/archivio/3903. Last access 14/05/2013
A. LECLERC (1975). L’analyse des correspondances sur juxtaposition de tableaux de contingence. Revue de Statistique Appliquée, no. 23, pp. 5-16.
M .F. ROMANO (2009). Indagine sui Dottori di Ricerca 2005-2007 - il percorso formativo e i suoi esiti occupazionali e sociali. http://vulcanostella.cilea.it/top-menu/indagini-e-ricerche/indagini0/?no_cache=1&tx_drblob_pi1%5BdownloadUid%5D=107. Last access 14/05/2013
M. F. ROMANO (2011). Indagine sui Dottori di Ricerca 2008-2009 - il percorso formativo e i suoi esiti occupazionali e sociali. http://vulcanostella.cilea.it/top-menu/indagini-e-ricerche/indagini0/?no_cache=1&tx_drblob_pi1%5BdownloadUid%5D=187 Last access 14/05/2013
G. SALTON (1989). Automatic Text Processing: The Transformation, Analysis and Retrieval of Information by Computer
.
Boston, Addison-Wesley.SUMMARY
Models of text mining to measure improvements to doctoral courses suggested by “STELLA” phd survey respondents
We present Text Mining models to thematically categorise and measure the suggestions of PhD holders on improving PhD programmes in the STELLA survey (Statistiche in TEma di Laureati e LAvoro). The coded responses questionnaire, designed to evaluate the employment opportunities of students and assess their learning experience, included open-ended questions on how to improve PhD programmes. The Corpus analysed was taken from the data of Italian PhD holders between 2005 and 2009 in eight universities (Bergamo, Brescia, Milano Statale, Milano Bicocca, Pisa, Scuola Superiore Sant’Anna, Palermo and Pavia). The usual methodological approach to text analysis allowed us to categorize open-ended proposals of PhD courses improvements in 8 Italian Univesities.
Keywords: textual analysis; automatic classification; multi-class categorisation; TF IDF; assessment of the learning experience.