A NOTE ON THE BOOTSTRAP METHOD FOR TESTING THE
EXISTENCE OF FINITE MOMENTS.
Igor Fedotenkov1
Department of Economics, Bank of Lithuania. Vilnius, Lithuania Lithuanian Institute of Agrarian Economics, Vilnius, Lithuania
Assumptions that a finite moment of the first, second, fourth or another or-der exists appear in many theorems in econometrics and statistics. And so it is worthwhile to check if these assumptions are satisfied. One recent method was proposed by Fedotenkov (2013), who suggests applying bootstrap to this problem, and proves consistency of the suggested method. The method employs the idea of Derman and Robbins (1955): if a sample is drawn from a distribution with an infinite mean - under certain general assumptions when the number of observa-tions grows, the arithmetic mean of the sample grows faster than the arithmetic means of the subsamples of a smaller size. This method allows the researcher to test the assumption of the existence of the finite mean, skipping the step of the estimation of a tail index. One could think to use this test as a tail index or mo-ment estimator so as to increase sequentially a power to which the observations are raised until the test starts to reject the hypothesis that the corresponding fi-nite moment exists. The smallest power at which the test starts to reject the null hypothesis gives an inference about the tail index. Although this method of tail index estimation sounds logical and intuitive, our paper holds that it may lead to misleading results. One misunderstanding can already be seen at this stage: if this method skips the calculation of the tail index, why should it be used for tail index estimation? There are many methods designed intentionally for this purpose, several of which are discussed below.
Hypotheses about the existence of finite moments are usually checked assum-ing that the tail of the distribution P (X > x) behaves as x−γ, γ > 0, for large
x, estimating the tail index γ. The moments of an order larger or equal to the
tail index are infinite. The most popular method for employing this idea is the Hill estimator (Hill 1975), which estimates 1/γ. Deheuvels et al. (1988) presented conditions for consistency of the Hill estimator in the case of independent observa-tions. Resnick and St˘aric˘a (1998) proved its consistency for dependent stationary sequences. A common problem of the Hill estimator is that it is not always clear how many observations should be used for the tail index estimation. To improve the method, a number of modifications and improvements were suggested, includ-ing Hill plots - where the estimates of the tail index are plotted over the number of
observations treated as a tail, trusting that the region of stability of the plot would give an inference about the tail index. Once again, to improve this method, Hill plots with a logarithmic axis (Resnick and St˘aric˘a (1997), Drees, Resnick, and de Haan (2000)) were developed, and many other methods were proposed. Another weakness of the Hill estimator is that when applied to a sample drawn from a light-tailed distribution with infinitely many finite moments, it provides mislead-ing results. In such cases a more general moment estimator, such as DEdH shall be applied (Dekkers, Einmahl and de Haan (1989)). As we show in this paper, the use of bootstrap for testing the finiteness of higher-order moments if samples are drawn from distributions with infinitely many finite moments may also produce unreliable results.
The rest of this paper is organized as follows: In the next section possible misapplications of the test are described; section 2 presents examples based on Monte-Carlo simulations; section 3 concludes.
1. The test and its possible misapplications
Denote (X1, ..., Xn) a sample of size n drawn from a distributionF, Xi> 0, i = 1, ..., n. (X1∗, ..., Xm∗) is a bootstrap subsample with replacement of size m, m→
∞, m = o(n) as n → ∞, randomly and independently drawn from (X1, ..., Xn). The method introduced by Fedotenkov (2013) for testing the null hypothesis that the first moment of the distribution F is finite, with an alternative that it is infinite, works as follows: First a significance level α is chosen. Next, p-value is calculated: pn= 1 B B ∑ j=1 I (∑m s=1 Xj,s∗ /m > ξ n ∑ i=1 Xi/n ) . (1)
where I is a unity indicator function, B is the number of bootstrap subsamples and ξ is a constant 0 < ξ < 1 (close to 1). H0 is accepted if pn> α otherwise it is rejected.
As mentioned in Fedotenkov’s paper, if a researcher wants to test the existence of a finite k-th order moment, k > 0, he/she should raise the observations to the power k. Formally, the hypothesis can be reformulated in the following way:
1. H0: DistributionF has a finite k-th moment.
2. H1: DistributionF does not have a finite k-th moment.
Then, the p-value is calculated as
pn = 1 B B ∑ j=1 I (∑m s=1 Xj,s∗k/m > ξ n ∑ i=1 Xik/n ) , (2)
the rest of the testing procedure remaining the same. The proof of consistency of such a test easily reduces to the proof used by Fedotenkov (2013) for the first moments.
What are the possible applications of such a test? First, if a researcher wants to calculate descriptive statistics, such as mean, variance or skewness, the test
helps to ascertain if such statistics are meaningful. Second, if a researcher wants to use statistical or econometric techniques which require the assumption of the existence of a finite moment of a specific order, this hypothesis can also be tested. However, raising the given sample to an ever larger power until the test starts to reject H0 so as to estimate the tail index or a number of finite moments is not
recommended. The null-hypothesis is usually supposed to be more important than the alternative; the inequality of hypotheses leading to a bias in such an estimation. Furthermore, even if the sample is drawn from a distribution with infinitely many finite moments, at some power k the test starts to reject the hypothesis that the
k-th order moment is finite. This is shown in the following statement.
Denote the r-th order statistics of (X1, ..., Xn) as X(r), i.e. X(1)≤ X(2) ≤ ... ≤ X(n).
Proposition 1. Suppose that F is a continuous distribution with a positive
support, so that 0 < X(1) < X(2) < ... < X(n). Furthermore, suppose that the sample size n is large enough that m/n < α with the fixed significance level α, and the number of bootstrap subsamples B is sufficiently large. Then k0exists, k0<∞ such that for k > k0 the test rejects the hypothesis that the k-th order moment is finite with probability 1.
As it is assumed that the sample is drawn from a continuous distribution, the case
X(j) = X(j−1) for any j occurs with probability equal to 0, and does not affect
the analysis.
Proof. Denote ˆF(X) = ∑ni=1I(Xi < X)/n, and the probability measure corresponding to the empirical distribution function ˆF as P r∗:
P r∗ ( 1 m m ∑ s=1 Xs∗k > ξ n n ∑ i=1 Xik ) ≤ P r∗( n mξ m ∑ s=1 Xs∗k > X(n)k ) = (3) P r∗(X(n)∈ {X1∗, ..., Xm∗})P r∗ ( n mξ m ∑ s=1 Xs∗k > X(n)k X(n)∈ {X1∗, ..., Xm∗} ) + P r∗(X(n)∈ {X/ 1∗, ..., Xm∗})P r∗ ( n mξ m ∑ s=1 Xs∗k > X(n)k X(n)∈ {X/ 1∗, ..., Xm∗} ) .
First, consider the case when X(n) (the largest element in the sample) is not
in the subsample (X1∗, ..., Xm∗). In this case Xi∗≤ X(n−1), i = 1...m,
P r∗ ( n mξ m ∑ s=1 Xs∗k> X(n)k X(n)∈ {X/ 1∗, ..., Xm∗} ) ≤ P r∗ ( n ξX k (n−1)> X k (n) X(n)∈ {X/ 1∗, ..., Xm∗} ) = 0
if k > log (nξ−1)/ log (X(n)X(n−1−1)) =: k0. Thus, for k > k0the second term in the
Consider the first term in the right side of the equation (3). Using Bernoulli’s inequality, the probability that the largest element of the sample would be drawn into a subsample, can be evaluated as: P r∗(X(n) ∈ {X1∗, ..., Xm∗}) = 1 − (1 −
n−1)m≤ m/n < α. If the number of bootstrap subsamples B grows, pn, defined in equation (2), converges almost surely to the probability defined on the left side of equation (3) according to the Glivenko-Cantelli lemma; thus, if B is large enough, the test rejects the hypothesis that the moment of order k is finite, k > k0,
with probability 1.
It follows from proposition 1 that even if the sample of size n is drawn from a distribution with infinitely many finite moments, a power k0can be found so that
the hypothesis that the k0-th (or higher) moment is finite is rejected. According to
the definition of k0, k0is itself a random variable, but for a fixed sample this value
is fixed and finite. Definitely, if H1 is valid, when n grows, k0 also increases, and
we may expect that the probability of making the first-order mistake decreases. But with a fixed-sample-size, increase of k may yield misleading results.
Similarly, if the sample is drawn from a distribution with super-heavy tails, such as a log-Pareto or log-Cauchy distribution, with tail indexes equal to zero, (such distributions do not have finite positive moments), misleading results can be achieved. Raising the given sample to an ever-smaller power k until the test starts to accept H0in order to estimate the tail index is not a wise strategy either.
For distributions with super-heavy tails such an approach would overestimate the tail index. This property is formally formulated and proved in the following proposition.
Proposition 2. Suppose thatF is a continuous distribution with a positive
support, so that 0 < X(1) < X(2) < ... < X(n). Furthermore, suppose that the number of bootstrap subsamples B is sufficiently large. Then such k1exists, k1> 0 that for k, 0 < k < k1 the test accepts the hypothesis that the k-th order moment is finite with probability one.
Proof. Recall that ξ is a constant 0 < ξ < 1.
P r∗ ( 1 m m ∑ s=1 Xs∗k > ξ n n ∑ i=1 Xik ) = P r∗ ( X∗k/Xk > ξ ) ≥ (4) P r∗((X(1)/X(n))k > ξ ) = 1, if k < log(ξ) log(X(1)/X(2)) = k1> 0. (5)
Analogous to proposition 1, if the number of bootstrap subsamples B grows,
pn, defined in equation (2), converges almost surely to the probability defined in the left side of the equation (4) according to the Glivenko-Cantelli lemma; thus, if B is large enough, the test accepts the hypothesis that the moment of order k, 0 < k < k1, is finite with probability 1.
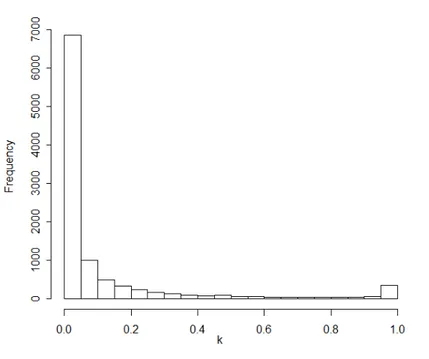
Figure 1 – The smallest moments for which H0 is rejected (lognormal distribution).
2. Monte-Carlo example
In this section two Monte-Carlo examples are presented to illustrate the perfor-mance of the test in case of distributions with infinitely large number of moments, and no finite positive moments at all. This Monte-Carlo experiment gives some insight about the range of moments for which the test performs well, and also gives indications when the test makes too many mistakes. The first example illustrates test performance for a sample drawn from the standard lognormal distribution of size n = 200, when k increases. Lognormal distribution has infinitely many finite moments, thus H0 is true for each k, k > 0. The bootstrap subsample size is set
to m = 5(≈ log n), parameter ξ is equalized to 0.9. 10,000 samples were drawn, from each of them 5,000 bootstrap subsamples with replacements were randomly selected.
Figure 1 is a histogram of the smallest integer moments for which the test rejects the hypothesis that k-th finite moment exists. 1% of the largest values are not included in the histogram; the inclusion of values near 350 would have made the histogram unreadable. As seen in the figure, sometimes the numbers of estimated moments in the samples are not large, indicating that the effects discussed in the paper hold not only for very large moments. The test committed no mistakes for k = 1. For higher moments the test did not perform so well. Namely, for k = 2 the test was in error in 0.2% of cases. For k = 3 the test rejected the null hypothesis in 2.43% of cases, and for k = 4 the rate of rejections exceeded the 5% level (6.47%). Therefore, the conclusion can be drawn that, in this case, the test makes a reasonable number of mistakes for k ≤ 3, and it is better not to use it for higher moments.
Figure 2 – The largest moments for which H0 is accepted (log-Pareto distribution).
The second example illustrates test performance in the case of super-heavy tails. Namely, samples were drawn from a log-Pareto distribution with shape and scale parameters equal to 1. k was then gradually reduced from k = 1 till k = 0 by 0.01 steps till the test accepted the hypothesis that the corresponding moment was finite with the significance level 0.05. The remainder of the experimental design (sample-sizes, number of bootstrap subsamples, etc.) was unchanged from the previous example. The results of this experiment are presented in Figure 2.
In 1.52% of cases, the test accepted the hypothesis that the first moment is finite; 5% error level was achieved checking the finiteness of the k > 0.67. In 31.54% of cases, the test accepted the hypothesis of the finiteness of k > 0.05 moments; in 32.62% of cases, the test rejected the hypothesis that the k = 0.01 moment is finite and made no mistakes. Again it could be concluded that the test performed rather well for testing the finiteness of moments, which are close to 1.
The R code, which was used for simulations, can be found in the online ap-pendix on the author’s personal web page.
3. Conclusions
This short note advises caution in using the test for the existence of finite moments, developed by Fedotenkov (2013) to estimate tail indexes or numbers of moments. We found that the test may perform poorly with the hypothesis that high order moments are finite, and even if a sample is drawn from a distribution with infinitely many finite moments, such a k0 exists that the test rejects the hypothesis about
the k-th k≥ k0 order finite moment existence. As Monte-Carlo simulations show, the test performs well when it is applied for testing the finiteness of the first three moments, with the best results for the testing if the first moment exists. Similarly, a reduction of k, with k > 0, may overestimate the tail index if the sample is taken from a distribution with super-heavy tails with the tail indexes equal to zero. But the test performs rather well when it is used for testing if the finite moments of an order close to unity exist.
References
P. Deheuvels, E. Haeusler, M. D. Mason (1988). Almost sure convergence of
the Hill estimator. Mathematical Proceedings of the Cambridge Philosophical
Society, 104, no. 2, pp. 371–381.
A. L. M. Dekkers, J. H. J. Einmahl, L. de Haan (1989). A moment estimator
for the index of an extreme-value distribution. The Annals of Statistics, 17, no. 4,
pp. 209–222.
C. Derman, H. Robbins (1955). The strong law of large numbers when the first
moment does not exist. Proceedings of the National Academy of Sciences, 41,
no. 8, pp. 586–587.
H. Drees, S. Resnick, L. de Haan (2000). How to make a Hill plot. The Annals of Statistics, 28, no. 1, pp. 254–274.
I. Fedotenkov (2013). A bootstrap method to test for the existence of finite
moments. Journal of Nonparametic Statistics, 25, no. 2, pp. 315–322.
B. Hill (1975). A simple general approach to inference about the tail of a
distri-bution. The Annals of Statistics, 3, no. 5, pp. 1163–1174.
S. Resnick, C. St˘aric˘a (1997). Smoothing the Hill estimator. Advances in Applied Probability, 29, no. 1, pp. 271–293.
S. Resnick, C. St˘aric˘a (1998). Tail index estimation for dependent data. Annals of Applied Probability, 8, no. 4, pp. 1156–1183.
Summary
This paper discusses a bootstrap-based test, which checks if finite moments ex-ist, and indicates cases of possible misapplication. It notes, that a procedure for finding the smallest power to which observations need to be raised, such that the test rejects a hypothesis that the corresponding moment is finite, works poorly as an estimator of the tail index or moment estimator. This is the case especially for very low- and high-order moments. Several examples of correct usage of the test are also shown. The main result is derived analytically, and a Monte-Carlo experiment is presented.