CONVERGENCE PROCESSES IN DEVELOPING COUNTRIES’ POPULATIONS AND THE ROLE OF FAMILY PLANNING COMMITMENTS
P. Farina, L.E. Ortensi
1. INTRODUCTION
We live in a world that is politically and economically influenced by demographic issues. The imbalance between poor and rich world’s populations, their own differ-ent structural characteristics – very young or very old – along with the considerable immigration waves from countries that are facing demographic and economic tran-sition, for example, contribute in fueling the international political debate, with of-ten no real perception of the demographic dimension of the themes at stake.
The recent events occurred on the Southern bank of the Mediterranean cannot be understood if, for example, we don’t take into account the young structure of the Egyptian population that has a median age of 24 years. This has directly or indirectly influenced the social and economical evolution of the country, creating at the same time some strained situations within the generations overlooking a-dulthood and the labor market.
Such a process, not only has to do with African countries: 95% of the latest 25-year old cohorts, still lives in poor countries, a billion being between 15 and 24 and another 1.8 billion even younger.
TABLE 1
World population by economic development and major area, 1960-2050 (thousands)
Population Increase (%)
1960 2010 2050 1960-2010 2010-2050
World 3,038.4 6,895.9 9,306.1 127.0 35.0
More developed countries 913.3 1,235.9 1,311.7 35.3 6.1
Less developed countries 2,125.1 5,660.0 7,994.4 166.3 41.2
Of which, least developed 243.7 832.3 1,726.5 241.5 107.4
Africa 286.7 1,022.2 2,191.6 256.5 114.4
Asia 1,707.7 4,164.3 5,142.2 143.9 23.5
Latin America & Caribbean 220.1 590.1 751.0 168.1 27.3
North America 204.3 344.5 446.9 68.6 29.7
Oceania 15.8 36.6 55.2 131.6 50.8
Europe 603.9 738.2 719.3 22.2 -2.6
World 3,038.4 6,895.9 9,306.1 127.0 35.0
More developed countries 913.3 1,235.9 1,311.7 35.3 6.1
Less developed countries 2,125.1 5,660.0 7,994.4 166.3 41.2
The world’s demographic landscape has radically changed over the past dec-ades. The world’s population, that consisted of one billion of inhabitants at the beginning of 1800, is now seven times larger. It took more than a century to dou-ble that first billion, yet the following figures have come faster and faster, until the time gap only lasted twelve years, the intervening period between the fifth (reached in 1987) and the sixth billion (reached in 1999). The new millennium is still characterized by growth – never below the doorstep of 80 million people – with an increase speed equal to two people and an half per second or, in other words, doubling Argentina’s population within a year or filling up twelve US bas-ket stadiums in a single day. According to the most recent predictions of the United Nations, depending on such dynamics the Earth will host around ten bil-lion people in 2050 with an increase – estimated as from today – equal to the population amount of the previous century.
The world’s population is bound to triple by the middle of the present cen-tury1, yet the interest in the consequences of such a growth is decidedly held
down, as it shows itself in conjunction with an unquestionably positive signal: the reduction of growth speed.
Picture 1 – Natural growth rates according economic development, 1970-2010 (medium variant). Source: United Nations, Department of Economic and Social Affairs, Population Division (2011).
As a matter of fact, from the second half of the 1980s onward, the growth rate first reduced in high-income countries and then in the others, basically dragged down by fertility decline. The present growth rate is mainly due to the inertial effect of demo-graphic processes, the so called population momentum, a circumstance caused by the still high number of fertile generations, who still give rise to numerous groups, not-withstanding their demand for children is lower than the previous cohorts.
1 The latest UN Prospect estimates that world population will reach ten billions within 2100. See
The generations in reproductive ages nowadays have been basically determined by the different decline speeds of fertility and mortality. The life expectancy at birth has increased by twenty-one years between 1950 and the present, with lesser rates in high-income countries (eleven years), whose conditions at the time were more favorable. Much more important is the level achieved by developing coun-tries – six months a year for a total of twenty-four – even though the last comers of demographic transition had gained five years less approximately. Fertility too has decreased, thus reaching by the 1970s the replace level in high-income countries, while in the poor ones such a decrease started later and at a slower rate.
The graphic representation of the main demographic parameters gives a rather clear idea of both unevenness among countries and the processes at stake. No one of the high-survival rate countries has high fertility and there are countries with low survival rate and high fertility. These positions are understandable wi-thin the framework of demographic transition. However, it turns much more in-teresting to observe that for a large group of countries the relationship between the two dimensions is insubstantial, as – although their fertility level stands within the interval from two to three children – they show differences of up to twenty years in life expectancy at birth. Such heterogeneity is due to the peculiarity of the political action in each country, to which the strategies of birth control belong as well.
Picture 2 – Fertility and survival in developing countries by major area, 2010.
Towards the end of the 1960s – before the adoption of the First World Popu-lation Plan of Action in 1974 – several countries have undertaken the path of birth control programs. Regarded as useless by some, essential for others, such plans turned out to be among the most important policies in the last seventy ye-ars. The starting timing and the strategies undertaken have been different, based on those ideological or cultural prejudices which are well shown in the world’s conferences held every decade from 1974 onward. The suspicion aroused in poor countries that birth control would serve as a way to re-establish the prewar inter-national order caused contrasts between the socialist anti-malthusian coalition and the capitalist one. Later on this ideological opposition gave way to the one between liberalism and dirigism approaches, with the former backing the devel-opment of economy as the most effective way to slow population growth down within the poor world. The laissez-faire policy had to be replaced ten years later in Cairo by a new approach, according to which individuals and their rights repre-sent the hub of any political action. The rephrasing of political strategies accord-ing to such an individual-based approach had the result to marginalize demo-graphic issues, only proposed if connected to the goal of individual rights satisfac-tion (Micheli, 2010).
Yet, birth control is more than ever a relevant issue due to its positive effects on poverty reduction, health improvement and preservation of ecosystems, with-out saying that population control could make more likely to realize the eight Mil-lennium Development Goals.
The marginalization of demographic questions has been fueled also by aca-demic debates. Many scholars tried to demonstrate that birth control has a mar-ginal impact on the system since contraception doesn’t increase if a demand of limit birth hasn’t already played out, and the costs are too much higher than cor-responding benefits and above all the majority of marginalized populations are often excluded from such policies, although they would be the ones more in need of support. Others, on the other hand, supported the idea that family planning programs played an important role on fertility decline. This should be confirmed by the fact that the decrease of attention on population control – also in donors and financing – slowed fertility decline in a number of countries, undermining population projections, as minor variations in fertility have deep effects on the future size and age structure of populations (Boongarts, 2006 and 2008).
The present contribute describes the different paths of worldwide convergence processes during the last 15 years by means of socioeconomic dimensions in a-bout one hundred of poor countries – representing 80% of the world’s popula-tion – to different degrees of development at the middle of nineties. The descrip-tion of the main dimensions affecting the most important changes and how they have taken place in the last 15 years will be discussed together with the role of family planning programs commitments.
2. FAMILY PLANNING PROGRAMS COMMITMENT
Family planning programs have their crucial prerogative in satisfying the right to reproductive health. Notwithstanding that, if thought with respect to both fer-tility containment and control, they’re defined in connection with the possibility to provide information about contraception and contraceptives’ supply.
The programs carried out during the last two decades on either a voluntary or coercive basis, in institutionalized or informal ways, share some common traits: legislative and economic support, continuity of actions, the potential to hand down such actions as an improvement of health conditions or a speed-up in the development process. These traits have been summarized by the United Nations in few indicators, so as to compare different national contexts at the beginning of the new century (United Nations, 2002).
First, the government view of fertility level identifies the perception of the overall acceptability of fertility intensity: not satisfactory because too low; satis-factory; and not satisfactory because too high. The second indicator regards the Government intervention classified as action to raise, lower or maintain the fer-tility level. Finally four categories of governmental policy concerning individual fertility behavior were adopted to categorize countries: (a) Government limits access to information, guidance and materials in respect of modern methods of contraception; (b) It does not limit access to information, guidance and materi-als but provides no direct or indirect support for their dissemination; (c) Gov-ernment provides indirect support for the dissemination of information, guid-ance and materials by subsidizing the operating costs of organizations support-ing such activities outside the Government’s own services. The indirect support may take various forms: direct grants, tax reductions etc; (d) It provides direct support for the dissemination of information, guidance and materials within government facilities.
The majority of governments of the examined countries (60%) regard their fer-tility as high, thus taking into account a proper and consistent action to control it. An even larger percentage of the involved governments directly support the dis-semination of information and contraceptives.
Among the countries satisfied with their fertility level, 80% gained replacement level or are almost there. Anyway, the number of countries that still consider their fertility level as too high even if they are very closed to replacement level proba-bly because population increase is perceived as an effect of reproductive attitude rather than the result of the inertia of demographic process.
The contraceptive prevalence and the total fertility rate are deeply connected, as are the political actions in support of contraceptive use. In detail, it can be ob-served that in almost every country in which the use of contraceptives is low, fer-tility rate is high. On the contrary, countries where the use of contraceptives is widespread have completed (or are about to complete) their demographic transi-tion.
Picture 3 – Contraceptive prevalence and fertility in developing countries, 2005.
Yet some relevant exceptions still remain. Countries in which, notwithstanding low contraceptive prevalence, the process of demographic convergence has been started off (or it’s in an advanced stage). They are Eastern European in the main and have used, more than others, abortion as a contraceptive device.
TABLE 2
Fertility levels and contraceptive prevalence by major area, 2007 Contraceptive prevalence (%) < 25 25-|50 50-|66 > 66 Fertility below 2.1 5 East Europe, 1 Asia 1 Middle East 3 East Europe, 2 Middle East, 2 Latin America 3 East Europe, 2 Africa, 4 Latin America, 3 Asia Fertility
between 2.1-3.0 1 East Europe
1 Africa, 4 Asia, 2 Middle East 4 East Europe, 2 Latin America, 4 Asia, 3 Middle East, 4 Africa 10 Latin America, 1 Asia Fertility between 3.1-4.9 4 Africa 9 Africa, 2 Latin America, 1 Asia, 1 East Europe 1 Latin America, 1 Africa Fertility 5 or more 1 Asia, 15 Africa, 1 Middle East 4 Africa, 1 Latin America
Source: Authors elaborations from UN source.
3. DATA AND METHODS
In order to explain if and how transformations have taken place between 1996 and 2010 in the developing world a set of indicators deriving from International
Agencies are used. The selection of countries with a good availability of data led to a fully satisfactory territorial representation of the developing world2.
TABLE 3
Number of countries and population amount
Areas Number of countries % within number of countries Population covered (thousands, 1996) % within the sampled population (1996) Population covered (thousands, 2010) % within the sampled population (2010) European Union 4 3.7 30,179 0.6 28,300 0.5 Central/Eastern Europe 6 5.6 279,123 5.9 277,900 4.9 Northern Africa 6 5.6 159,324 3.4 208,600 3.7 Western Africa 13 12.1 207,475 4.4 300,800 5.3 Oriental Africa 13 12.1 215,673 4.6 314,300 5.6 Central/Sothern Africa 10 9.3 130,959 2.8 116,600 2.1 Western Asia 12 11.2 162,680 3.5 218,000 3.9 Central/Southern Asia 11 10.3 1,313,312 27.9 1,678,300 29.7 Oriental Asia 10 9.3 1,721,930 36.6 1,931,200 34.2
Central Sothern America 21 19.6 480,976 10.2 573,700 10.1
Oceania 1 0.9 4,331 0.1 6,800 0.1
Total 107 100.0 4,705,961 100.0 5,654,500 100.0
Source: Authors elaborations from cited source.
The world convergence process is described thru a factor analysis. Each coun-try has been analyzed in two different years to allow the comparison of factor scores for different countries in the same year and for a country in two different points in time3.
As a conclusion to this analysis an ordinal regression with a logit link function has been performed to value if the pace of changes in economic development and commitment in family planning had both a significant part in the determina-tion of the demographic transidetermina-tion phase.
2 When data were not available for a specific year an estimation has been provided on the basis
of data related to same period years. For the few cases where no information was available in the same five-year period of interest, an imputation was performed via an Expectation Maximization (EM) algorithm after an accurate analysis of missing values patterns.
3 The value of Kaiser-Meyer-Olkin measure of sampling adequacy for these data is 0.940 and
the Bartlett’s test of sphericity is highly significant (p<0.001) confirms that factor analysis is appro-priate for these data. The 3 factors extracted explain the 77.4% of total variance. After varimax rota-tion the first factor accounts for 35.7% of total variance, the second for 25.0% and the third for 16.6%.
TABLE 4
Variables used in Factor Analysis Adolescent fertility rate (births per 1,000 women ages 15-19)
Mortality rate, under-5 (per 1,000)
Maternal mortality ratio (modeled estimate, per 100,000 live births) Mortality rate, infant (per 1,000 live births)
Life Expectancy at Birth, Both Sexes (years) Total Fertility Rate (TFR)
Contraceptive prevalence - any method (% of women ages 15-49) Literacy rate, adult total (% of people ages 15 and above) % of population with access to drinking water
Poverty headcount ratio at $1.25 a day (PPP) (% of population) Population ages 0-14 (% of total)
Births attended by skilled health staff (% of total) Rural population (% of total population) Urban population (% of total) GDP per capita (current US$)
Malnutrition prevalence, height for age (% of children under 5) Population ages 65 and above (% of total)
Share of women employed in the nonagricultural sector (% of total nonagricultural employment) Population growth (annual %)
Distance between actual and replacement-level fertility in 1996 and 2010 [(TFT1996-TFT2010/TFT1996-2.1)]
4. POPULATION MATTERS: CHANGES IN THE DEVELOPING WORLD 1996-2010
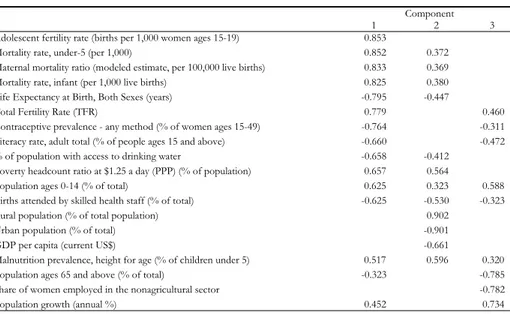
The Factor Analysis performed on the set of data listed above gave as result the extraction of 3 dimensions. Table 5 shows the factor loadings for each vari-able onto each factor after rotation. The first factor was therefore labeled as “De-mographic and development convergence”, the second as “Macroeconomic con-ditions and deprivation” and the third as “Population structure”. A high score on the first factor in one or both years of analysis indicates a severe underdeveloped country with low life expectancy, high mortality, fertility and illiteracy, low con-traceptive prevalence. Similarly a high score on the second factor marks a context with high levels of poverty and a traditional agricultural based economy. This di-mension is considered in the theory of transition directly connected to the demo-graphic process thru a passage from an agricultural economy to an urban-industrial based structure with a raise of income and improvements in female empowerment (Angeli & Salvini, 2008). High levels on the third factor pertain to areas with fast level of population growth, sustained by a population with a tradi-tional (pre-transitradi-tional) population pyramid.
TABLE 5 Rotated component matrix
Component
1 2 3
Adolescent fertility rate (births per 1,000 women ages 15-19) 0.853
Mortality rate, under-5 (per 1,000) 0.852 0.372
Maternal mortality ratio (modeled estimate, per 100,000 live births) 0.833 0.369
Mortality rate, infant (per 1,000 live births) 0.825 0.380
Life Expectancy at Birth, Both Sexes (years) -0.795 -0.447
Total Fertility Rate (TFR) 0.779 0.460
Contraceptive prevalence - any method (% of women ages 15-49) -0.764 -0.311
Literacy rate, adult total (% of people ages 15 and above) -0.660 -0.472
% of population with access to drinking water -0.658 -0.412
Poverty headcount ratio at $1.25 a day (PPP) (% of population) 0.657 0.564
Population ages 0-14 (% of total) 0.625 0.323 0.588
Births attended by skilled health staff (% of total) -0.625 -0.530 -0.323
Rural population (% of total population) 0.902
Urban population (% of total) -0.901
GDP per capita (current US$) -0.661
Malnutrition prevalence, height for age (% of children under 5) 0.517 0.596 0.320
Population ages 65 and above (% of total) -0.323 -0.785
Share of women employed in the nonagricultural sector -0.782
Population growth (annual %) 0.452 0.734
A first confirmation that a process of demographic and development conver-gence is actually taking place comes from the analysis of the distributions of first factor scores in the two different moments of observation. The median values of the two distributions show a decrement from a value of -0.23 in 1996 to -0.32 in 2010. Such drop becomes more evident thru indicators more sensitive to ex-tremes value, like the simple mean (-0.28) or the 5% trimmed mean (-0.27). The latter indicator in particular supports the idea that the variation is not due only to extreme values. We detect also a reduction of dispersion, with lower values for indexes as range and interquartile range, variance and standard deviation. The change in the sign of kurtosis means that for 2010 scores more of the variance is the result of infrequent extreme deviations while in 1996 is due to frequent mod-estly sized deviations. The general trend towards lower scores is also confirmed by the shift of extreme values, in particular of the maximum – which has a de-crease of 0.81 – while the lower value shows a variation of -0.33. Moreover the effective change in the values in the two different points in time comes also from the Wilcoxon Signed Ranks test which is significant.
TABLE 6
Distribution of scores for factor 1 – Demographic and development convergence 2010-1996 Factor 1 –
Demographic transition 2010 Statistic Error Std. Factor 1 – Demographic transition 1996 Statistic Error Std.
Mean -0.143 0.087 Mean 0.143 0.104
Lower Bound -0.316 Lower Bound -0.062
95% Confidence
Interval for Mean Upper Bound 0.031 95% Confidence Interval for Mean Upper Bound 0.348
5% Trimmed Mean -0.180 5% Trimmed Mean 0.087
Median -0.328 Median -0.231 Variance 0.820 Variance 10.149 Std. Deviation 0.905 Std. Deviation 10.072 Minimum -10.878 Minimum -10.551 Maximum 20.219 Maximum 30.033 Range 40.097 Range 40.583
Interquartile Range 10.195 Interquartile Range 10.518
Skewness 0.708 0.234 Skewness 0.828 0.234
Kurtosis 0.013 0.463 Kurtosis -0.0159 0.463
As studies on demographic transition point out, is more appropriate to recog-nize more than one transition path instead of a common process for all countries. If we accept this approach, then it is really important to understand where and why the convergence has been more evident.
TABLE 7
Extreme scores for factor 1 – Demographic and development convergence 2010- 1996
2010 1996
Countries Value Countries Value
1 Angola Pre transitional country 2.219 Niger Pre transitional country 3.033 2 Chad Pre transitional country 2.071 Sierra Leone Pre transitional country 2.851 3 Mali Pre transitional country 1.977 Congo Ongoing transition 2.712 4 Sierra Leone Pre transitional country 1.934 Angola Pre transitional country 2.656 Highest
5 Nigeria Pre transitional country 1.749 Mali Pre transitional country 2.405 1 Sri Lanka Very advanced transition -1.878 Sri Lanka Very advanced transition -1.551 2 Viet Nam Transition completed -1.831 Thailand Transition completed -1.446 3 China Transition completed -1.541 China Transition completed -1.397 4 Albania Transition completed -1.396 Trinidad and Tobago Transition completed -1.388 Lowest
5 Uzbekistan Very advanced transition -1.368 Bosnia Herzegovina Transition completed -1.361
Considering the top 5 lowest and highest scores on the first factor for each ye-ar of analysis we observe that countries with highest scores ye-are neye-arly all pre-transitional countries from Sub Saharan Africa whereas lowest scores all pertain to countries where transition is already completed or is very close to be com-pleted. Again, observing the changes in scores between the two moments in time we note that countries with the best performance on the first factor are all pre transitional countries or ongoing transitional, the farthest group to the achieve-ment of the developachieve-ment goals. On the contrary, countries where no changes are recorded are nearly all in a very advanced phase of transition.
TABLE 8
Absolute difference in scores from years 1996 to 2010 for factor 1 – Demographic and development convergence
Case Number Transition phase Value
1 Rwanda Pre transitional country (-) 1.71
2 Ethiopia Pre transitional country (-) 1.63
3 Niger Pre transitional country (-) 1.54
4 Congo Ongoing transition (-) 1.49
Highest absolute difference in scores
5 Eritrea Ongoing transition (-) 1.35
1 Mexico Very advanced transition (+) 0.01
2 Argentina Very advanced transition (-) 0.01
3 Mauritius Transition completed (+) 0.01
4 Kuwait Very advanced transition (+) 0.02
Lowest absolute difference in scores
5 Cote d’Ivoire Ongoing transition (+) 0.02
Picture 4 – Score variation 1996-2010 for transition phase Boxplot. Factor 1.
The phase of demographic transition is very important in order to assess direc-tion and intensity of the variadirec-tion: pre transidirec-tional countries more likely have a negative variation on the score, pointing out a faster pace in the direction of con-vergence, while ongoing transitional and very advanced transitional countries mark lower changes. Countries that have completed their transitional path can show positive variations probably due to the actual economical crisis that can slightly worsen indicator levels.
The difference in scores variation is definitely linked to the phase of transition. Pre transitional countries show in 2010 a mean score wich is higher than that one registered for ongoing transitional countries in 1996. While in the period of ob-servation very advanced transitional countries reached and scored better than those where transition is completed, the other two groups remain clearly far from them and at different levels of convergence.
TABLE 9
Mean and median scores for factor 1 by transition phase
Transition phase 2010 1996 Mean -0.695 -0.739 Median -0.574 -0.694 N 27 27 Transition completed Std. Deviation 0.545 0.419 Mean -0.647 -0.409 Median -0.620 -0.443 N 36 36
Very advanced transition
Std. Deviation 0.439 0.441 Mean 0.217 0.621 Median 0.061 0.548 N 22 22 Ongoing Transition Std. Deviation 0.718 0.717 Mean 0.999 1.651 Median 0.828 1.615 N 22 22
Pre transitional country
Std. Deviation 0.778 0.772
If we introduce the geographical detail we observe that, within the group of countries where transition is completed, European and Latin American countries show a low raise in scores meaning that, even if fertility is below replacement le-vel, some parameters related to development have slightly worsened. On the o-ther hand Asian countries show a decrease. In the cluster of very advanced transi-tion countries, Northern African countries had the highest mean reductransi-tion. In the set of pre transitional and ongoing transition states, where reductions were generally higher, Asian countries had the best performance in both groups.
TABLE 10
Mean scores and reduction for factor 1 by transition phase and area
Transition phase Area 2010 1996 Var. 2010-1996
Mean -0.541 -0.663 0.122 N 10 10 10 European Area Std. Dev. 0.426 0.413 0.130 Mean -0.912 -0.795 -0.117 N 9 9 9 Asia Std. Dev. 0.575 0.409 0.444 Mean -0.454 -0.641 0.187 N 6 6 6 Transition completed
Central Sothern America
Std. Dev. 0.613 0.482 0.215 Mean -1.061 -0.585 -0.475 N 4 4 4 Northern Africa Std. Dev. 0.269 0.456 0.334 Mean -0.799 -0.521 -0.278 N 18 18 18 Asia Std. Dev. 0.389 0.485 0.360 Mean -0.403 -0.246 -0.157 N 12 12 12
Very advanced transition
Central Sothern America
Std. Dev. 0.304 0.320 0.376 Mean 0.547 0.927 -0.379 N 13 13 13 Sub-Saharan Africa Std. Dev. 0.664 0.731 0.706 Mean -0.613 0.021 -0.634 N 5 5 5 Asia Std. Dev. 0.179 0.394 0.303 Mean -0.001 0.369 -0.370 N 3 3 3 Ongoing Transition
Central Sothern America
Std. Dev. 0.265 0.511 0.293 Mean 1.053 1.681 -0.629 N 20 20 20 Sub-Saharan Africa Std. Dev. 0.690 0.736 0.615 Mean 0.459 1.350 -0.891 N 2 2 2
Pre transitional country
Asia
Std. Dev. 1.735 1.422 0.313
Economic development and poverty as measured by scores on the second fac-tor point out that even if mean, trimmed mean and median show a general reduc-tion4 – indicating the existence of a transition towards an economies less
agricul-ture dependent and a reduction in levels of poverty and deprivation – heterogene-ity has grown, meaning higher difference between rich and poor countries.
TABLE 11
Distribution of scores for factor 2 – Demographic and development convergence 2010-1996 Factor 2 –
Demographic transition 2010 Statistic Error Std. Factor 2 – Demographic transition 1996 Statistic Error Std.
Mean -0.079 0.101 Mean 0.079 0.092
Lower Bound -0.278 Lower Bound -0.104
95% Confidence
Interval for Mean Upper Bound 0.121 95% Confidence Interval for Mean Upper Bound 0.262
5% Trimmed Mean -0.040 5% Trimmed Mean 0.105
Median -0.016 Median 0.112 Variance 1.083 Variance 0.914 Std. Deviation 1.041 Std. Deviation 0.956 Minimum -4.035 Minimum -2.703 Maximum 2.079 Maximum 1.930 Range 6.115 Range 4.633
Interquartile Range 1.448 Interquartile Range 1.171
Skewness -0.647 0.234 Skewness -0.407 0.234
Kurtosis 1.203 0.463 Kurtosis 0.214 0.463
TABLE 12
Extreme scores for factor 2 - Macroeconomic conditions and deprivation 2010- 1996
2010 1996
Countries Value Countries Value
1 Burundi Ongoing transition 2.079 Burundi Ongoing transition 1.930 2 Nepal Very advanced transition 1.803 Viet Nam Transition completed 1.846 3 Sri Lanka Very advanced transition 1.771 Nepal Very advanced transition 1.833 4 Bangladesh Very advanced transition 1.563 Sri Lanka Very advanced transition 1.817 Highest
5 Papua New Guinea Ongoing transition 1.508 Bangladesh Very advanced transition 1.650 1 Un. Arab Emirates Transition completed -4.035 Un. Arab Emirates Transition completed -2.703 2 Kuwait Very advanced transition -2.738 Kuwait Very advanced transition -2.589 3 Venezuela Very advanced transition -2.312 Saudi Arabia Very advanced transition -1.844 4 Gabon Ongoing transition -2.059 Gabon Ongoing transition -1.822 Lowest
5 Saudi Arabia Very advanced transition -2.039 Argentina Very advanced transition -1.745
Picture 6 – Score variation 1996-2010 for transition phase Boxplot. Factor 2.
The distribution of extreme values demonstrates that the economic dimension is not as closely related to the level of fertility as the development convergence. The presence of countries in transition within the group with the lowest scores proves that starting transition with a delay in economical development is possible, if proper policies are carried forward. On the other hand, advanced positions in transition are more likely where there is a good level of development.
Picture 7 – Absolute Score variation 1996-2010 for transition phase Boxplot. Factor 2. TABLE 13
Mean and median scores for factor 2 by transition phase
Transition phase Variation 2010-1996 2010 1996
Mean -0.353 -0.520 -0.167 Median -0.310 -0.519 -0.314 N 27 27 27 Transition completed Std. Deviation 0.292 1.078 1.009 Mean -0.186 -0.272 -0.086 Median -0.161 -0.354 -0.175 N 36 36 36
Very advanced transition
Std. Deviation 0.269 1.122 1.081 Mean -0.044 0.296 0.340 Median -0.048 0.336 0.448 N 22 22 22 Ongoing Transition Std. Deviation 0.191 0.953 0.937 Mean 0.014 0.403 0.388 Median 0.002 0.486 0.430 N 22 22 22
Pre transitional country
Std. Deviation 0.279 0.564 0.481
The relation between economic development and transition stage is indirect. If progresses recorded by the first factor about mortality, health conditions, educa-tion and contracepeduca-tion are directly related – and partially included – to the level of transition, the economical dimension doesn’t follow the same path. While the analysis of the first factor scores shows that higher progresses in convergence ha-ve been made by countries at the beginning of their transition, trends for the sec-ond factor in the years 1996-2010 show that advanced transition countries had better performances in terms of economic convergence. This is also confirmed by the exact Wilcoxon Signed Ranks Test on the second factor that is significant for the whole distribution but, if performed in each class of demographic transition, is not significant for ongoing and pre-transitional classes. This means that
coun-tries at an initial level of demographic transition show no significant variation in the economic dimension in the period of analysis. It is therefore clear why distri-bution in 2010 for the second factor has a higher level of dispersion compared to 1996 and as well why variation in scores in the period 1996-2010 for factor 1 and factor 2 shows a significant (at 0.01 level) inverse nonparametric and parametric correlation5 (-0.579 and -0.573). This means that countries that have completed
transition, or are very close to end it, show higher progresses on the economical side while countries in first phases of transition, or that haven’t still begin it, have better performances on the development side (as they had definitely a worst ini-tial situation) but didn’t show similar progresses on the economical level.
Again, if we analyze extreme values in variation for the span of time 1996-2010 in the second factor scores we see that the top five countries where economic condi-tion worsen are nearly all pre-transicondi-tional, while the best performances are recorded for very advanced transition states. It’s interesting to point out the differences be-tween the two world “giants” India and China: while the latter had great improve-ments on the economic side, Indian economic remains still, showing no variations.
TABLE 14
Extreme scores for variation on factor 2 - Macroeconomic conditions and deprivation 2010- 1996
Countries Value
1 Pre transitional country Yemen 0.54
2 Pre transitional country Guinea-Bissau 0.50
3 Pre transitional country Guinea 0.45
4 Pre transitional country Niger 0.30
Worsening conditions 1996-2010
5 Ongoing Transition Congo 0.29
1 Transition completed United Arab Emirates -1.33
2 Very advanced transition Venezuela -0.80
3 Very advanced transition Indonesia -0.80
4 Transition completed China -0.80
Best performances 1996-2010
5 Transition completed Trinidad and Tobago -0.73
1 Transition completed Mongolia 0.00
2 Very advanced transition Peru 0.00
3 Very advanced transition India 0.00
4 Pre transitional country Zambia 0.01
No variation in scores
5 Ongoing Transition Central African Republic 0.01
How can we explain poorest countries progresses in terms of demographic convergence if very few improvements took place on the economical side? Gov-ernment policies play an important part. Where interventions to lower fertility were carried out, the reduction of scores on factor 1 is significantly higher. This means that commitments to fertility reduction can bring general positive effects not only in fertility levels, but also in improving health and survival6. The last
5 Test for normality – as the number of cases is 107 Shapiro-Wilk and Kolmogorov Smirnov
ex-act test for normality were used – show that both distribution can’t be considered normal even if the p-value are low (0.10 and 0.14 for first test for differences on factor 1 and 2, 0.39 and 0.36 for the second test).
6 Jonckheere-Terpstra Test for ordered differences among classes (in a scale where “no
interven-tion” is considered as a class between “to raise” and “to maintain”) is significant, meaning that there is a decreasing trend in the median of difference in factor 1 as the government intervention changes from an intervention to raise fertility to an intervention to lower fertility. The same relation emerges also thru non parametric correlation which is also significant at 0.01 level.
pert Panel on Fertility, Reproductive Health and Development held in New York in December 2010 came to the same conclusion, underling for example that without the past declines in fertility – due largely to increase of contraceptive us-ers – the numbus-ers of maternal deaths would have been about 1.7 million higher between 1990 and 2008 (Blanc, 2010).
TABLE 15
Mean and median scores on factor 1 by transition phase and type of Government intervention on fertility level Transition phase Government intervention on fertility level Mean Median N Std. Deviation
To raise 0.176 0.132 9 0.223 No intervention 0.099 0.103 8 0.268 To maintain -0.038 -0.054 3 0.115 Transition completed To lower -0.153 -0.042 7 0.410 To raise 0.194 0.194 1 . No intervention -0.258 -0.262 7 0.227 To maintain -0.218 -0.191 4 0.203
Very advanced transition
To lower -0.252 -0.241 24 0.434 To raise 0.071 0.071 2 0.071 No intervention -0.594 -0.479 4 0.542 To maintain -0.775 -0.775 1 . Ongoing Transition To lower -0.391 -0.681 15 0.639 No intervention -0.491 -0.483 4 0.646
Pre transitional country
To lower -0.689 -0.782 17 0.614 To raise 0.160 0.131 12 0.196 No intervention -0.233 -0.167 23 0.458 To maintain -0.220 -0.099 8 0.282 Total To lower -0.392 -0.328 63 0.560
The third factor shows population structure convergence and marks the path from a structure with a high percentage of young people and a high growth rate to a population with an older structure and a low or negative growth rate. Simi-larly to economical dimension, the tendency for years between 1996 to 2010 is significantly negative, meaning a general convergence to an older population structure, with a raise in variability among countries. Increasing negative skewness indicates that the tail on the left side of the probability density function is longer than the right side and the bulk of the values lie to the right of the mean, toward values that indicate a pre transitional structure of population for most of the countries and a small number of states characterized by extremely low values.
TABLE 16
Distribution of scores for factor 3 – Population structure 2010-1996
2010 Statistic Error Std. 1996 Statistic Error Std.
Mean -0.204 0.098 Mean 0.204 0.092
Lower Bound -0.398 Lower Bound 0.022
95% Confidence
Interval for Mean Upper Bound -0.010 95% Confidence Interval for Mean Upper Bound 0.386
5% Trimmed Mean -0.167 5% Trimmed Mean 0.226
Median -0.100 Median 0.337 Variance 1.027 Variance 0.898 Std. Deviation 1.013 Std. Deviation 0.948 Minimum -3.040 Minimum -2.196 Maximum 1.951 Maximum 2.773 Range 4.990 Range 4.969
Interquartile Range 1.119 Interquartile Range 1.130
Skewness -0.742 0.234 Skewness -0.433 0.234
Arabic countries where transition was very fast (for example Saudi Arabia had a TFR of 6 in 1996 that reached the level of 2.3 in 2010) have highest scores and now find themselves with a very young population and a high growth rate; the same is for countries with a classical pre-transitional structure like Yemen. On the other side Eastern European countries have a post transitional structure and it is clear the beginning of an ageing process.
TABLE 17
Extremes scores for factor 3 – Population structure 2010-1996
2010 1996
Countries Value Countries Value
1 Yemen Pre transitional country 1.951 Un. Arab Emirates Transition completed 2.773 2 Un. Arab Emirates Transition completed 1.941 Yemen Pre transitional country 2.108 3 Saudi Arabia Very advanced transition 1.596 Saudi Arabia Very advanced transition 1.926 4 Jordan Very advanced transition 1.388 Jordan Very advanced transition 1.910 Highest
5 Iraq Ongoing Transition 1.373 Algeria Very advanced transition 1.833 1 Ukraine Transition completed -3.039 Latvia Transition completed -2.196 2 Belarus Transition completed -2.746 Estonia Transition completed -2.185 3 Latvia Transition completed -2.670 Ukraine Transition completed -2.185 4 Uruguay Transition completed -2.560 Lithuania Transition completed -1.944 Lowest
5 Georgia Transition completed -2.549 Belarus Transition completed -1.929
2010 1996
Picture 8 – Population Pyramid - Saudi Arabia.
Source: US census bureau – online resources www.census.gov.
All countries that had positive variation in scores for factor 3 during the period 1996-2010 are pre transitional or ongoing transitional. As a matter of fact the corre-lation between variation on first factor and third factor is significant (p<0.01) and strongly inverse (-0.825): nations that had the best results in lowering mortality face an initial growth and rejuvenation of population because fertility is still highly over replacement level. On the other side, countries that mark the highest lowering scores on structure indicator are nearly all advanced in the process or have com-pleted transition: they are beginning the convergence to reduction and ageing.
2010 1996
Picture 9 – Population Pyramid – Yemen.
Source: US census bureau – online resources www.census.gov.
2010 1996
Picture 10 – Population Pyramid – Ukraine.
Source: US census bureau – online resources www.census.gov. TABLE 18
Extreme scores for variation on factor 3 – Population Structure 2010-1996
Countries Value
1 Eritrea Ongoing transition 1.30
2 Niger Pre transitional country 1.22
3 Ethiopia Pre transitional country 1.11
4 Senegal Pre transitional country 1.01
Highest
5 Congo Ongoing transition 0.87
1 Zimbabwe Ongoing transition -2.25
2 South Africa Very advanced transition -1.57
3 Lebanon Transition completed -1.39
4 Uruguay Transition completed -1.38
Lowest
5 Gabon Ongoing transition -1.37
1 Tajikistan Ongoing transition 0.01
2 Benin Pre transitional country 0.01
3 Iraq Ongoing transition 0.01
4 Burkina Faso Pre transitional country 0.03
No variation
5 Sierra Leone Pre transitional country 0.04
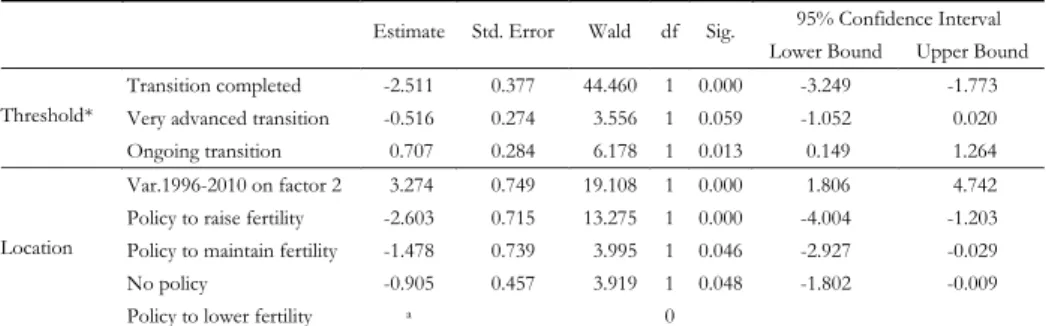
In order to check the effects of economic improvements and policies on the probability of being at a certain phase of transition, an ordinal logistic regression has been performed.
The interpretation of the location parameters shows that both economical and policy actions do have a role in the determination of the transition phase A positive
parameter estimate means that as the values of the location variable increase, there is a greater likelihood of higher values of the threshold (dependent) variable. Here, a positive estimate for variation on factor 2 in the years 1996-2010 means that as these values rise to positive and higher values, transition takes on a higher value (here coded so higher values are related to lower progress in transition). We could also say that for a one unit of increase in variation there is a 3.274 increase in the expected log odds as one moves to the next higher-coded category of the depend-ent, transition phase. An interesting fact is that scores for the second factor for year 1996 and for year 2010 had previously been included in the model, but were found not significant. For the variable indicating the presence and the aims of policies – an ordered categorical factor – negative coefficients for a given level of the inde-pendent mean a likelihood of lower scores on the ordinal deinde-pendent compared to the reference level of the independent. Thus the negative parameter of -2.63 for the category “existence of policies to raise fertility” means that, compared to the cate-gory “existence of policies to lower fertility”, having policies to raise fertility is asso-ciated with lower code values transition (which actually is being a country where transition is complete), for these data. But the main information that we get from this model is that the role of policies is significant in the determination of the tran-sition phase as it is the pace of economic development. It is worth noting also that the absolute level of economic development is not significant (p=0.171). The pa-rameter however was positive meaning, obviously, that lower factor scores are re-lated to advanced phases of transition. This finding is not surprisingly because many country cases (like Sri Lanka and Bangladesh) showed that if there are good policies of family planning the transition can begin and would be carried on even if economic development doesn’t act as the main factor.
TABLE 19 Parameter Estimates
95% Confidence Interval Estimate Std. Error Wald df Sig.
Lower Bound Upper Bound
Transition completed -2.511 0.377 44.460 1 0.000 -3.249 -1.773
Very advanced transition -0.516 0.274 3.556 1 0.059 -1.052 0.020
Threshold*
Ongoing transition 0.707 0.284 6.178 1 0.013 0.149 1.264
Var.1996-2010 on factor 2 3.274 0.749 19.108 1 0.000 1.806 4.742
Policy to raise fertility -2.603 0.715 13.275 1 0.000 -4.004 -1.203
Policy to maintain fertility -1.478 0.739 3.995 1 0.046 -2.927 -0.029
No policy -0.905 0.457 3.919 1 0.048 -1.802 -0.009
Location
Policy to lower fertility a 0
Notes: Link function: Logit. * Reference category Pre-transitional country. a. This parameter is set to zero because it is
redun-dant.
5. CONCLUSIONS
Developing countries are a miscellaneous reality, but the differences among na-tions have a clear geographical distribution with a concentration of high fertility
and pre transitional countries in sub Saharan Africa. This fact will play an impor-tant role in the determination of future trend for World population in the next 50-100 years. The projections just released by United Nations point out that the highest potential for future population growth is in high-fertility countries. Between 2010 and 2100, the medium variant projects estimates that high fertility countries population would more than triple while that of intermediate fertility countries would increase by just 26 per cent, from 2.8 to 3.5 billion. Whereas the populations of both the low-fertility countries and the intermediate-fertility coun-tries are projected to peak before the end of the century, that of the high-fertility countries would continue to increase during the whole period (United Nations, 2011).
Picture 11 – Countries and area classified by fertility level. Source: United Nations, 2011.
Our analysis has synthetically pointed out main changes for 107 developing countries on the three main dimensions of convergence (social development, economy and population structure) in the period between 1996 and 2010. For all these three dimensions the convergence is underway, but while results on devel-opment and demographic dynamics saw a general reduction of disparity between poorest and richest countries, the ones recorded on the other two dimensions mark growing differences among states. While major progresses in mortality re-duction, access to health and fertility services have been made by countries that in 1996 had worst situations, on economic side main progress was recorded for the most wealthy countries increasing differences between poorest and richest. What is really happening is that countries in the European area are growing fast toward European standards and countries from the Gulf area are growing as well with particular benefits deriving also from a structure where fertility had a quick reduc-tion and ageing is not still a reality. This third dimension had a similar trend with fast convergence of European countries to negative growth and lesser variation for other areas. Again there is an inverse relation between development and
population structure convergence, mainly due to mortality reduction not followed by a concurrent drop in fertility. As economic development slows, an increasing important part is played by family planning policies that can significantly drive demographic transition in a context where even small differences in fertility levels sustained over long periods have a major impact on the future population.
Department of Statistics PATRIZIA FARINA
University of Milano Bicocca LIVIA ELISA ORTENSI
REFERENCES
A. ANGELI, S. SALVINI (2008), Popolazione e sviluppo nelle regioni del mondo, Il Mulino, Bologna. A. BLANC(2010), The contribution of family planning to the reduction of maternal deaths United
Na-tions Expert Panel on Fertility, Reproductive Health and Development - Panel discussion,
New York, 7/12/2010.
J. BOONGARTS, (2006), The Causes of Stalling Fertility Transition, in “Studies in Family Plan-ning”, vol. 37, n. 1, pp. 1-16.
J. BOONGARTS, (2008), Fertility Transition in Developing Countries: Progress or Stagnation?, Popula-tion Council, Poverty Gender, and Youth Working Paper, n. 7.
J.B. CASTERLINE, (2001), The Pace of Fertility Transition: National Pattern in the Second Half of the
Century, in R.A. BULATAO, J.B. CASTERLINE(2001), Population and Development Review
Vol. 27, Supplement: Global Fertility Transition, pp. 17-52.
J. CLELAND, S. BERNSTEIN, A. EZEH, A. FAUNDES, A. GLASIER. J. INNIS, (2006), Family planning: the
Unfinished Agenda, in “The Lancet”, vol. 368, pp. 1610-1627.
R. EASTWOOD, M. LIPTON, (1999), The impact of Changes in Human Fertility on Poverty, in “Devel-opment Studies”, Vol. 36, pp. 1-30.
R. FREEDMAN, B. BERELSON, (1976), The record of Family Planning Programs, in “Studies in Fam-ily Planning”, vol. 7, n. 1, pp. 2-40.
N.E. HIMES, (1940), A Decade of Progress in Birth Control, Annals of the American Academy of
Po-litical and Social Science, Sage, vol. 212, pp. 88-96.
G. MICHELI, (2011), Demografie, Mc Grow Hill, Milano.
W.C. ROBINSON, J.A. ROSS, (2007), The Global Family Planning Revolution, three decades of population
policies and programs, World Bank, Washington D.C.
J.J. SPEIDEL, D.C. WEISS, S.A. ETHELSTON, S.M. GILBERT, (2009), Population Policies, Programmes and
Environment, Philosophical Transactions of the Royal Society B, n. 1532, pp. 3049-3065.
UNITED NATIONS, (2002), Abortion Policies: A Global review, Population Division, New York. UNITED NATIONS, (2011), World Population Prospect – Medium Fertility Variant. The 2010
Revi-sion, Press Release 3/5/2011, New York.
DATA WAREHOUSE WEBSITES http://www.un.org/esa/population/
http://www.census.gov/ipc/www/idb/informationGateway.php http://www.devinfo.info/
http://www.prb.org/DataFinder.aspx
http://www.unfpa.org/swp/ http://www.who.int/research/en/ http://www.worldbank.com/
SUMMARY
Convergence processes in developing countries’ populations and the role of family planning commitments
We live in a world that is politically and economically influenced by demographic is-sues. Structural and economical characteristics and health issues play a significant role in the international political debate with often no real perception of their importance. The process of economical and demographical convergence in Developing World doesn’t fol-low the same path for all countries. The analysis of indicators related to the last 15-years period shows that a widespread improvement in demographic and development indica-tors doesn’t come along with a similar economic development. As a matter of fact on this second dimension countries that were at a more advanced economical stage in 1996 had the best improvements, while least developed remain still deepening pre-existing inequali-ties. Population structure follows a similar differentiation among countries that show first signs of ageing and others that remains with a pre-transitional structure. In this context family planning can significantly drive demographic transition even in absence of a sub-stantial economic development.