CHAPTER III
EXPERIMENTAL PART AND DATA DISCUSSION
3.1. general consideration.
This thesis regards the possibility to obtain Polymer dispersed metal nanoparticle ( PDMNP ) films having a high optical transparency ( at least in the visible region ) and having a high electric conductivity. Another objective of the work was to study the morphologic, electric and optical properties of these films. It turned out that the requirements above mentioned were not easy to obtain. Many trials have been made to use conventional dispersing mechanisms ( ultrasound sonication, mechanical stirring etc. ) to obtain the composite films, but no regular dispersion could be obtained, since aggregation of preformed metal nano-particles in the used polymer matrices ( PVB, PVF, PVA, plyacrilates ) could not be avoided. Always the dimensions of metal aggregates were very dispersed and were ranging between some nanometer to microns. In these conditions a very efficient optical scattering was always observed and the composite films resulted very opaque in the visible region even in the case of films not ticker than 10 microns.
Due to this initial failure work has been addressed to system were the metal nano-particle could be obtained “in sito” during a polymerization process due to chemical reaction of metal cations with the polymer precursor. In other words, the possibility to obtain the composite films by a redox reaction occurring between a metal cation and the monomer undergoing the polymerization, has been explored. More precisely the attention has been devoted to the possibility to obtain silver nano-particle dispersed Poly-Acrylo-Nitrile ( PAN ) by reacting the Ag+ cation with the Acrylonitrile ( AN ) monomer. The reactive system in this case can be simply prepared by dissolving the silver nitrate ( AgNO3) into the polar AN monomer.
Before this thesis only one literature work, concerning silver nanoparticles, was available with respect to this possibility: a 2003 work by Zhang ed Han [1]. These authors have studied a composite polymer dispersed silver nano-particle film, obtained by polymerizing in bulk a solution of silver nitrate in Acrylonitrile ( AN ), by means of a thermal radical initiator, with the main aim to show that size of the nano-particle, obtained into the polymer film, was strictly correlated to the concentration of the silver nitrate into the precursor solution. In particular these authors have shown that the nanoparticle diameter obtained during the thermo-polymerisation of AN is almost linearly correlated
investigation of this reactive methodology has pointed out many limitation with respect to the possibility to obtain large surface PDMNP tin film. The main limitation was linked to the use of a thermal polymerization process occurring at 110°C. In this condition the reaction needs to be made in an autoclave, in order to prevent the evaporation of the monomer which is indeed very volatile ( boiling point of AN = 77 °C (350 K) ). In these experimental conditions, due to the monomer evaporation, it is very difficult to control tin film thickness and particle size.
For this reason attention has been devoted to the adoption of an U.V. polymerization mechanism to avoid high temperature conditions. There was a further reason to adopt a Photon assisted reaction mechanism. In the presence of photons the silver cation is directly able to subtract electron to other chemical substrates ( the reaction of Ag+ with the bromide anion is the case historically involved in the photograph process ). In principle, giving UV photons to a solution of silver nitrate in the AN monomer, the following reactions become possible:
AN + Ag+ + h = AN+ + Ag ( nanoparticle nucleation and growth) (1) nAN + AN+ = (AN)n-AN+ ( polymer growth) (2)
( Scheme 1 )
In this reactive contest the polymerization of the AN monomer can be contemporaneously assisted by an U.V. radical initiator, according to the following scheme:
IN + h (3)
AN + IN* = AN* -IN ( monomer radical formation ) (3)
nAN + AN*-IN = (AN)*n-AN*-IN ( polymer growth ) (4)
( Scheme 2 ) A further reaction scheme becomes possible:
IN + Ag+ + h = IN+ + Ag (nanoparticle nucleation and growth) (5) AN + IN+ = AN+ + IN (6)
nAN + AN+ = (AN)n-AN+ (polymer growth) (7)
( scheme 3 )
Scheme 3, even if can influence the reactive kinetic details, is equivalent to scheme 1. In conclusion one can introduce two polymerization mechanism to control the film formation. One of this mechanism leads to the nucleation and growth of nano particles ( scheme 1 ) and the other only to the growth of the polymer. The second mechanism can be used as a further control mean to regulate the polymer and nanoparticle relative fractions
by changing the amount of an IN initiator while kipping constant the other precursor solution concentrations.
One of the aspect of this work was to investigate the relative influence of the reactive scheme 1 and scheme 2 on the morphology as well as on the electric and optical properties of the composite PDMNP films by changing the formulation of the precursor solution . More precisely, the reaction kinetics have been graduated by adding into the precursor solution different amount of silver nitrate and of an U.V. radical initiator.
A wide field of chemical formulations have been investigated by changing the concentration of both the silver nitrate ( from 2 to 25% ) and the IN initiator ( from 0 to 25% ).
3.2 Sample preparation.
Samples have been prepared by using the 2,2’ Dimethoxy-2- phenil acetophenone ( Irgacure 651) photo-initiator under an irradiation power of 110±50 µW/cm2 at the wavelength of 365 nm.
All samples have been prepared by inserting the fluid precursor solutions between two plate of ITO coated glass ( electrodes for voltage application during electric investigation ). To avoid short circuit between two plate of ITO coated glass a rigid cell like shown in fig. 3.1. was made
Fig 3.1. Preparation of the cell for PDMNP preparation.
ITO layer glue 25-µm spacer glass glass
The cell were filled by the precursor solution thanks to capillary effect (fig. 3.2), before monomer polymerization, as indicated in fig. 3.2
Fig.3.2. cell refilling by the precursor solution .
For polymerization of the precursor solution it has always used an irradiation time of about ten minutes.
3.3 Morphology investigation.
The morphology of the film, obtained according to the procedure described in the above paragraph, have been studied by transmission electron microscopy. After polymerization a small quantity of the film put in resin and used ultramicrotome for cutting ultra-thin (80 nm) sections of resin embedded samples.
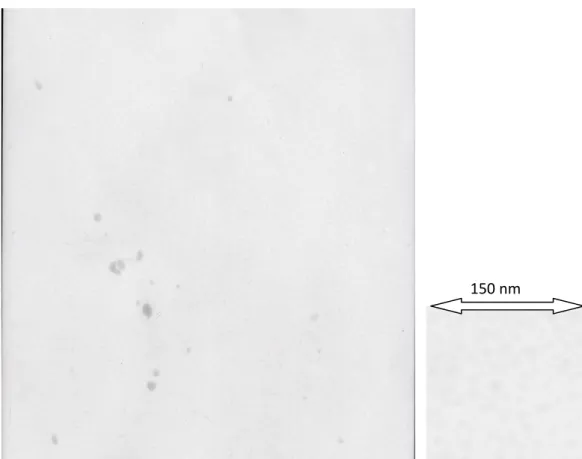
Examples of the film morphology obtained for different formulation of the precursor solution are shown in the next figures 3.3-3.7.
Picture width 1600nm, average particles size 12nm
Fig. 3.3 TEM Photograph of a PDMNP film obtained by polymerization of a solution containing AgNO3 (15%) in Acrylonitrile ( AN)
Picture width 1600nm, average particles size 11nm
Fig. 3.4 TEM Photograph of a PDMNP film obtained by polymerization of a solution containing AgNO3 (15%) and Irgacure initiator ( 2%) in Acrylonitrile ( AN)
150 nm
Picture width 1600nm, average particles size 5nm
Fig. 3.5 TEM Photograph of a PDMNP film obtained by polymerization of a solution containing AgNO3 (10%) and Irgacure initiator ( 2%) in Acrylonitrile ( AN)
Picture width 1600nm, average particles size 6nm
Fig. 3.6 TEM Photograf of a PDMNP film obtained by polymerization of a solution containing AgNO3 (10%) and Irgacure initiator ( 5%) in Acrylonitrile ( AN)
150 nm
Picture width 1600nm, average particles size 7nm
Fig. 3.7 TEM Photograph of a PDMNP film obtained by polymerization of a solution containing AgNO3 (15%) and Irgacure initiator ( 5%) in Acrylonitrile ( AN)
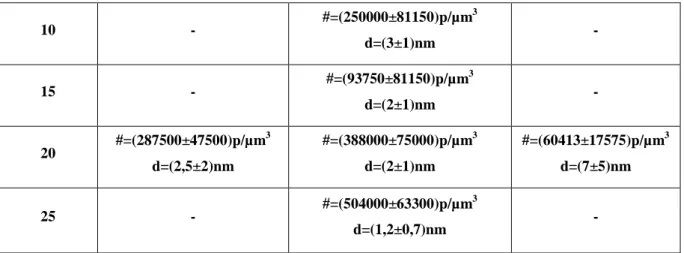
The TEM picture were analyzed in order to measure the nano-particle diameter (d) and density (#). These parameters have been obtained by a visual inspection of the photographs. The results are reported in following table ( table 3.1 ). Here the missing data are related to sample which could not be polymerized or for which no clear TEM analysis could be obtained due to the small dimension of the nano- particles or other experimental difficulties. The standard deviation have been estimated by analyzing several spots in each of the photograph. AgNO3, % In, % 10 15 20 0 - #=(9687±3653)p/µm 3 d=(12±6)nm - 2 #=(57425±28475)p/µm 3 d=(5±1)nm #=(10438±2075)p/µm3 d=(11±6)nm - 5 #=(57050±9650)p/µm 3 d=(6±2)nm #=(45513±4262)p/µm3 d=(7±2)nm - 150 nm
10 - #=(250000±81150)p/µm 3 d=(3±1)nm - 15 - #=(93750±81150)p/µm 3 d=(2±1)nm - 20 #=(287500±47500)p/µm 3 d=(2,5±2)nm #=(388000±75000)p/µm3 d=(2±1)nm #=(60413±17575)p/µm3 d=(7±5)nm 25 - #=(504000±63300)p/µm 3 d=(1,2±0,7)nm -
Tab.3.1 Nano-particle diameter (d) and density (#) at different formulations
A qualitative understanding of the influence played by the concentrations of the silver nitrate and polymerization initiator can be obtained by observing the graphs of the measured morphologic parameters as a function of IN and silver nitrate concentrations.
Dependence density of nanoparticles # from concentration of photoiniziator 0 1 2 3 4 5 0 5 10 15 20 25 N(In), % #, 105 p/µm3 N(AgNO3) = 15%
Fig. 3.8 Nano-particle density( nanoparticle/ cubic micron) as a function of the
Dependence diameter of nanoparticles d from concentration of photoiniziator 0 2 4 6 8 10 12 14 0 5 10 15 20 25 N(In), % d, nm N(AgNO3) = 15%
Fig. 3.9 Nano-particle diameter( nanometers ) as a function of the Photoinitiator
concentration.
The trend of the nanoparticle density and diameter with respect to the Irgacure concentration increase ( Fig. 3.8 and Fig. 3.9 ) allows the following qualitative considerations.
First of all let as to notice that as the Irgacure Inititor concentration increases the diameter of the nanoparticle decreases but contemporaneously the density of nanoparticles increases. One should expect that the activation of the reactive scheme 2 should depress reaction 1 in scheme 1 due to the reduction of photons number ,contemporaneously captured in reaction 3 of scheme 2. Thus the increase in Irgacure concentration should bring to a decreasing of the total amount of reduced silver metal. It is not easy to decide what exactly happens when looking directly at the graphs of fig 3.8 and 3.9, since from one side the diameter of the nanoparticles decreases, but the density of the particles increase. In order to get some insight into this problem one can estimate the volume fraction of silver metal from data reported in tab. 3.1. This important parameter can be calculated according to the equation:
Volume fraction= 0 3 0 A g # 2 3 4 V V V d
Where d is the particle diameter and # is the particle density ( number of nanoparticles/micron3 ).
Results are reported in the following tab. 3.2.
Even if the dispersion of the nanoparticle diameter affects very strongly the calculations of the estimated volume, the general tendency ( even if with some minor oscillations ) to decreasing of the silver volume fraction with increasing of the Irgacure concentration, is shown by data reported in Tab.3.2. One can conclude that the activation of scheme reactive 2 brings to decrease of the total amount of silver metal into the polymer film. Once this first effect has been taken into consideration, other factors can be taken into account, in order to explain the reason of the opposite trend shown by # and d in graphs 3.8 and 3.9. Both this observations can be explained in a very simple way when considering reaction schemes above reported. The implementation of the efficiency of scheme 2 trough the increase of the IN concentration allows a faster gelification of the precursor solution by a faster increase of the polymer mass. From this, a faster increase of the viscosity of the reacting system and a contemporaneous decrease of the diffusion of the molecular and nanoparticles species occur.
(In), % (AgNO3), % ΔV/V 0 15 0,008765 2 15 0,007274 5 15 0,008174 10 15 0,003534 15 15 0,000393 20 15 0,001625 25 15 0,000264 2 10 0,003758 5 10 0,006452 20 10 0,002352
20 20 0,01085
Tab. 3.2 volume fraction of metal nano- particles into the TEM investigated PDMNP films
All the observed features can than be explained by hypothesizing that metal nanoparticle and gradual evolution are controlled by two factors: the nucleation and successive growth by merging of the diffusing nucleated metal particles. Thus the faster monomer polymerization, due to an improved efficiency of scheme reactive 2, depresses nanoparticle diffusion, that is to say the nanoparticle growth mechanism, in such a way that the number of particles remains bigger and the volume of each nanoparticle remains smaller.
The above consideration indicates that the photo-synthesis approach followed in this thesis work introduces at least two control factors to regulate the size and density of nanoparticles: the concentration of metal cation and the concentration of a second photo-polymerization initiator. It must be underlined that the presence of the independent initiator represents not only a mean to create particular conditions to better investigate the system but is a very important factor with respect to the future eventual technology applications of this type on PDMNP system. It must be considered that in the absence of Irgacure the photo-polymerization process which leads to the solid plastic film formation does not occurs at low concentration of silver nitrate . The minimum silver nitrate concentration required to polymerize the system in reasonable time is 15%. On the other hand, we will se in the following, when the electric and optical properties of the films are taken into consideration, that lower concentration of silver nitrate consent to obtain more transparent films. One important factor that must be also taken into consideration is that when increasing the silver nitrate concentration into the precursor solution , crystallization of the the salt reaming non reacted occurs into the polymer matrix, since the solubility of silver nitrate is lower in PAN with respect to the starting monomer. The consequence on the optical transparency of the PDMNP film is dramatic, due to the strong scattering introduced by the precipitation of silver nitrate micro-crystals.
Diffusion becomes an important factor to graduate the morphology of the system and than temperature should play also a very important role by affecting both chemical kinetics and translational diffusion. The further investigation of the temperature influence was at the moment behind the aim of this work.
3.4 The electrical conductivity of the PDMNP films.
Three type of electric conductivity mechanisms become possible in the type of PDMNP films taken into consideration in this thesis:
-ion conductivity due to the excess ions remaining dispersed into the polymer matrix; -electronic conductivity in metal nanoparticles network structure;
-tunneling conductivity.
After we have made a rough analysis of the resistivity of the film, as we will justify later, we could conclude that ionic conductivity can be ignored at very low frequency being the PAN polymer matrix quite rigid. So at low frequency we assumed that the major conductivity contribute could be considered as due to the electron transport. For sake of clarity we will briefly give in the following some useful information on the electron transport in the system of our interest. We will take into consideration the conduction going trough nanoparticle networks, and trough tunneling.
When highly conductive fillers such as metal nanoparticles or carbon black is mixed with a polymer matrix, at certain level of the fillers volume fraction, a three-dimensional conducting network can develop into the matrix and a steep jump of the electron conductivity of the system occurs. This phenomena is known as percolation. The volume fraction at which the electric conductivity is characterized by a variation of several orders of magnitudes is called percolation threshold. Effort to systematically quantify the conductive properties of mixtures made from conductive and insulating materials could be traced back to the 1950s and 1960s. Since then, a considerable number of models have been introduced to explain the conductivity of different material systems.
Percolation in composite system
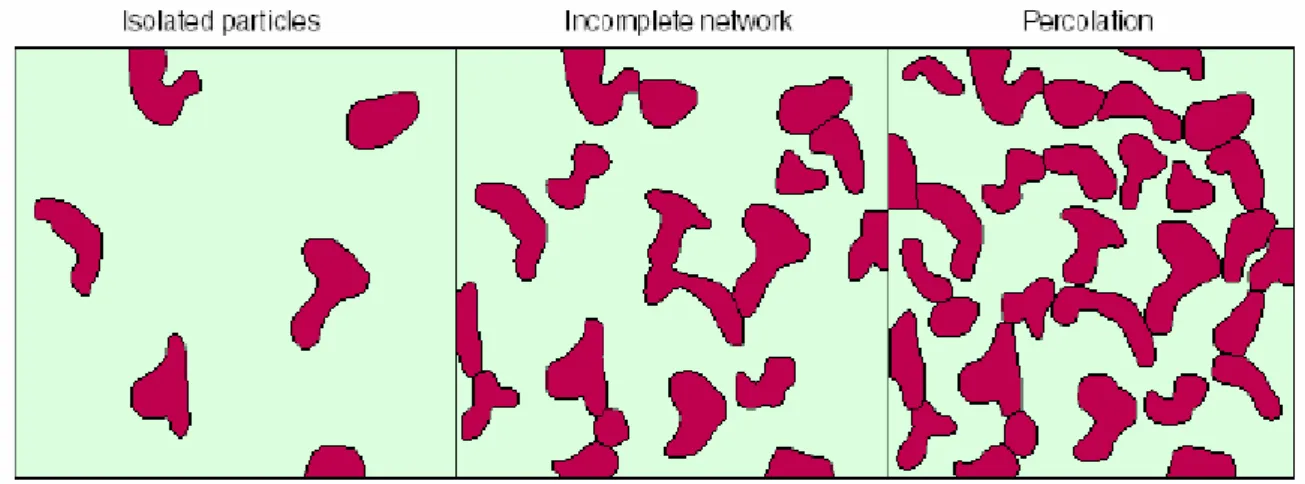
The relevance of the percolation phenomenon to the conductivity of polymer dispersed metal nanoparticles[2] can be visualized in the following simple scenario as shown in Fig. 3.11. With very low concentration of fillers, the conductive nanoparticles behave in the matrix as isolated particles or clusters, and the conductive particle-filled polymer is either insulated or barely conductive. As more particles are added to the matrix, the isolated clusters grow and would eventually “percolate”, i.e., form a connected network spanning the entire sample matrix, transforming the polymer from insulating to conductive. The filler concentration at this point, where the polymer experiences a drastic jump in conductivity, is termed percolation concentration or critical concentration. At the filler concentration which is higher than the percolation value, the connected network of
conductive particles becomes denser, thus continuing to raise the polymer conductivity at an increasingly slower rate.
Fig. 3.11Percolation networks
The percolation theory provided the foundation for some of the earliest electrical conductivity models, and it is still highly influential today as an effective tool to investigate conductive properties of particle-filled Electrical Conductive Polymers (ECP).
Percolation theories are frequently applied to describe the insulator-to-conductor transitions in composites made of a conductive filler and an insulating matrix and hve found deep application in the study of nanotube composites[3]. It has been shown both experimentally and theoretically that the percolation threshold strongly depends on the aspect ratio (length-to-diameter) of the filler particles. Depending on the polymer matrix and the processing technology as well as the type of nanotube material used, percolation thresholds between 0.05 wt% and 10wt% have been observed experimentally [4]. In the case of multi-wall carbon nanotubes, optical transparency is generally reduced or lost due to the formation of the conductive network, whereas single-wall nanotube composites can lead to conductive and transparent composites [5]. Most commercial antistatic, thermoplastic/carbon nanotube systems were based on entangled CVD-grown nanotube materials and require between 1.5 and 4.5 wt% tube loadings.
Close to the percolation threshold, the electrical conductivity follows a power-law of the form
be surprisingly uniform for systems of the same dimensionality. For three-dimensional percolating systems t varies between 1.6 and 2, in simulations [7,8]. The percolation maximum conductivity is limited by the contact resistance between neighbouring particles.
Electric Conduction by tunnelling
When the nanoparticle volume fraction, in the polymer film, is far below the critical threshold, electron conduction can occur only by tunneling of the electron trough the polymer isolating barrier. The jump of the between to adjacent nanoparticles separated by an insulator layer, in equilibrium can be represented by the scheme Metal-Insulator-Metal ( MIM) of fig 3.12.
Fig. 3.12 Diagram of MIM system in equilibrium. j1 and j2 – work function of the left and right metals, respectively
When a potential difference does exist between the two nanoparticles the diagram mast be drown as in fig. 3.13
Fig. 3.13. Model of MIM system with an arbitrary shape potential barrier. Positive potential is applied to the right metal nanoparticle
According chapter John G. Simmons Formula, the approximate expression for the tunneling current in the MIM system can be written as [9-11]:
(1)
where , , average is barrier height, δz is barrier width, V is the voltage between electrodes.
At low voltages eV>>φ, expression (1) can be simplified [9-11]
with
Since eV>>φ, we can consider that φ doesn't depend on V. Thus, in the case of small applied voltage, the tunneling current proportionate to V.
conductivity analysis of the silver PNMNP obtained in this thesis
A circuit analyzer Hewlett Packard precision LCR metter 4282A, working in the frequency range comprised in the interval between 20 Hz and 1MHz has been used to measure the electric characteristic of the cell described in fig 3.1. The cell has been considered equivalent to e resistor in parallel with a condenser. We will comment in the following the AC conductivity measured at different frequencies of the sample obtained in the full investigated chemical formulation range. The resistivity of the different composite PDMNP have been plotted in different way, to show in the most complete way the effect of the different component concentration on this fundamental parameter. The indication AxIy has been reported in the following graphs: there x defines the percentage of silver nitrate contained in pre precursor solution, while y indicates the percentage of Irgacure. Results obtained from system at fixed concentration of the Irgacure initiator and variable concentration of silver nitrate are shown first. In the following Fig. 3.14 the behavior of the system obtained without Irgacure photo-initiator is illustrated.
Fig. 3.14 Dependence of conductivity in PDMNP films obtained from precursor AN solutions do not containing Irgacure photoinitiator, and variable silver nitrate concentration ( from 15 to 25% )
The lower concentration of silver nitrate which allowed the polymerization of the film was 15%.
It becomes possible to obtain PDMNP films even in absence of silver nitrate , that is to say in absence of the reactive scheme 1 , when the concentration of Irgacure is raised up to
10% into the AN solution. The conductivities related to Irgacure concentrations equal to 10,20, 25% are reported in the next figures from 3.15 to 3.18.
Fig. 3.15Frequency dependence of conductivityty in PDMNP films obtained from precursor AN solutions containing 2% of Irgacure photoinitiator and variable concentration of silver nitrate ( from 10 to 25% )
Fig. 3.16 Frequency dependence of conductivity in PDMNP films obtained from precursor AN solutions containing 5% of Irgacure photoinitiator and variable concentration of silver nitrate( from 0 to 25% )
Fig. 3.17 Frequency dependence of conductivity in PDMNP films obtained from precursor AN solutions containing 10% of Irgacure photoinitiator and variable concentration of silver nitrate( from 0 to 25% )
Fig. 3.18 Frequency dependence of conductivity in PDMNP films obtained from precursor AN solutions containing 15% of Irgacure photoinitiator and variable concentration of silver nitrate( from 0 to 25% )
Fig. 3.19 Frequency dependence of conductivity in PDMNP films obtained from precursor AN solutions containing 20% of Irgacure photoinitiator and variable concentration of silver nitrate( from 0 to 25% )
Fig. 3.20 Frequency dependence of conductivity in PDMNP films obtained from precursor AN solutions containing 25% of Irgacure photoinitiator and variable concentration of silver nitrate( from 0 to 25% )
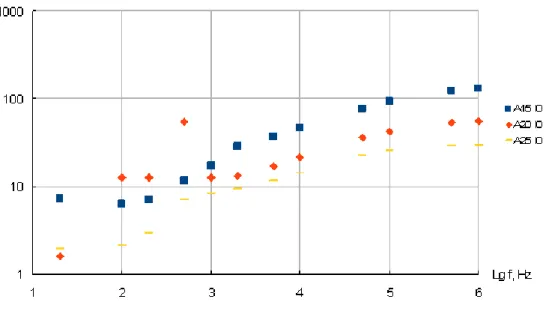
The plot of data for fixed concentration of Silver nitrate and variable Irgacure concentrations, will be shown in the following figures ( from fig 3.21 to fig.3.23 ), in order to better illustrate the role played by the Irgacure on the films electric conduction .
Fig. 3.21 Frequency dependence of resistivity in PDMNP films obtained from precursor AN solutions containing 10% of silver nitrate and variable concentration of Irgacure photoinitiator ( from 2 to 25% )
Fig. 3.22 Frequency dependence of resistivity in PDMNP films obtained from precursor AN solutions containing 15% of silver nitrate and variable concentration of Irgacure photoinitiator ( from 0 to 25% )
It is convenient for the discussion which will follow to report also a comparison between the conductivity measured into a fluid precursor solution and that measured into the corresponding solid film obtained after UV curing of the sample and transformation of AN into PAN. As an example we report in the next fig. 3.23 the comparison between the conductivity of fluid and corresponding solid film from a sample containing 15 % of silver nitrate and not containing Irgacure initiator.
Fig. 3.23 Comparison of frequency dependence conductivities of a liquid solution of 15% silver nitrate in AN and with conductivities measured from the corresponding PDMNP films obtained by UV curing the AN solvent
Here the conductivity of the fluid solution of the precursor solution at low frequency is almost two order of magnitude lower than that of the corresponding solid film . With increasing of the frequency, the conductivity of the liquid and solid films become equal around 1 KHz. For higher frequencies the conductivity of the solid films increases more than that of the liquid one.
Considering that :
1. at low frequency the conductivity of the solid film is higher than that of the fluid one of almost two order of magnitude;
2. in the fluid solution there are not metal nanoparticle and than the electric conduction must be of ionic type;
3. in the solid film the contribute to conduction by ions must be lower than measured in the corresponding liquid solution ( precursor solution ) due to the reduced mobility of the ions into the solid matrix, with respect to the liquid environment;
we can conclude that at low frequency ( say 20 Hz ) in the solid film the conduction due to the ions with can be neglected with respect to that due to electron transport through the metal nanoparticles. This hypothesis could not be valid in the case of the very low conducting solid film, but we assume for the moment the general validity of this idea. This means that in the following we will attribute the low frequency ( 20Hz) ac conductivity to the electron conductivity getting rid of the difficulties of having two possible charge transporter ( ion and electrons).
A second comment, to the data above reported, regards the role of Irgacure. It is evident from fig 3.21 and fig 3.22 that when increasing the concentration of Irgacure into the precursor solution the conductivity of the PDMNP films becomes lower. This observation can be rationalized when taking into account the results obtained by studying the film morphology. As we have stated above the increasing of the Irgacure speeds up the polymerization process and brings to the formation of smaller nanoparticles. It is true that the density of the nanoparticles increases, but evidently the growing of the nanoparticle number dos not compensate the decreasing of nanoparticle sizes, when the conduction mechanism are taken into consideration. As we have seen in Chapter II the conductivity of dispersed conductive nanoparticle in an insulating polymers has been linked, by several models, to the volume fraction of the conductive nanoparticles. Starting from this consideration we have investigated the correlation between the nanoparticle volume fractions ( see Tab 3.2 ) and the conductivities of films reported in tab.3.3.
(In), % (AgNO3), % σ, µSmcm-1
0 15 7,194
2 15 0,281
5 15 0,386
15 15 0,064 20 15 0,278 25 15 0,084 2 10 1,066 5 10 0,352 20 10 0,027 20 20 0,167
Tab. 3.3 experimental low frequency AC conductivity of the TEM investigated PDMNP films.
We have used volume fractions reported in tab. 3.2 to calculate according to EMT equations ( see chapter II ). The conductivity calculated for different models according to the following equations:
being the conductivity of the silver nanoparticles and k the silver volume fraction, are reported in the following fig. 3.25, together with the experimental data reported in tab. 3.3
1,00E-02 1,00E+00 1,00E+02 1,00E+04 1,00E+06 1,00E+08 1,00E+10 0 0,005 0,01 0,015 0,02 ΔVAg/V0 σeff, µSmcm-1 Maxwell-Garnett Bruggeman Sheng Landau–Lifshitz/Looyenga Monecke experiment
Fig.3.24 Comparison between calculated and experimental conductivity as a function of the volume fraction of metallic silver
The theoretical calculations reported into fig. 3.24 have been performed by assuming a value of the conductivity of silver nanoparticles equal to the conductivity of the bulk silver ( Ag Smcm-1
As it is possible to see in fig 3.24, when inserting into the model equations above reported a value of nanoparticle conductivity equal to the conductivity of the bulk silver , the theoretical conductivities of the PDMNP films, estimated by the EMT equations, are much higher with respect to the experimental values. The calculated conductivities more close to the experimental values are those of the LLL Effective Medium Model, but they have a discrepancy bigger of two order of degrees with respect to the experimental values. An interesting feature of the experimental data is the fact that the data distribute on almost to parallel curves, which are both parallel to the calculated curves. In other words, the slope of the experimental data with respect to volume fraction of the metal seems to be correct, but some explanation for discrepancy among theoretical and experimental data , as well as for the oscillation of the experimental data
between to limiting curves, need to found. A possible hypothesis which of course would need to be confirmed is that the conductivity of nanoparticle can be much lower with
respect to the conductivity of the bulk metal, The theoretical curves calculated by the LLL model would match the experimental data if one would assume a conductivity of the nanoparticle material two order of magnitude lower with respect to that of silver bulk conductivity . This lower value of the silver nanoparticle intrinsic electric conduction with respect to the silver bulk conduction might be due to the presence of random offset charges [13 ].
3.5 Optical properties.
Composites materials, consisting of polymers with embedded nanostructured metallic particles exhibit generally unique optical characteristics originating from the strong interaction between incident light and metallic nanoparticles. This interaction results in collective oscillations of electron clouds, so called surface plasmons, at the interface of the metallic nanoparticles and the dielectric matrix. The resonance frequency of this interaction is strongly dependent on the metal, the surrounding dielectric medium, as well as the size and shape distribution of the nanoparticles.
With increasing metal loading, initially isolated metallic nanoparticles start to coalesce, leading to the formation of nanoclusters with irregular shapes and a broader size distribution. Such fractal structures can greatly extend the light absorption from the ultraviolet and visible wavelength region into the infrared wavelength region [14]. The tunability of the optical properties of these metal–dielectric composites makes them suitable for a variety of applications including surface-enhanced Raman scattering sensors [15], color filters [16–18], and
all optical switching [19]. The surface plasmons can lead to intense electromagnetic fields in
the dielectric between metallic nanoparticles. This effect has been applied in photovoltaic cells [20,21] and light-emitting diodes [22,23], enhancing the device efficiency due to strong coupling of the light to the interface (absorption or emission region, respectively). More recently, direct employment of metallic nanoparticles as photosensitizers was demonstrated [20,24]. It was shown that excited surface plasmons can eject electrons into a surrounding conductive medium
resulting in effective charge separation.
Recently significant progress in tailoring the optical properties of Ag/fluoro polymer nanocomposites by varying the concentration, and the size and shape distribution
of embedded silver nanoparticles in a poly[4,5-difluoro-2,2-bis(trifluoromethyl)-1,3-dioxoleco-
tetrafluoroethylene] matrix, have been presented [26] . At silver concentrations near the percolation threshold, silver nanoclusters with all sizes and shapes form. Such fractal networks resulted in an unusually large broadband visible to infrared absorption range (400 nm–2500 nm and above) [4], which is of particular interest for multi-spectral sensor applications. It has been also also demonstrated that the absorption profile of Ag/fluoropolymer composites can be tailored to closely match the solar radiation spectrum [16], indicating that these composites could have potential use as next-generation photovoltaic cells. Before this thesis work the synthesis of such nanocomposites typically involved the deposition of metallic nanoparticles into a dielectric matrix. The electrical properties of such composites are closely related to the morphology of the embedded metallic nanostructures, which are dependent upon both film thickness and metal concentration. Previous studies of electrical properties of metalfilled polymers focused on the effect of metal concentration in films with thicknesses in the micrometer or larger range.
Our investigation of the optical properties of the Silver/PAN PDMNP is motivated by two reason. From one side the naparticle composites could be used in applications were a high optical transparency is required. In this case one would like to see if the film preparation method used in this thesis allows to avoid plasmon resonances into the visible region. On the other and strong absorption in the visible region could be required in photovoltaic applications of the films.
The light-spectrum of spherical metal nanoparticles in dielectric media can be modeled by using the electromagnetic Mie theory[27], which gives a complete analytical solution of Maxwell's equations for the scattering of electromagnetic radiation by spherical particles. This theory permits to calculate the extinction cross-section σext of an electromagnetic wave beam impinging on the particle. To this parameter contribute both the light absorbtion and scattering of particles. The extinction cross-section is in fact the sum of the absorption cross-section σabs and of the scattering cross-section σsca respectively:
scat abs ext
Once the extion cross section is known , the decrease of light intensity ΔI of a beam I0, travelling through a transparent media containing nanoparticles, can be obtained by Beer–Lambert–Bouguer law[28]: 0
(
1
#)
l exte
I
I
, (1)being l the optical layer thickness, # the density of absorbers ( density of the nanoparticles in the sample).
Optical density or OD is a unitless measure of the transmittance of an optical element for a given length at a given wavelength:
lg lg( ) 0 I I T OD , (2)
being T the transmittance; I the intensity of the transmitted light beam; I0 the intensity of the incident light beam.
Hence: e l OD ext lg # . (3)
From the point of view of model calculation, the extinction of the light wave in media containing metal nanoparticles depends on plasmon-resonance absorption of metal nanoparticles.
From Mie theory [27]:
2 (2 1)Re( ) 1 2 L L L ext L a b k , (4)
k is the wave vector, L is order of spherical multipole excitation in particle. For example
1
L correspond to dipole; L 2 correspond to quadrupole, etc.
aL, bL are the Mie coefficients express through the cylindrical Riccati-Bessel functions ψL
and ηL with arguments mx and x, (
polym er A g
mx is the optical metal to polymer dielectric
From [29]: ) ( ) ( ) ( ) ( ) ( ) ( x mx mx m x mx x mx m a L L L L L L L L L , (5) ) ( ) ( ) ( ) ( ) ( ) ( x mx m mx x mx m x mx b L L L L L L L L L . (6)
In order to show in a pictorial way the influence of the nanoparticle morphology ( diameter and density ) a theoretical calculated spectra of optical extinction silver nanoparticles in PMMA matrix[30], is shown ( fig. 3.25 ).
Fig. 3.25 Calculated spectra of optical extinction silver nanoparticles in PMMA matrix.
We know, that refractive index of PMMA (Polymethyl methacrylate) is 1.4893 and refractive index of PAN (Polyacrylonitrile) is 1.5187. So the theoretical results shown in fig.3.25, being valid for silver nanoparticles imbedded into PMMA, are very similar to those referring to silver nanopartcles dispersed in PAN. The relevant feature of the Extinction cross section shown in fig 3.25 is that a peak centered around 440 nanometers appears into the spectra. The eight of this peak depends on nanoparticle size.
The optical properties of the PDMNP films which are the object of this thesis have been measured by Jasco V550 UV/VIS spectrophotometer.
The transmittance data of the analyzed samples are reported in the following figures ( from fig. 3.25 to fig. 3.30 )
Fig. 3.25 Transmittance as a function of the wavelength of PDMNP films obtained from solutions containing variable concentration of Silver Nitrate ( From 15 to 25 %) The Irgacure concentration was 0%
Fig. 3.26 Transmittance as a function of the wavelength of PDMNP films obtained from solutions containing variable concentration of Silver Nitrate ( From 10 to 25 %) The Irgacure concentration was 2%
Fig. 3.26 Transmittance as a function of the wavelength of PDMNP films obtained from solutions containing variable concentration of Silver Nitrate ( From 0 to 25 %) The Irgacure concentration was 5%
Fig. 3.27 Transmittance as a function of the wavelength of PDMNP films obtained from solutions containing variable concentration of Silver Nitrate ( From 0 to 25 %) The Irgacure concentration was 10%
Fig. 3.28 Transmittance as a function of the wavelength of PDMNP films obtained from solutions containing variable concentration of Silver Nitrate ( From 2 to 25 %) The Irgacure concentration was 15%
Fig. 3.29 Transmittance as a function of the wavelength of PDMNP films obtained from solutions containing variable concentration of Silver Nitrate ( From 0 to 25 %) The Irgacure concentration was 20%
Fig. 3.30 Transmittance as a function of the wavelength of PDMNP films obtained from solutions containing variable concentration of Silver Nitrate ( From 0 to 25 %) The Irgacure concentration was 25%
The optical properties of Polymer Dispersed nano particles films are usually evaluated in terms of the extinction cross-section of the film σext.. For this reason the transmittance data shown above have been rearranged in terms of extion coefficients of films originated from precursor solutions containing different silver nitrate concentrations and Irgacure. These data are illustrated in the next figures ( from fig. 3.31 to fig. 3.32 )
Fig. 3.31 Extinction cross-section of PDMNP films PDMNP films obtained from AN solutions containing 10% of Silver Nitrate and variable concentration of Irgacure ( from 2 to 20% )
Fig.3.32 Extinction cross-section of PDMNP films PDMNP films obtained from AN solutions containing 15% of Silver Nitrate and variable concentration of Irgacure ( from 2 to 20% )
Fig. 3.33 Extinction cross-section of PDMNP films PDMNP films obtained from AN solutions containing 20 % of Silver Nitrate and variable concentration of Irgacure ( from 2 to 20% )
A simple inspection of the figures 3.31, 3.32 and 3.33 shows that for those PDMNP films where the nanoparticles diameter is bigger well definite spectral peak appears at around 440 nanometers thus confirming the literature predictions.
REFERENCES
[1] Z. Zhang and M. Han, J. Material Chem., 2003, 13, 641
[2] Stauffer, D. and A. Aharony, Introduction to percolation theory. Revised 2nd edition ed. 1994, London; New York: Taylor & Francis Group.1
[3] P. J. F. Harris, “Carbon nanotube composites”, International Materials Reviews, v 49, n 1, p 31-43 , (2004)
[4] J.W. Mintmire, C.T. White., “Electronic and structural properties of carbon nanotubes”, Carbon, n 33, p893-902, (1995)
[5] J. Sandler, M.S.P. Shaffer, T. Prasse, W. Bauhofe, K. Schult, A.H. Windle,
“Development of a dispersion process for carbon nanotubes in an epoxy matrix and the resulting electrical properties”, Polymer 40, p 5967-5971, (1999)
[6] R. Zallen; “The physics of amorphous solids”, John Wiley & Sons, New York (1983).
[7] D. Stauffer; “Introduction to percolation theory”, Taylor & Francis, London (1984). [8] F. Lux; “Models proposed to explain the electrical conductivity of mixtures made of conductive and insulating materials”, J. Mater. Sci. 28(2) (1993), 285–301.
[9] John G. Simmons. J. Appl. Phys. - 1963. - V. 34 1793. [10] John G. Simmons. J. Appl. Phys. - 1963. - V. 34 238.
[11] Dobretzov L.N., Gomounova M.V. Emission electronics. Nauka, 1966 (in Russian) [12] Chemical Encyclopedia. Silver.
[13] K.H. Muller, J. Herrmann, B. Raguse, G. Baxter, T. Reda, “Percolation model for electron conduction in films of metal nanoparticles linked by organic molecules “ Physical review B. Condensed matter and materials physics 2002, vol. 66, n 7 , pp.075417.1-075417.8
[14] V.M. Shalaev, Optical Properties of Nanostructured Random Media, Springer, Berlin, 2002.
[15] M.A. De Jesus, K.S. Giesfeldt, J.M. Oran, N.A. Abu-Hatab, N.V. Lavrik, M.J. Sepaniak,
Appl. Spectrosc. 59 (2005) 1501.
[16] A. Biswas, O.C. Aktas, U. Schurmann, U. Saeed, V. Zaporojtchenko, F. Faupel, T. Strunskus, Appl. Phys. Lett. 84 (2004) 2655.
[17] Y. Dirix, C. Bastiaansen, W. Caseri, P. Smith, Adv. Mater. 11 (1999) 223. [18] M. Quinten, Appl. Phys., B Lasers Opt. 73 (2001) 317.
[19] G.I. Stegeman, E.M. Wright, Opt. Quantum Electron. 22 (1990) 95.
Cells 61 (2000) 97.
[21] S. Pillai, K.R. Catchpole, T. Trupke, M.A. Green, J. Appl. Phys. 101 (2007) 093105. [22] W.L. Barnes, J. Lightwave Technol. 17 (1999) 2170.
[23] K.R. Catchpole, S. Pillai, J. Lumin. 121 (2006) 315. [24] Y. Tian, T. Tatsuma, J. Am. Chem. Soc. 127 (2005) 7632.
[25] H. Eilers, A. Biswas, T.D. Pounds, M.G. Norton, M. Elbahri, J. Mater. Res. 21 (2006) [26] Haoyan Wei, Hergen Eilers, Thin Solid Films 517 (2008) 575–581
[27] G. Mie. Ann. Phys. 1908. Vol. 25. P. 377-422.
[28] M. Born, E. Wolf Principles of Optics М.: Science, 1973.
[29] C. F. Bohren, D. R. Huffman: Absorption and scattering of light by small particles. New York, Wiley-Interscience, 1983.
[30] A. L. Stepanov, Optical properties of metal nanoparticles synthesized in a polymer by ion implantation. Technical Physics, vol. 49, issue 2, pp. 143-153