Chapter 3
Experimental
3.1 Introduction
At Cranfield University, a pilot study on the same subject of this work was recently (2002) conducted by Ms. Sophie Cozien Cazuc in her MSc Thesis1. In order to take advantage of her analysis and to have a control to compare the new results with, the same raw materials, compositions, filler weight percentages and hybrid processing parameters were used as preliminary starting point for the present study.
Nevertheless a GF reinforced nanocomposite laminate is a novel material, so the largest part of this work was experimental: the second section of this chapter will be dedicated to the evolution from this initial situation. In fact an investigational work was carried out to optimize the aforecited variables, namely to reach the final choices in terms of laminate manufacturing and to make all the decisions as regards hybrid composition and processing.
At the same time the system of name classification adopted for manufactured samples and specimens will be explained; besides lists of all of them will be provided.
In the first chapter section the material grades adopted, the pieces of equipment used and the procedure for samples preparation will be depicted.
Finally, in the last section, the testing methods for material characterization will be illustrated. As a first step, some physical and mechanical features of the PP-NC-PPgMA composite, such as crystallinity and storage modulus, will be evaluated and the assessed level of nanoclay dispersion achieved will be estimated by means of Optical and Scanning Electron Microscopy and, above all, by analysing X-Ray Diffraction patterns. Afterwards, tensile testing methods on laminates with a qualitative estimation of the adhesion between matrix and glass cloth will be discussed.
Section 1: Materials, equipment and sample
preparation
3.2 Raw Materials
3.2.1 Polypropylene
Two grades of PP were used: one in granule, the other in powder form.
Except for the first PP-GF mat laminates, which were prepared using the pellet form PP, all the laminates were made with a powder form PP.
3.2.1.1 Pellet form PP
Stamylan® P PHC22, a PP copolymer from DSM Petrochemicals and no longer commercialised, in pellet form was used. No information was given to know if and which additives it contains. Table 3.1 shows the information available about its properties.
Table 3.1: Stamylan® P PHC22 properties
Melt flow index (at 230° C and 21.6N) 4 dg/min
Density 906 kg/m3
Tensile stress at yield 26.5 MPa Tensile strength at break 28.5 MPa
Elongation at break 560% Flexural modulus 1200 MPa 3.2.1.2 Powder form PP
Propathene®, a powder form PP from ICI and no longer commercialized, was used. The grade code is GY621M (G: general purpose, Y: easy flow grade, M: intended for injection moulding applications, 621 identifies the grade as a polypropylene block copolymer).
It was impossible to collect more information about this material because it was bought some years ago from ICI, a company which changed name and ownership more than once in the meantime and which could not provide any more detail.
3.2.2 Nano-Clays (NC)
Three different silicates were studied in this work: two were supplied by Nanocor® (I.30P and C.30P) and one by Southern Clay Products® (Cloisite® 15A).
Nanocor® I.30P and Cloisite® 15A consist of organically modified nanometre scale, layered magnesium aluminium silicate platelets, whereas Nanocor® C.30P is a concentrate of the same mineral in a matrix which is a combination of PPgMA and standard polyolefin. All of them (pure powder nano-clay and
concentrate) belong to the family of surface modified montmorillonites. These are high purity aluminosilicate minerals (sometimes referred to as phyllosilicates) surface treated to make them suitable to be used as additives to hydrophilic polymers (see paragraph 2.4.2).
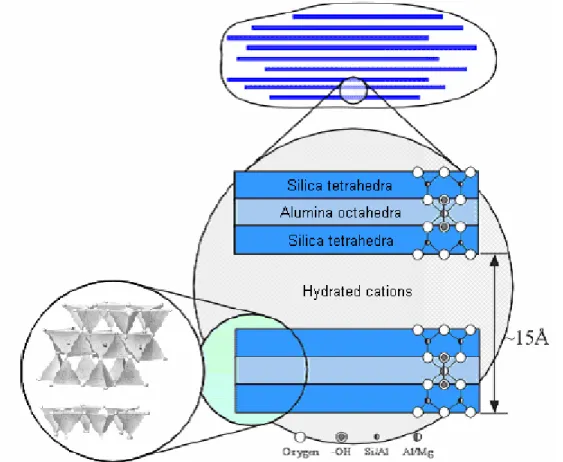
Montmorillonites have a sheet-type or platy structure. It exists as nanoscale particles which are agglomerated due to surface attraction of one particle to another. When the attractive force is minimized using surface treatment, each particle can disperse to its naturally occurring nanoscale size.
The theoretical formula and structure for montmorillonite are:
M
+y(Al
2-yMg
y)(Si
4) O
10(OH)
2*nH
2O
Figure 3.1: Layered silicate clay mineral representation from ref. 2
This exact formula is never seen in nature because central metal ions (Al3+ and Si4+) in the internal crystal lattice are commonly substituted by lower valence ions such as magnesium, iron, manganese and occasionally lithium. Substitution creates a charge imbalance on the flat surfaces of each platelet. The negative charge imbalance is neutralized by adsorption of hydratable cations, most notably sodium and calcium3.
Both Nanocor® and Southern Clay® use patented surface treatment technology. As Figure 3.2 illustrates, montmorillonite particles are agglomerated to within a distance of about 3.5Å. Surface treatment reduces particle-particle attraction, promoting an expansion of the distance to above 20Å. At this distance the particles can be separated further either by adsorbing monomer into the gallery
before polymerization or, in the case of high polymer, by employing shearing force using an extrusion compounder.
Figure 3.2 from ref. 4
Figure 3.3 depicts the case in which dispersion occurs in the compounding operation. When organo-clays are exfoliated in a resin matrix, the result is a proper nanocomposite4, otherwise it is more correct to speak about hybrid composite-nanocomposite.
Figure 3.3 from ref. 4
3.2.2.1 Nanocor® I.30P
Nanocor® I.30P is octadecylamine (C18H39N) treated montmorillonite, mineral
content being 70-75% on a weight basis. It is supplied in powder form. Table 3.2 shows its general physical properties5 (more information and health hazard data are available in Appendix I).
Table 3.2: Nanocor® I.30P properties
Colour Off-white Mean Dry Particle Size 16-20 µm
Specific Gravity 1.9
Bulk Density (gms/cc) 0.24-0.32 Moisture (% max.) 3.0 Mineral Purity (%) 98.5
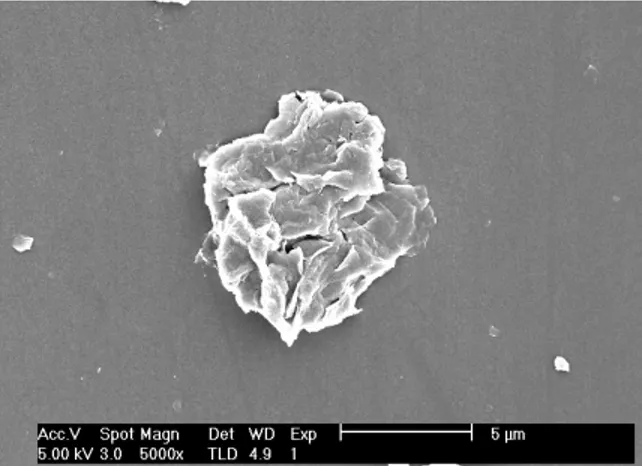
An illustrative scanning electron micrograph taken from a particle of the NC powder is showed in Figure 3.413.
Figure 3.4: Scanning electron micrograph of a Nanocor® I.30P particle
3.2.2.2 Nanocor® C.30P
C.30P is provided in pellet form. The de-agglomerated form makes it ready for PP letdown to make the NCP.
Table 3.3 shows general physical properties of C.30P6 (more information is available in Appendix I).
Table 3.3: Nanocor® C.30P properties
Colour Tan to brown
Bulk Density 38-42 lb./ft.3
Moisture (% max.) 0.2 Nanoclay Content (% wt/wt) 40-50
Besides Nanocor® Technical Centre supplied some more specific information about this concentrate sample (see Appendix II). Table 3.4 shows the results of their analysis.
Table 3.4: Nanocor® C.30P analysis results
Minimum Maximum Analysis
Nanomer®* loading (% wt) 50 D-spacing 22.8 Ǻ Moisture (% wt) 0.2 0.08 Length 2 mm 3 mm Pellet size Diameter 2 mm 3 mm 2-3 mm 3.2.2.3 Southern Clay® Cloisite® 15A
The silicate platelets of Cloisite® 15A (from now on C15A) are 1 nanometre thick and 70 – 150 nanometres across. C15A is surface modified with an organic chemistry (di-methyl, di-hydrogenated tallow, quaternary ammonium as a chloride salt) to allow complete dispersion and provide miscibility with the PP.
* Nanomer® is the patented Nanocor® name of montmorillonite minerals which surface have been treated with compatibilizing agents, thus Nanocor® I.30P is 100% Nanomer®.
Illustration above shows the structure of the cation used in surface modification of C15A, where HT is Hydrogenated Tallow (~65% C18; ~30% C16; ~5% C14). Table 3.5 summarizes some properties of C15A.
Table 3.5: Southern Clay® Cloisite® 15A properties from ref. 7
Colour Off-white D-spacing d001 =31.5Å
Loose Bulk Packed Bulk Specific Gravity Density
10.79 lbs/ft3 18.64 lbs/ft3 1.66 g/cc
Modifier
Concentration 125 meq/100g clay
Moisture (% max.) 2
Weight
Loss on Ignition 43%
10% less than: 50% less than: 90% less than: Typical Dry Particle Sizes
(by volume) 2µm 6µm 13µm
An illustrative scanning electron micrograph taken from a particle of the NC powder is showed in Figure 3.113.
Figure 3.5: Scanning electron micrograph of a Southern Clay® C15A particle
3.2.3 Glass Fibre Mat
The introduction of a woven GF mat in a NCP matrix is the real innovation presented in this work (Figure 3.6).
Figure 3.6: Schematic representation of the ‘sandwich’ structure of a laminate
Our purposes were to increase thermal stability and stiffness and to reduce creep effects of PP-clay nanocomposite, in other words to improve mechanical properties possibly without increasing too much the cost, leading to a final laminated with a potentially feasible production process.
GF mat seemed to be the correct answer being relatively cheap, easy to use and non-conductive. The electric aspect, in fact, of the laminate was taken into account as well.
The School of Electrical and Electronic Engineering of Queen’s University of Belfast was in charge of evaluating the electric behaviour of the manufactured samples, particularly their task was to examine if and in which way the presence of different grades of nano-filler, of GF mats and eventually processing parameters affected the dielectric constant and loss of the laminate.
Two different GF mat grades were used in this study: no detail is available about the first one except it is thicker than the second. In the very first step of the project, a group of pure PP-GF mat samples was prepared with both of them to check any difference in their electric behaviour. The results from Belfast University led us to choose the latter (named 120 FK600 from Interglas®) as reinforcement for all laminates in the remaining work.
A pre-preg, TwinTex® T PP, from Vetrotex® was used as well to evaluate the possibility of a faster production route. More details about these two products are described subsequently.
3.2.3.1 Interglas® 120 FK600
In its name, 120 specifies the weaving style and FK600 the seizing, an epoxy silane coupling agent.
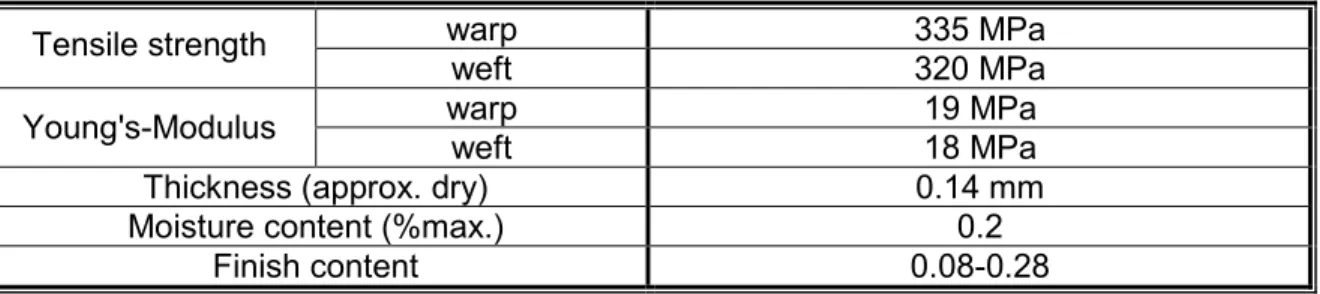
Table 3.6 shows the principal GF mat characteristics and an exhaustive technical data sheet is available in Appendix III.
Table 3.6:Interglas® 120 FK600 properties
warp 335 MPa Tensile strength weft 320 MPa warp 19 MPa Young's-Modulus weft 18 MPa
Thickness (approx. dry) 0.14 mm Moisture content (%max.) 0.2
Finish content 0.08-0.28 Glass fibre cloth Nanocomposite
It is worth noticing that this mat grade was not specially intended to reinforce PP composite; on the contrary, the epoxy silane seizing is specifically used as coupling agent with epoxy resin matrices. In fact some samples of Interglas® 120 were kindly placed at our disposal by the Composite Laboratory of Cranfield University which usually works with thermosetting systems. Nevertheless it was adopted, because it exhibits all the necessary features in terms of thickness and homogeneity of weaving style.
Besides the epoxy silane, the mat has a 2% in weight of organic material, mainly starch, oil and polyvinyl alcohol, which is applied to the yarn by the manufacturer to hold the filaments together to make a coherent thread. In order to evaluate the seizing influence on the adhesion between the mat and the NCP, Interglas® 120 was used both as it is and burnt. The burning process was suggested by Interglas® and it was intended to remove the epoxy silane and the organic binders. In the heat cleaning process, adopted by Interglas® Laboratories, the rolls of loom state fabric are heated over a period of 29 hours to 360°C then held at this temperature for a further 43 hours, a total of 72 hours. Using this cycle, it is possible to heat-clean a roll which might be 500 to 1000 m long, depending on the weight/m2, completely through its entire length.
The need for a slow rise in temperature is to allow the heat which is generated by oxidation of the organic material to dissipate from the centre of the roll, thereby preventing a runaway reaction leading to an exothermic effect in the centre. In my case, heat-cleaning small sized pieces of cloth (about 25 cm x 25 cm), the temperature could be raised immediately to 360°C expecting the fabric to be clean after 24 to 36 hours. The removal of seizing can be checked by measuring the weight loss after heating a sample at 625°C for 15 minutes. If below 0.05%, the fabric is clean. To prevent the moisture regain which commonly lasts for several minutes after removal from the furnace, cooling in a desiccator is recommended.
The heat-cleaning process could lead to weakening of the glass cloth (more when burning off a silane than when heat cleaning the loom state fabric) and, actually, the deteriorating effect which was observed made the heat-cleaned GF mat not suitable to be compression moulded any longer, as thoroughly explained in paragraph 3.5.3.
After this unsuccessful trial, being unable to eliminate the coupling agent without affecting the fabric integrity, an attempt in processing the untreated cloth with a water emulsion of PPgMA (Permanol® 602 from Clariant®, described in paragraph 3.2.4) was made. The goal was to create a link between the fibre reinforcement and the thermoplastic matrix with a material suitable for PP and fluid enough to completely soak the cloth flowing through the fibres.
The results and the behaviour of emulsion soaked GF cloth will be widely explained in paragraph 3.5.4.
3.2.3.2 Vetrotex® TwinTex® T PP
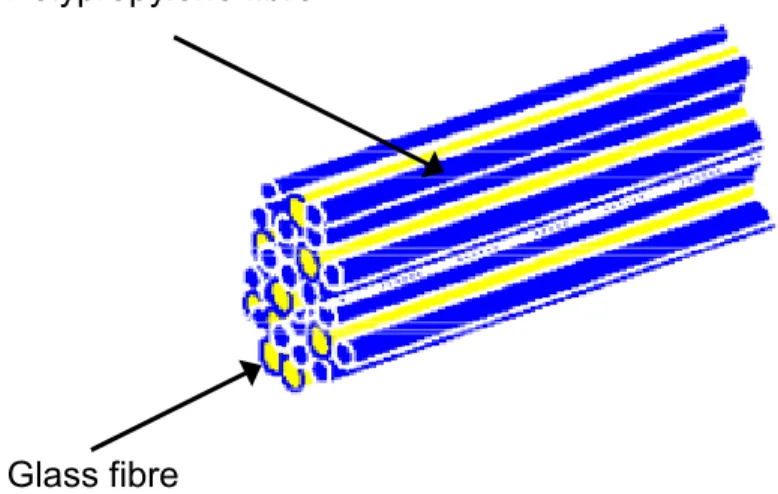
Vetrotex® is a Saint Gobain® company and TwinTex® T PP is a fabric woven with commingled E-glass and polypropylene rovings suitable for compression moulding.
Utilizing commingling technique yarns consisting of both glass and PP filaments can be produced, as Figure 3.78 illustrates.
Figure 3.7: Filaments of both glass and polymer in yarns before commingling
Vetrotex® uses a patented production process (represented in Figure 3.8) leading, through controlled heating, pressuring and cooling, to a yarn in which glass fibres are completely covered with thermoplastic matrix. It is very difficult to achieve the same results in terms of wetting out starting from a pure GF woven mat unless recurring to special methods as the mentioned emulsion soaking of the cloth, described hereafter in this work.
Figure 3.8: Schematic of commingling process from ref. 9
More details about TwinTex® are available in the Technical Data Sheet in Appendix IV.
3.2.4 Compatibilizer
As already said in paragraph 2.4.5, although the clay was already surface treated, the compatibilizer was in any case required to improve the interfacial adhesion between the organophilic silicate and the PP matrix, the problem being
Glass fibre
the incompatibility between the nano-clay with strongly electro-negative atoms (mainly oxygen), which are polar sites in its molecular structure, and the polymer, completely apolar.
Nevertheless, in this work, PPgMA has a double task because glass is a polar material too; then it needs to be linked someway to the poliolefinic matrix.
Therefore this coupling agent promotes the dispersion of NC in the bulk of the matrix and avoids debonding at the interface connecting NCP and glass. Among the several commercially available products, PolyBond® 3200 from Clariant® was chosen. Being in pellet form, it was easily dispersible into the matrix by melt blending with PP and NC.
On the contrary, reaching the glass surface was not equally simple: the high viscosity of the polymer hinders flow through the mat and, since the compatibilizer is carried by the melt PP, if the polymer does not wet out the fibres, PPgMA is ineffective. For this reason the impregnation of the glass mat with an emulsion of compatibilizer before laminating was tried.
Water emulsion is more ‘runny’ and can reach even the centre of fibres bundles providing a higher concentration of functional groups exactly where they should be. Even if it was possible to prepare the dispersion with PPgMA with a low amount of emulsifier in our own laboratory, the use of the commercially available one (Permanol® 602 from Clariant®) was preferred in order to guarantee the repeatability of tests.
3.2.4.1 Crompton® PolyBond® 3200
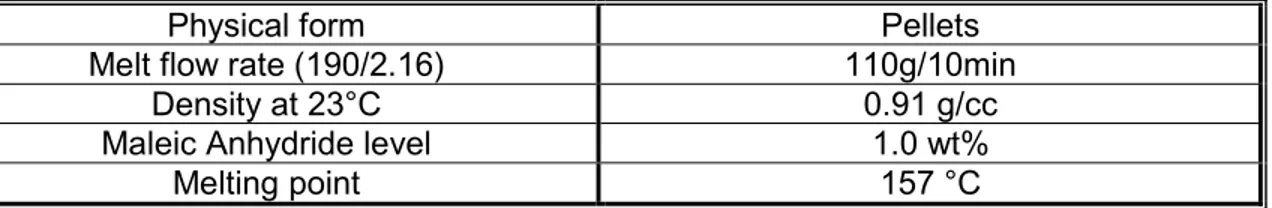
PolyBond® 3200 is a maleic anhydride modified homopolymer PP recommended for coupling of glass and other fillers in PP composites. Its high level of functionality (1.0 wt% MA) allows for low addition levels. Table 3.7 summarizes some PolyBond® physical properties although more details are available in Appendix V.
Table 3.7: Crompton® PolyBond® 3200 properties
Physical form Pellets Melt flow rate (190/2.16) 110g/10min
Density at 23°C 0.91 g/cc Maleic Anhydride level 1.0 wt%
Melting point 157 °C
Loading levels were kept at 2% and 5% on a weight basis in laminates, even if, in order to evaluate the influence of compatibilizer content on crystallinity, some samples without GF reinforcement were prepared with 5%, 10%, 15%, 20% and 25% of PolyBond®.
For comparison, compatibilizer-free systems were also investigated. 3.2.4.2 Clariant® Permanol® 602
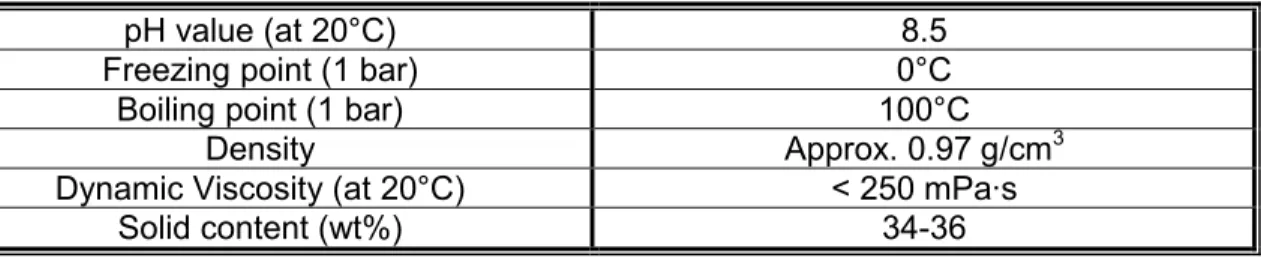
Permanol® 602 is a modified PP wax emulsion, in other words is the same chemical product as the compatibilizer but in a liquid state. Clariant® supplies a wide range of product with different pH, solid content and ionic character. Among these 602 grade was chosen for its non-ionic character because it is unknown if and what remains on the cloth after the emulsion treatment and then is not
possible to predict if and in which way the presence of anions or cations onto the glass surface could affect the bonding with the NCP matrix. Permanol® general features are listed in Table 3.8 and other details (about hazard as well) are available in Appendix VI.
Table 3.8: Clariant® Permanol® 602 properties
pH value (at 20°C) 8.5 Freezing point (1 bar) 0°C Boiling point (1 bar) 100°C
Density Approx. 0.97 g/cm3
Dynamic Viscosity (at 20°C) < 250 mPa·s Solid content (wt%) 34-36
3.3 Equipment and Processing
3.3.1 Hybrid preparation
To have enough material to manufacture a plaque of NCP, 180 g of PP was chosen to be the used mass, the weight of clay (or concentrate) and compatibilizer being added to obtain the desired weight-percentage of filler and coupling agent. All the weight measurements were performed with the same balance having an accuracy of a tenth of gram.
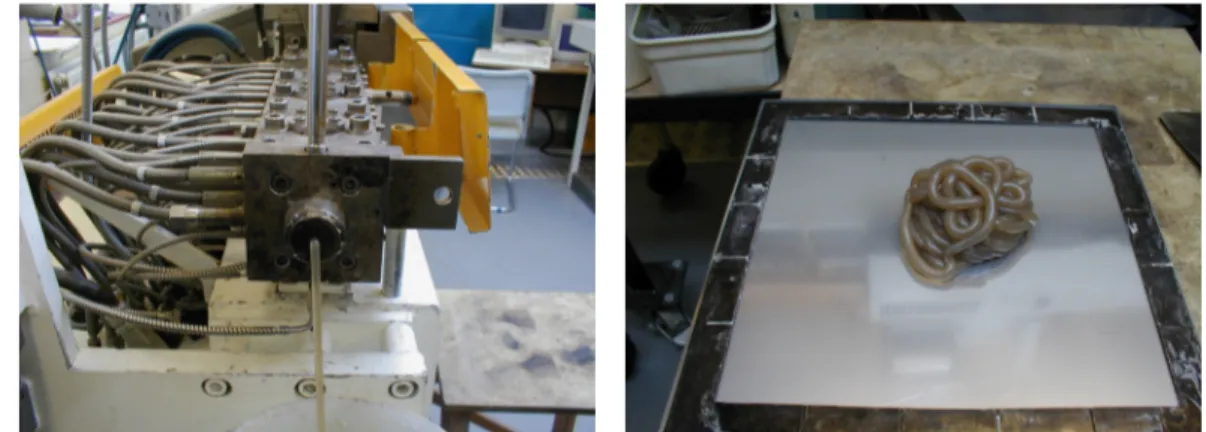
After weighing, PP, organo-clay and compatibilizer were dry premixed in a plastic bag for a couple of minutes before feeding such mixture to a double screw extruder (HPF 19 Laboratory Extruder from APV Baker Limited, Figure 3.9) where it was melt blended. The feeding rate was set and controlled by means of a K-Tron volumetric feeder.
Figure 3.9: Twin screw extruder
A glass of pure PP was used to clean the extruder channels and mixing elements before each operation. Extruder screw dimensions and configuration are available in Appendix VII.
In order to optimize the compounding parameters, temperature was varied from a preliminary flat profile at 220°C all over the screw to an arrangement in which the extruding path was divided into four zones in which temperature was set at 160, 165, 170 and 170°C, as exhaustively explained in paragraph 3.4.3. Apart from the very first trials, in which the RPM was 250, the screw rotation speed was kept to 500 rounds per minute. Extruded material (Figure 3.10), still melted, was collected upon a 30 cm square chromium-plated metal plate (Figure 3.10) with a thickness of 3 mm. This plate was fitted with the appropriate frame and a second plate was placed on the molten extrudate to be eventually placed between the hot press platens and moulded in a tile-like shape.
Figure 3.10: Extruded polymer Figure 3.11: Polymer collected on the plate
leaving the die
According to the intended use of such tile the frame thickness was chosen: 1.5 mm for the tiles to be studied without any
further processing and 0.75 mm for the tiles to be coupled in a laminate.
The hot press shown in the side picture is a hydraulic device controlled by an electric panel, able to apply pressure up to 40 tons/5”dia. and temperature up to about 350°C by means of electrical resistances. In this case the set temperature was varied from 180°C to 220°C, according to the experimental needs. Supplied by George E. Moore & Sons, Birmingham, the press is fitted with a water cooling system. Depending on the desired product, the cooling speed was chosen; two different rates can be roughly distinguished: a slow one of about 16 hours (one afternoon and one night) obtained through natural cooling of platens up to room temperature, and a fast one of about 30-60 minutes obtained by water cooling.
For all the manufactured laminates and NCP tiles, the moulding pressure was always 20 tons on a circular area of 5” diameter (corresponding to 15.5 MPa).
The two chromium-plated surfaces were treated with water based release agent: Frekote® Aqualine™ C-200 from Loctite® (see Appendix VIII). Before each moulding the plates were scraped with a razor to remove the polymer residue of the previous process and then mirror polished with steel wool. After 10 minutes drying in oven at 100-110°C they were sprayed with the release agent, then let oven dry for 15 minutes before applying the second coat which was let cure for other 15 minutes still in the oven.
The whole process was not fast and different release agents with quicker mould preparation could have been chosen (i.e. silicone or non-silicone release agents without drying or curing time), nevertheless Aqualine™ C-200 guarantees no contaminating transfer because it chemically bonds to the mould surface and the surface cleanness is a basic requirement in manufacturing plates which have to be coupled between them.
3.3.2 Laminates manufacturing
Laminate manufacturing has been achieved simply coupling two thin tiles with glass reinforcement between them and hot pressing such ‘sandwich’.
The first trials target was basically a suitable way to achieve either a homogeneous mat placement through the matrix and the requested laminate thickness (1.5 mm), as widely explained in paragraph 3.5.2.
Particular attention was paid in applying pressure in the hot press during laminate manufacturing: the operation had to be performed over a period of 5-10 minutes in order to prevent the GF mat from being torn by the shear stress yielded by the melt polymer flow.
3.3.2.1 Burnt glass fabric laminate
Following the instruction given by the supplier, in order to heat clean the GF mats, they were kept in furnace at about 360°C for 36 hours. After burning, the clothes were cooled down in a desiccator.
3.3.2.2 Emulsion treated glass fabric laminate
Even if Permanol® 602 is miscible with water in all proportions, it was utilized pure. Concerning the amount of wax emulsion to be used, the supplier suggested 1.0-3.0% on the total amount of filler; nevertheless this percentage is intended for particle shaped fillers (i.e. chopped glass fibres) and not for continuous ones. So it was decided to completely dip the cloth in the emulsion in order to allow the fabric to be soaked and to achieve a perfect coating after the treatment.
The bath was kept at 50°C for 30 minutes and then at room temperature for 19 hours. Drying in an oven at 110°C for 7 hours before laminating was required.
Section 2: Experimental procedure for sample
preparation
3.4 Matrix preparation
3.4.1 Nomenclature
All percentages mentioned from now on will be on a weight basis. The codes for plaques names will be XXnc.YYpb.ZZ, with XX as organo-clay percentage, nc as organo-clay grade (‘i’ for Nanocor® I.30P, ‘c’ for C.30P and ‘sc’ for Cloisite® 15A), YY as PolyBond® 3200 percentage and ZZ as a serial number to distinguish samples with the same composition. A neat PP control plaque was also made and it will be named pPP. All the manufactured plaques were 1.5 mm thick.
3.4.2 Powder PP vs. Pellet PP
In the early work of S. Cozien Cazuc1, NCPs made with granule form PP and, among other NC grades, I.30P (at 7.4%) and C.30P (at 13.8 %) were studied. In that work coupling agents were not used. The compounding and hot pressing parameters chosen were:
• Tc 220°C
• Screw speed 250 rpm
• Tp 220°C
• Pp 20 t/5” dia.
Where ‘T’ is for temperature, ‘P’ for pressure and subscripts are ‘p’ for pressing and ‘c’ for compounding variables.
It has to be noticed that the appearance of the NCP plaques manufactured by Cozien Cazuc was very inhomogeneous in colour and uneven in terms of surface finish: indeed it was possible to distinguish even at naked eye richer and poorer filler areas in the plaque. This was related to a not effective enough component mixing.
As a first step, then, in order to enhance the component mixing already in the dry state, PP in powder form was used instead of in granules as in the previous work of Cozien Cazuc. Filler loading, compounding and pressing parameters used are the same as above and they are shown in Table 3.9.
Table 3.9
Compounding Hot Pressing
Name
Tc (°C) rpm Tp (°C) Pp (t/5” dia.) Cooling time
13.8c.00pb.01 220 250 220 20 60’ 7.4i.00pb.01 220 250 220 20 60’
Actually using the new PP grade, the appearance of the produced material was already strongly improved, the plaques resulting of a homogeneous colour and with an even surface finish. For this reason, powder form PP was then adopted as the base material.
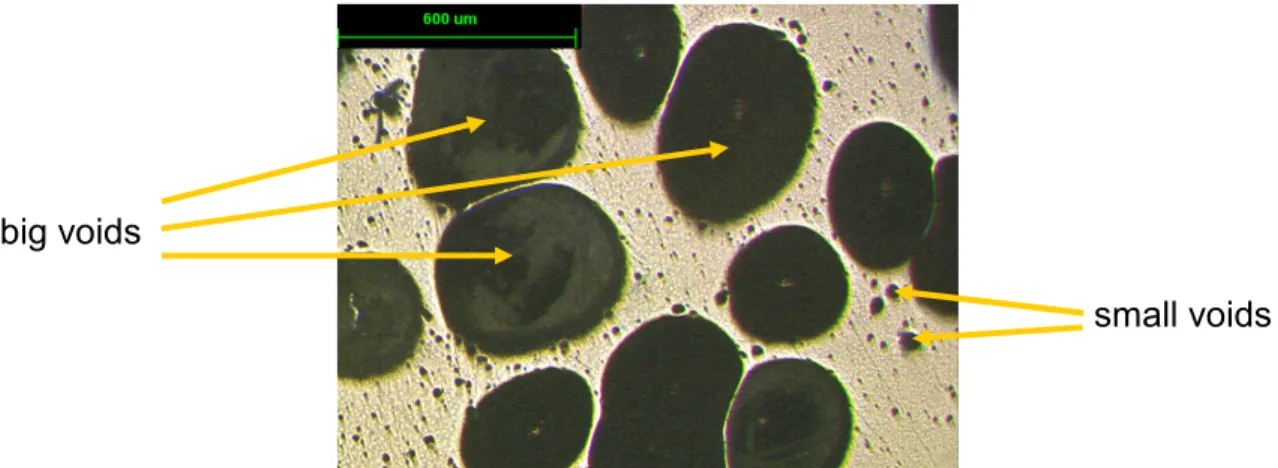
On the other hand, during the extrusion operation, the melt of both plaques mixtures leaving the compounder was noticed to have a ‘foamy’ appearance, indeed it was full of little bubbles, maybe originating from moisture entrapped in one of the raw materials used (PP and NC).
big voids
small voids
In order to investigate on the possible causes of this behaviour, some optical micrographs were taken from the extrudate samples. Figure above is one of these micrographs: some big voids (responsible of that ‘foamy’ appearance) are clearly detectable, but some smaller ones are noticeable as well.
However, when pure PP was extruded, the bigger bubbles (which were visible at naked eye, being their dimensions in the order of a few mm) were no more noticeable, thus it was considered that at least the bigger voids could have been related to the NC presence. A trial to eliminate this problem is described in paragraph 3.4.4. Besides, other speculations about this characteristic feature have been reported in paragraph 4.4.
Figure 3.12: 13.8c.00pb.01 Figure 3.13: 7.4i.00pb.01 Optical micrograph of 7.41i.00pb.01 extrudate
Other micrographs were taken from the two plaques mentioned above (Figures 3.12 and 3.13). They show the poor dispersion level achieved by NC, although surface treated, without a compatibilizer.
Bubbles and voids were still present evenly throughout the tiles, even though the compression moulding managed to reduce significantly their size. Besides, the plaque surface was rough, although with a homogeneous colour.
3.4.3 Compounding progress
In order to improve even more the mixing of matrix and filler, after having adopted a different PP grade, in comparison with the Cozien Cazuc work, also the compounding parameters were changed from those showed in Table 3.9. According to Nanocor® guidelines10, in fact, the extruder temperature should vary from 160°C in the hopper to 170°C in the die instead of being 220°C along the whole screw. Besides the recommended screw speed should be 500 rpm instead of 250.
The tiles made with these new compounding variables are listed in Table 3.10. Press temperature was lowered to 200°C to avoid PP degradation, as in laminate manufacturing the plaques have to be processed once more after tile-shaping. One sample was left to cool down ‘naturally’ over night.
Table 3.10
Compounding Hot Pressing
Name
Tc (°C) rpm Tp (°C) Pp (t/5” dia.) Cooling time
13.8c.00pb.02 160, 165, 170, 170 500 200 20 16 hrs 7.4i.00pb.02 160, 165, 170, 170 500 200 20 60’ New plaques looked better than the early ones as Figures 3.14 and 3.15 show. Although there were still NC aggregates, comparing Figures 3.14 and 3.15 to Figures 3.12 and 3.13, clearly resulted that the change in parameters affected NC dispersion. This is due to the higher shear stress achieved in the extruder for the highest speed rate and the lowest temperature (which means highest viscosity).
As expected, the better behaviour of concentrated NC in contrast with the powder is already evident. Notwithstanding NC concentrated was not used for further laminates manufacturing. In fact, at this point of the work, a sample of Cloisite® 15A was donated by the Italian Aerospace Research Center (C.I.R.A., Capua, Italy) so, in order to make a direct comparison between laminates with a NC coherent grade (i.e. powder form), only I.30P and C15A were used for further work.
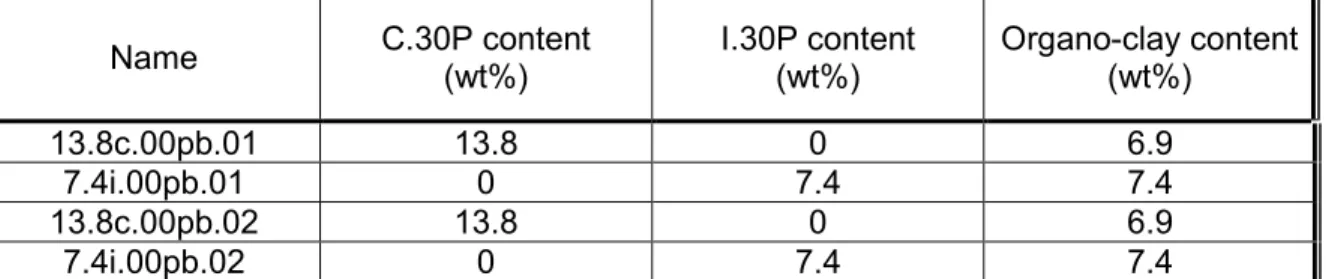
Table 3.1 shows the amount of organo-clay present in the samples manufactured so far. The calculation comes from what stated in paragraph 3.2.2 about filler composition.
Table 3.11
Name C.30P content (wt%) I.30P content (wt%) Organo-clay content (wt%)
13.8c.00pb.01 13.8 0 6.9
7.4i.00pb.01 0 7.4 7.4
13.8c.00pb.02 13.8 0 6.9
7.4i.00pb.02 0 7.4 7.4
After these first trials, from now on, the recommended loading level5, namely 5%
of both powder form organo-clay at our disposal (Nanocor® and Southern Clay® products), was always used.
3.4.4 Optimization of compatibilizer content
Once the PP grade, the compounding parameters and NC loading level were fixed, the next step was to decide the amount of maleated PP to be used. According to the literature11,12, the higher the PPgMA loading level the better the mechanical NCP performance. For this reason 20% of PolyBond® was used in 5i.20pb.03, but the result was a brittle plaque, full of bubbles, even difficult to remove from the mould.
Actually the high PolyBond® functionality allows lower loading level, so it was kept at 2 and 5%.
At this point, an attempt in drying both grades of NC in oven at 80°C for 72 hours before compounding was made in order to remove the possible cause of ‘foaming’ in the melt. Here is the list of the samples manufactured.
Table 3.12
Name Drying NC Drying PPgMA Cooling time Bubbles
5i.20pb.03 no no 16 hrs yes
5i.5pb.03 no no 16 hrs yes
5i.5pb.04 no yes 16 hrs yes
5i.5pb.05 yes no 16 hrs no
Actually drying NC gave good results: there were a lot fewer and smaller voids in the plaques: the remaining ones were placed in the peripheral area. Probably they were yielded by the natural polymer shrinkage during cooling down. This effect was noticeable only in the outer tile part because of the uneven cooling rate throughout the hot press platens. Indeed the cooling system was more efficient in the platens centre, where the polymer was rapidly solidified. The remaining molten polymer absorbed the whole volume reduction generating voids.
The idea of an inhomogeneous cooling rate was also supported by the presence, exactly in the peripheral area of the neat PP plaques, of some dendritic structures (clearly visible in Figure 3.16). In fact the slower the cooling, the higher the amount of PP crystalline phase, which is responsible of such a characteristic feature.
Figure 3.16: Dendritic structures in the peripheral area of a pure PP plaque
In the 5i.5pb.04 the PolyBond® granules were dried in oven at 80°C for 18 hours, as recommended by the supplier; nonetheless, since the PolyBond® bag was brand new and no differences were noticed between 5i.5pb.03 and 5i.5pb.04, it was decided not to dry the compatibilizer any longer, but instead to dry only the NC.
The same parameters given above were used to make a neat PP control plaque as described in Table 3.13.
Table 3.13
Compounding Hot Pressing
Name
Tc (°C) rpm Tp (°C) Pp (t/5” dia.) Cooling time
pPP 160, 165, 170, 170 500 200 20 45’
3.4.5 Definitive hybrid processing and composition parameters
The hybrid, which will be used from now on as the matrix for further laminate manufacturing, will be characterized by the following composition parameters:
• 5% of I.30P or C15A; • 2% or 5% of PolyBond®.
• The NC will be dried for 18 hours in oven at 80°C;
• Tc will vary from 160°C in the extruder hopper to 170°C in the die;
• Extruder screw speed will be 500 rpm; • Tp will be 200°C;
• Pp will be 20 tons/5”dia.
No information about the cooling rate is necessary since the next lamination stage will clear the whole material thermal history.
In addition to the plaques manufactured so far, the ones listed in Table 3.14 were also made using the stated parameters.
Table 3.14: Manufactured hybrid plaques
Plaque name NC grade NC wt% PPgMA wt% Cooling time
00.2pb.03 - NC free PPgMA free 30’
5i.2pb.07 2 19’ 5i.20pb.03 20 16h 5i.2pb.04 I.30P 5 2 30’ 2sc.2pb.04 2 2sc.5pb.03 5 30’ 2sc.10pb.07 2 10 60’ 5sc.2pb.05 2 5sc.5pb.06 5 30’ 5sc.15pb.08 15 60’ 5sc.25pb.10 25 45’ 5sc.15pb.09 C15A 5 15 60’
3.5 Laminates preparation
3.5.1 Nomenclature
The codes for laminates will be lam.X.YY.ZZZ, with X as PolyBond® 3200 weight percentage, YY as organo-clay grade (‘i’ for Nanocor® I.30P, ‘sc’ for Cloisite® 15A) and ZZZ as a contraction to distinguish different GF mat grades (‘epo’ for epoxy resin functionalized mat, ‘cle’ for heat cleaned glass, ‘emu’ for emulsion treated fabric and ‘pre’ for pre-pregs). In the name will not appear any reference to NC content, being always 5%.
A neat PP control laminate for each GF grade was made too and it will be named
lam.pPP.ZZZ with the same meaning for ZZZ as stated above.
3.5.2 First trials PP-GF
First of all, control specimens of PP and GF mat were prepared without nanoclay, only to check the glass grade effect on electrical properties. PP in pellet form (paragraph 3.2.1.1) and the two available cloth grades (paragraph 3.2.3) were used.
The samples belonging to this group, which are listed in Table 3.15, represent only a preliminary approach to the subject, and, for that reason, they do not follow the naming rules stated above.
Table 3.15: First PP-GF laminates
Sample name
Cooling
time Thickness Press Temperature GF mat grade lam.1 70’ lam.2 65’ lam.3 16h 3 mm lam.4 50’ lam.5 16h 220 ºC lam.6 16h 2 mm lam.7 16h Interglas® 120 FK600 lam.8 16h 1.5 mm 210 ºC ‘thick’
Since the final laminate thickness had to be 1.5 mm, these first trials were an attempt in looking for a suitable way to achieve this requirement. At the very beginning the thinnest frame available in the laboratory was exactly 1.5 mm; so tiles 1.5 mm thick were coupled in a 3 mm thick laminate which was subsequently squeezed up to the requested measure.
This procedure was adopted for lam.1 and lam.5. The result, though, was not satisfactory in terms of degradation of PP. The material, in fact, had to be subjected to three heating cycles: the first to mould the thin nanocomposite tiles, the second to couple them with the glass cloth and the third to squeeze the laminate.
So an attempt in reaching the final thickness together with the laminating pressing (lam.4, lam.5 and lam.6) was made. Nevertheless the poor homogeneity of mat placement through the matrix achieved made soon clear the need of a new 0.75 mm thick frame.
In each step both the fast and the slow cooling were evaluated, as appears clearly in ‘Cooling time’ column of Table 3.15, in order to investigate the behaviour of laminate in these two situations.
Two aspects were mainly taken in account: warpage and delamination.
The first is due to the higher thermal expansion coefficient of the peripheral area of the sample (constituted by PP alone) compared to the central area (reinforced with the GF fabric).
The second obviously depends on the almost insignificant adhesion between neat PP and the mat. As expected no difference was observed in samples processed in different ways apart from higher amount of crystalline phase in slow cooled laminates.
However, the availability of specimens with different thickness, degree of crystallinity and mat grade made it possible for Belfast Queen’s University to investigate the influence of these parameters on electric performance.
Indeed, the electrical analysis report on this group of laminates suggested which GF mat grade had to be used, excluding the ‘thick’ one.
Regarding the pressing temperature: it was kept as low as possible in order to reduce the thermal stress for the polymer and to avoid degradation as much as possible. However it could not be lowered too much because of the requirement
of a low viscosity to allow the melt flow to penetrate the fabric network. An optimum temperature was thus chosen at 200°C.
3.5.3 First group of laminates
Once the 0.75 mm thick frame was made, thin tiles were manufactured using the same compounding parameters as shown in paragraph 3.4.5. Then they were coupled by hot pressing to obtain the laminates listed in Table 3.16.
For all of them the hybrid NC content was 5% of I.30P and two GF mats were used: the epoxy functionalised (from now on referred as ‘untreated’, being in the same condition as supplied) and the heat cleaned.
The pressing parameters used were as stated in paragraph 3.4.3.
Table 3.16: First group of laminates
Sample name NanoClays PolyBond GF mat Cooling
lam.pPP.epo Epoxy functionalised 30’
lam.pPP.cle NC free PPgMA free Heat cleaned lam.2.i.epo 2%
lam.5.i.epo 5% Epoxy functionalised lam.2.i.cle 2%
lam.5.i.cle
5% of I.30P
5% Heat cleaned
3’
The first observation to be done here was that, as anticipated in paragraph 3.2.3.1, the heat cleaned GF mat is too weak, in fact, although the pressure was applied carefully during lamination, it was torn, as appears in Figures 3.17 and 3.18.
Figure 3.17: Heat cleaned GF mat Figure 3.18: Heat cleaned GF mat in a pure PP matrix in a PP/NC matrix
As a consequence, the heat cleaned GF mat was not used any more for testing C15A, being not suitable for our purposes. However, it was possible to cut some specimens from lam.2.i.cle; their tensile behaviour was studied in any case.
3.5.4 Second group of laminates
C15A, always at 5%, was used for manufacturing the laminates belonging to this group (listed in Table 3.17). The compounding and laminating parameters were kept as in the first group, in order to have coherent samples to compare with. Pre-pregs, untreated and emulsion coated mats were used.
Delamination was particularly noticeable in these samples. Laminates without compatibilizer (lam.1-lam.8) were almost completely delaminated; hence it was not possible to appreciate the different appearance of damaged and intact parts in the same sample.
Table 3.17: Second group of laminates
Sample name NanoClays PolyBond GF mat Cooling
lam.pPP.emu Emulsion Coated
lam.pPP.pre NC free PPgMA free Pre-preg lam.2.sc.epo 2% lam.5.sc.epo 5% Epoxy functionalized lam.2.sc.emu 2% lam.5.sc.emu 5% Emulsion Coated
lam.2.sc.pre 2% lam.5.sc.pre
5% of C15A
5% Pre-preg
60’ – 70’
On the contrary, in the last laminates, delamination was constrained to some small areas, which are clearly visible as whiter ‘worm-like’ spots in Figures 3.19 and 3.20. Thus, it was already possible to realize that maleated PP was actually working; this will be proven by further analysis in Chapter 4.
Figure 3.19: lam.2.sc.emu Figure 3.20: lam.5.sc.epo
Besides, delaminated areas showed the tendency to enlarge with time. This means that there was residual stress in the laminate, due to the different thermal expansion coefficients of PP and glass, strong
enough to detach the fibre from the matrix even after solidification.
As expected, no delamination at all was observed in laminates with pre-pregs as shown in the lam.5.sc.pre sample depicted in the side figure. In the last three micrographs the black rectangles delimit the areas where the tensile test specimens will be cut.
Section 3: Test methods
3.6 Hybrid Testing
3.6.1 Moisture Evaluation and Burn Off Test (BOT)
To compare the results coming from testing different samples made with different filler grades, it was fundamental to work out the actual inorganic clay contents of the hybrid. To achieve this goal it was necessary to evaluate the moisture content in raw materials and to remove PP, PPgMA and the surface treating agent (used to render the clay organophilic) from the nanocomposite by burning the samples.
Moisture evaluation was performed on Nanocor® I.30P, C.30P and Cloisite® 15A by putting a sample of each grade in a crucible that was kept in oven at 110°C for 70’ and successively cooled to room temperature for 2 hours in a desiccator. As said in Chapter 2, polypropylene thermally decomposes in the temperature range of 250°C to 450°C with substantial mass loss occurring at about 250 ºC and thermal decomposition being completed around 400 ºC.
Therefore it was believed that 4 hours in the furnace at 450°C should have been enough to complete the burn off test.
Nevertheless, since the nanoclay improves fire resistance of polymers, the first step in carrying out these tests, was to check whether or not the mentioned duration was effective to remove everything from clay.
These checking experiments were conducted on two crucibles, respectively containing samples of I.30P and C.30P, the results being showed in Table 3.18.
Table 3.18: Burn off test results on Nanocor® products
Weight % lost after 4 hrs at 450°C Weight % lost after 8 hrs and 40’ at 450°C
I.30P 22.85 24.73
C.30P 74.76 74.88
The increase in weight loss in the second burning process was 8.2% for I.30P and 0.1% for C.30P. The slight difference between the experiments allowed to assume the burning off to be completed after 4 hours at 450°C; thus these were the parameters used in all the following tests.
Another topic taken into account was the pellet shape: to check whether the lower specific surface of C.30P (in comparison with I.30P) affected or not the removal of the organic part of NCP, a burn off test was repeated on pellets previously burned and then smashed with a glass rod, the results being showed in Table 3.19.
Table 3.19
Weight % lost after 24 hrs at 450°C Weight % lost after smashing pellets and further 4 hrs at 450°C
C.30P 75.56 75.72
There is clearly no significant difference in weight loss in the last two measurements; therefore the lower specific surface does not hinder the removal of organic material.
3.6.2 Differential Scanning Calorimetry (DSC)
DSC tests were carried out with a DSC 2920 (Figure 3.21) from TA Instruments in order to study the crystallinity and the possible nucleating effect of nano-clays.
Figure 3.21: DSC equipment
This piece of equipment gave a pair of ‘heat flows-temperature’ values each second during the experiment.
The data were plotted using the software (Universal Analysis Version 2.6D Build 2.6.0.38 Release 2.7) provided by Thermal Solutions in a ‘heat flow/temperature’ curve and a further elaboration of the curves made it possible to calculate temperatures and heats of fusion and crystallization as well as onset temperatures of changing state.
A small piece of the material to be tested was weighted with a high precision balance (one hundredth of a milligram), placed in an aluminium pan and then covered with an aluminium lid. As reference an empty and plug aluminium pan was used (indicated by the arrow in Figure 3.22).
The sample was placed in the heating cell under nitrogen flow (30 ml/min) (Figure 3.23), to avoid unwanted oxidations.
A cooler working with compressed nitrogen (150 ml/min) was used to control temperature in the cooling stage.
The software allowed choosing different testing ‘methods’ by setting initial and final temperature as well as heating and cooling rate. In hybrid analysis an equilibration was achieved at -40°C, followed by a ramp of 8°C/min heating rate from -40°C to 220°C and a cooling step from 220°C to 40°C.
Figure 3.22: Sample and reference pan Figure 3.23: DSC heating cell
Such a low temperature was chosen to evaluate the glass transition temperature. However, after some trials, when the impossibility of estimating it by DSC was clear, the cycle was started from 20°C instead of -40°C.
For each plaque of NCP two samples were analysed.
3.6.3 Dynamical Mechanical Thermal Analysis (DMTA)
DMTA was carried out with an Eplexor® Dynamic Mechanical Thermal Spectrometer 7.1 from Gabo Qualimeter® (Figure 3.24). This technique was used to determine the storage modulus E’, the tan δ and the Tg of the samples. A three-point bending configuration (20 mm span) was chosen to apply a dynamic load of 5 N at 1 Hz frequency (Figure 3.25).
Figure 3.24: DMTA equipment Figure 3.25: DMTA cell
A static load of 10 N was applied as well to hold the specimen which was 17x40x1.5 mm. The tests were performed at a heating rate of 3°C/min for a range of temperature which is from -40°C to 40°C.
3.6.4 Optical Microscopy (OM)
OM was carried out in order to give a first look to the macroscopic hybrid (and laminate) appearance, the optical microscope (Nikon® Optiphot®) being showed in Figure 3.26.
Figure 3.26: Optical microscope
The latter was equipped with 4 lenses (5x, 10x, 20x, 40x) and completed with a digital camera connected to a PC with a photo processing software (Acquis® from Syncroscopy®).
The specimens were cut by a band saw in an almost square shape of about 1.5 cm side. Each of them was clamped on a metal spring, then put in a plastic crucible-shaped mould and filled with a thermosetting resin. The resin to be used was chosen between two different grades according to the needs: an acrylic cold setting resin (TriHard® from Metprep® ltd., Figure 3.27) with a curing time of 15 min. and a transparent epoxy resin (Epofix® from Struers®, Figure 3.28) with a slower curing (8 hours).
Figure 3.27: Specimen prepared for OM Figure 3.28: Specimen prepared for OM in the acrylic cold setting resin in the transparent epoxy resin
The main difference between them being the stiffness: the first was softer than the second. In fact, since the resin task is to support the specimen during polishing, it is important for them to have a similar rigidity.
A first manual operation intended to flatten both surfaces of the sample was conducted with a coarse grinding paper (220 grit), followed by a polishing procedure with a polishing machine (Figure 3.29) which used a series of successively finer abrasives. When a minimum of 6 samples were prepared, they were positioned on a support disk (Figure 3.30) which was eventually clamped on the machine.
Figure 3.29: Polishing machine Figure 3.30: Support disk
In all the steps followed during the polishing procedure, water was used as lubricant and the support disk was corotating at 100 rpm with the abrasive disk, which was silicon carbide grinding paper. The pressure applied by the machine was 5 pounds on each sample. Table 3.20 summarizes the entire operation.
Table 3.20
Abrasive Operation Lubricant Duration 1st step SiC paper 220 grits Manual Water Until flattened
2nd step SiC paper 220 grits Automated Water 2 min
3rd step SiC paper 220 grits Automated Water 2 min
4th step SiC paper 1200grits Automated Water 2 min
5th step SiC paper 1200grits Automated Water 2 min
6th step SiC paper 2500grits Automated Water 2 min
7th step SiC paper 2500grits Automated Water 2 min 8th step Water suspended alumina Automated --- 4 min
The last step was carried out using a woven polyester cloth disk with a watery suspension of alumina (Linde alpha alumina) with a particle size of about 0.3 µm. Some optical microscopy pictures were taken from laminate specimens as well: in this case the samples were treated, after polishing, with ultrasonic waves to remove any glass scales possibly entrapped in the fibre bundles.
3.6.5 Scanning Electron Microscopy (SEM)
The samples macro-morphology was examined by SEM. The machine was a Stereoscan® 250 MK3 Scanning Electron Microscope from Cambridge Instruments® (Figures 3.31 and 3.32). It was equipped with an Energy Dispersive X-Ray system which was utilised to study the composition of the samples.
Figure 3.31: Scanning electron microscope Figure 3.32: SEM vacuum chamber
The specimens were previously coated with a gold-palladium layer to make them conductive.
3.6.6 X-Ray Diffraction (XRD)
Intercalation and exfoliation were assessed by XRD, measuring spacing between the clays in the stacked layers of montmorillonites by means of a Siemens® D5005 X-Ray Diffractometer (Figures 3.33 and 3.34) with the Cu Kα radiation
(λ=0.154 nm) operating at 40 kV and 40 mA. The angular step size was 0.03° with a step time equal to 1 second from 1° to 15°.
For our evaluation the diffractometer was used for small angles thus even a small offset could affect the result.
This is the reason why particular attention was paid in adjusting the alignment of X-ray equipment, upper surface of the sample and peak of the knife; the level of them being called ‘height reference’.
Two micrometer screws were used to set it. The first screw was used to align the peak of the knife with the X-ray generator and detector, while the second was for adjusting the position of the table to allow the sample to reach the knife.
Figure 3.33: XRD equipment Figure 3.34: Diffractometer chamber
Samples were cut by a band saw from the flatter and smoother areas of the plaques.
It is important for the specimen to be plane; the diffraction starts from a very small angle, a bent or uneven sample could hamper the beam from reaching the upper surface, as schematically represented on Figure 3.3513.
Figure 3.35
Samples dimensions were 20×40 mm. Some specimens were made both with powder and pellet NC, to plot the XRD pattern of raw materials as well. In order to prepare the former, a transfer tape was stuck on a glass slide and then covered with a layer of powder.
Finally, to achieve a flat surface, another slide was hand pressed on the sample. The pellet sample was prepared simply by hand squashing a small amount of C.30P between two glass slides on a Mag Stirrer® (B&T Company) hotplate. The slides were previously sprayed with a release agent and the upper one was removed after cool down was completed.
3.6.7 Focused Ion Beam (FIB)
FIB systems operate in a similar fashion to a SEM but, instead of using a beam of electrons, these systems use a finely focused beam of gallium ions that can be operated at low beam currents for imaging or high beam currents for site specific sputtering or milling.
In this work a FIB 200 Focused Ion Beam Workstation (FEI Company) was used (Figure 3.36).
Figure 3.36: Focused ion beam equipment
As the illustration in Figure 3.3714 shows, the gallium (Ga+) primary ion beam hits the sample surface and sputters a small amount of material, which leaves the surface as either secondary ions (i+ or i-) or neutral atoms (n0). The primary beam also produces secondary electrons (e-). As the primary beam rasters on the sample surface, the signal from the sputtered ions or secondary electrons is collected to form an image.
Figure 3.37: Scheme of FIB mechanism
Of course, similarly to the SEM systems, the ions gun has to be placed in a vacuum chamber (Figure 3.38).
At low primary beam currents (used for taking micrographs), very little material is sputtered whereas at higher primary currents, a great deal of material can be removed by sputtering, allowing precision milling of the specimen down to a sub micron scale. Our system could achieve 15-20 nm imaging resolution.
Figure 3.38: FIB vacuum chamber
For the present analysis, a piece of plaque with an upper surface of roughly 1 cm² and a thickness equal to 1.5 mm was machined by the FIB system using a high primary beam current in order to obtain a parallelepiped shaped hole as shown in the illustration. The image was taken from one of the side hole surfaces, being characterized by
having a very good finish (contrariwise to the bottom). In order to ‘view’ this surface (which is perpendicular to the upper external one), the sample had to be tilted in situ. With a low primary current, the beam of gallium ions was
focused and scanned over the surface of the sample and an image was obtained. Due to the tilt, the image scale was not the real one: the hole depth measured by hand from the picture (scaling apart) had to be divided by sin(α) to give the actual hole profundity, α being the tilt angle.
3.7 Laminate Testing
3.7.1 Scanning Electron Microscopy
The adhesion between fibres and matrix was qualitatively estimated by means of representative SEM micrographs taken from the fracture surfaces of Tensile Test specimens. Equipment and sample preparation were described above.
3.7.2 Tensile Test (TT)
Dumbbell shaped testing specimens were cut from the moulded plates and used for tensile testing. ASTM D638 standard was used: requested dimensions are illustrated in Figure 3.39.
TILT High primary ion
beam current
Low primary ion beam current
Bottom uneven
Dimensions mm (inches) W—Width of narrow section 13 (0.50)
L—Length of narrow section 57 (2.25) WO—Width overall, min 19 (0.75) LO—Length overall, min 165 (6.5) G—Gage length 50 (2.00) D—Distance between grips 115 (4.5) R—Radius of fillet 76 (3.00)
In all the GF mat grades adopted, the fibres were arranged in a biaxial fashion and the dumbbell specimens were cut exactly in the fibres direction in order to apply the tensile strength along their length.
All the experiments were carried out on an Instron® 4467 (Figure 3.40). Tensile test was repeated for at least two specimens for each plaque at a strain rate of 5 mm/min. All the tests were conducted at room temperature (about 21°C).
Figure 3.40: Tensile test equipment Figure 3.41: TT loading cell
and extensometer
An Instron® extensometer was also used (Figure 3.41) allowing the software to plot a load (‘F’, Newtons) versus displacement (‘∆l’, millimetres) curve. Three measurements were taken both for thickness and for width of each sample by means of a micrometer (measures are available in Appendix IX).
Average values were used to work out the cross section area (‘A’), which was considered constant during the whole test. Assuming the gauge length (‘l’) to be the same for all the specimens, the stress (‘σ’, Pascals) versus strain (‘ε’) curve could be plotted, being:
A F
σ = and l ∆l
ε= . Such curve yielded values of maximum stress and of the Young’s Modulus.
1 Cozien Cazuc S, Investigation Of Polypropylene/Clay Composites, M.Sc. Thesis, Cranfield University (2002)
2 Beyer R, Nanocomposite Workshop, Model Polymer-Layered Silicate Nanocomposites (September 2001) Risley Hall, Derby, UK
3 Nanocor Technical Data, Lit. G-105 Polymer Grade Montmorillonite,
http://www.nanocor.com/tech_sheets/G105.pdf (accessed March 2003)
4 Nanocor Technical Data, G-100 General Information About Nanomers,
http://www.nanocor.com/tech_sheets/G100.pdf (accessed March 2003)
5 Nanocor Technical Data, Lit. P-808 “P Series” Nanomer Specifications,
http://www.nanocor.com/tech_sheets/P808.pdf (accessed March 2003)
6 Nanocor Technical Data, Lit. P-809 “P Series” Concentrate Specifications,
http://www.nanocor.com/tech_sheets/P809.pdf (accessed March 2003)
7 Southern Clay Products Inc., Cloisite 15 A, http://www.nanoclay.com/data/15A.htm (accessed March 2003)
8 Rudd C, Nanocomposite Workshop, Nano Reinforced Polymers And Long Fibre Composites – Manufacturing Issues (September 2001) Risley Hall, Derby, UK
9 Saint Gobain Vetrotex, TwinTex Overview, http://www.twintex.com/tw_overview.html (accessed January 2004)
10 Nanocor Technical Data, P-801 Guidelines For The Production Of Polypropylene
Nanocomposites, http://www.nanocor.com/tech_sheets/P801.pdf (accessed March 2003)
11 Hasegawa N, Kawasumi M, Kato M, Usuki A, Okada A, Journal Of Applied Polymer Science,
67 (1998) 87
12 Kaempfer D, Thomann R, Mülhaupt R, Polymer, 43 (2002) 2909
13 Commin L, De Blic A, Ferrari S, Silbermann V, Novel Thermoplastic Matrix Composite, M.Sc. Group Project Report, Cranfield University (2003)
14 Fibics Incorporated, Introduction: Focused Ion Beam Systems,