Taste dysfunction in patients undergoing
hematopoietic stem cell transplantation:
Clinical evaluation in children
Majorana A, Amadori F, Bardellini E, Campus G, Conti G,
Strohmenger L, Schumacher RF, Polimeni A. (2015) Taste dysfunction in patients undergoing hematopoietic stem cell transplantation: Clinical evaluation in children. Pediatr Transplant, 19: 571–575.
DOI: 10.1111/petr.12535.
Abstract: The aim of this study was to determine the variability of TD in children undergoing HSCT. Cases were identified as
consecutively enrolled children in the period January 2011–January 2013 among patients attending the Paediatric Department of Spedali Civili of Brescia and all candidates to HSCT. The TST was
conducted in two phases: identification of threshold values and identification of perceived stimulus intensity. Sixteen sapid solutions with four flavors (sucrose, sodium chloride, citric acid, and quinine hydrochloride) at four different concentrations were administered in a random sequence. The same protocol was administered at different time intervals: before starting the conditioning therapy (T0), during the conditioning therapy (T1) (two times), and every three months (two times) after engraftment post-HSCT (T2). A p-value < 0.05 was considered statistically significant. Fifty-one children (29 female and 22 male, mean age 5.2! 0.7 yr) were enrolled. Threshold value means for the four flavors increased during HSCT conditioning therapy (T1) (p < 0.01); intensity of perceived stimulus decreased during HSCT conditioning therapy (p < 0.01). At six months after engraftment (T2), both parameters had returned to starting values (T0). Changes in taste perception in children undergoing HSCT seem to occur especially during the conditioning therapy and resolve in about six months after engraftment post-HSCT.
Alessandra Majorana1, Francesca Amadori1, Elena Bardellini1, Guglielmo Campus2, Giulio Conti3, Laura Strohmenger4, Richard Fabian Schumacher5and Antonella Polimeni6 1Department of Pediatric Dentistry, Dental School,
University of Brescia, Brescia, Italy,2Department of
Surgery, Microsurgery and Medical Sciences, Dental School, University of Sassari, Sassari, Italy,3IRCCS
“Ca Granda-Ospedale Maggiore”, University of Milano, Milan, Italy,4Department of Health Science,
University of Milano, Milan, Italy,5Pediatric
Clinic-Department of Transplantation, AO Spedali Civili di Brescia, Brescia, Italy,6Department of Oral and
Maxillo-Facial Science, “Sapienza” University of Rome, Rome, Italy
Key words: dysgeusia – children – hematopoietic stem cell transplantation
Francesca Amadori, Dental Clinic, P.le Spedali Civili 1, 25133 Brescia, Italy
Tel.: 00390303996521 Fax: 0039030303194
E-mail: [email protected] Accepted for publication 1 May 2015
While advances in cancer therapy for children continue resulting in higher survival rate, oral complications remain a significant cause of morbidity and potential mortality. Cancer ther-apy-related oral complications are common in paediatric patients undergoing chemotherapy, myeloablative chemotherapy prior to HSCT, or radiation therapy for head and neck cancers or solid tumors (1, 2). Children and adolescents present with acute and long-term oral side effects more than adults with an incidence of 30–100% (3, 4).
HSCT is widely used as a potentially curative treatment for patients with various hematological malignancies, bone marrow failure syndromes, and congenital immune deficiencies. The course and success of the transplant can be affected by oral complications, whose overall prevalence is estimated to be 80% (5). Mucositis, oral infec-tions, TD, xerostomia, and bleeding are recog-nized as common acute oral complications with risks of severe pain, malnutrition, and potential systemic infections, resulting in increased hospital-ization and higher costs of care (6, 7). Many stud-ies have addressed oral mucositis and xerostomia, while very few studies have been published on TD in children.
The sense of taste is a sensorial system modal-ity that has a critical role in the life and nutri-tional status of the human being (8). It is
Abbreviations: HSCT, hematopoietic stem cell transplanta-tion; TBI, total body irradiatransplanta-tion; TD, taste dysfunctransplanta-tion; TST, taste sensitivity test.
Pediatric Transplantation DOI: 10.1111/petr.12535
estimated that about 50–75% of cancer patients suffer from TD, which could impact perception for all four tastes, that is, salty, sweet, sour, and bitter (9). The impaired ability to taste, particu-larly in children, affects appetite, reduces caloric intake, induces weight loss, and worsens the nutritional status (10, 11). Furthermore, TD may cause anxiety, depression, and nutritional defi-ciencies that may be dangerous, especially in growing individuals (12).
The knowledge of TD features and prevalence in children undergoing HSCT could be extremely useful to define a targeted diet for these patients, to improve their quality of life and also the out-come of the entire treatment.
In a previous study, we validated a TST in a group of 40 healthy children (12). Starting from the knowledge of normal taste sensitivity, this study aimed to determine the variability of TD in children undergoing HSCT.
Materials and methods Sample selection
This study was designed as a case-consecutive study. Cases were identified as children consecutively enrolled in the period January 2011 to January 2013 among the patients attending the Paediatric Department of Spedali Civili of Brescia that were candidates to HSCT for newly diagnosed hemato-oncologic diseases. Children aged 3– 12 yr were considered eligible for the study. Patients with mucosal lesions, history of food and drug allergies, and chronic diseases (i.e., asthma, diabetes, coeliac disease) were excluded. All children’s parents or caregivers gave informed consent according to the recommendations of the Declaration of Helsinki. Ethical approval for the research was granted by the Ethic Committee (PRIN No. 200832LJ7P) of the Faculty of Medicine, University of Brescia, Italy.
Taste evaluation
The TST, previously validated in another study (12), was conducted in two phases: identification of threshold values and identification of perceived stimulus intensity. Two pre-viously calibrated examiners performed the TST in a quiet room following a standardized protocol.
The test was performed using 16 sapid solutions at the temperature of 24 °C (75.2 °F) with the four flavors (sucrose, sodium chloride, citric acid, and quinine
hydro-chloride) at four different concentrations (solution 1 was the most dilute, solution 4 was the most concentrated) (Table 1). Each clinician administered every solution once, in addition to placebo solution (deionized water).
The patients tasted the solutions at the four concentra-tions and were asked to identify their taste threshold, that is, the lowest concentration at which each flavor could be distinguished from water.
Samples were given in 2 mL solution, measured with spe-cific pipettes, for at least 10 s. After each test, the subjects were asked to rinse their mouth for 10 s with water. At the end of the tasting phase, the results were reported on a chart and then analyzed, starting from the lowest concentration of the substance and proceeding towards the highest (from 1 to 4) to define the thresholds. To avoid bias due to the modality, the sequence of the solutions administered was randomly switched with every child following a predeter-mined way: bitter, sour, sweet, salty; sour, sweet, bitter, salty; sweet, salty, bitter, sour; salty, sour, bitter, sweet; and so on. The children did not know in advance the type of solution administered or the progressively increasing con-centration. The intensity of the stimulus was evaluated according to an analogical scale from 0 to 10 (where 0 is a neutral stimulus, i.e., water, and 10 is the maximum inten-sity of a flavor).
The same test protocol was used at different time inter-vals: before starting the conditioning therapy (T0), during the conditioning therapy (T1) (two times), and every three months (two times) after engraftment post-HSCT (T2).
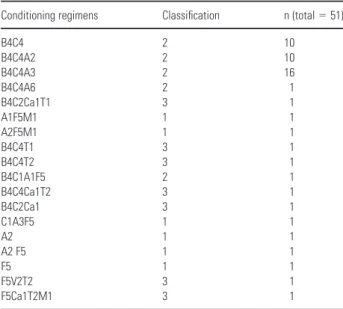
The conditioning regimens were categorized as “severe” if they included TBI, included more than two drugs with busulfan and one of the following: thiotepa or ale-mtuzumab or etoposide. All other conditioning regimens including busulfan for more than two days were classified as “medium,” and the remaining were classified as “light” (Table 2).
Table 1. Flavors and concentrations used for the test
Taste Flavor
Bitter Quinine hydrochloride
Salty Sodium chloride
Sweet Sucrose
Sour Citric acid
Concentration: SOL 1 0.000032M, SOL 2 0.0001M, SOL 3 0.00032M, SOL 4 0.001M.
Table 2. Classification of the conditioning regimens (1 = light conditioning regimen; 2 = medium conditioning regimen; 3 = severe conditioning regimen) (where A = antithymocyte globulin, B = busulphan, C = cyclophosphamide, Ca = alemtuzumab, F = fludarabin, M = melphalan, T = thiotepa, V = vepe-side and the numbers refer to the days each drug was used)
Conditioning regimens Classification n (total = 51)
B4C4 2 10 B4C4A2 2 10 B4C4A3 2 16 B4C4A6 2 1 B4C2Ca1T1 3 1 A1F5M1 1 1 A2F5M1 1 1 B4C4T1 3 1 B4C4T2 3 1 B4C1A1F5 2 1 B4C4Ca1T2 3 1 B4C2Ca1 3 1 C1A3F5 1 1 A2 1 1 A2 F5 1 1 F5 1 1 F5V2T2 3 1 F5Ca1T2M1 3 1
Statistical methods and data analysis
Data were inserted into an ad hoc prepared Excel! work-sheet. A descriptive analysis of mean values by ranks of different solutions in different times was performed. Fur-thermore, a generalized least squares for trend estimation of summarized dose–response date for every solution was car-ried out. A p-value < 0.05 was considered statistically sig-nificant.
Results
Of 116 pediatric candidates to HSCT, a total of 51 children (29 female and 22 male, mean age 5.2 ! 0.7 yr) were considered eligible from the research team (Fig. 1).
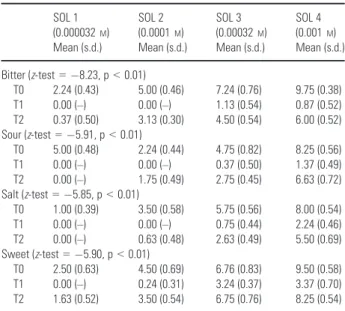
Results for threshold value means are repre-sented in Table 3. Analysis by ranks was statisti-cally significant, underlining a statistically significant linear trend. The difference between threshold value means at T0 and T1 was statisti-cally significative (p < 0.01), as well as between T1 and T2 (p < 0.01). The difference of threshold value means between T0 and T2 was not statisti-cally significant (p = 0.14).
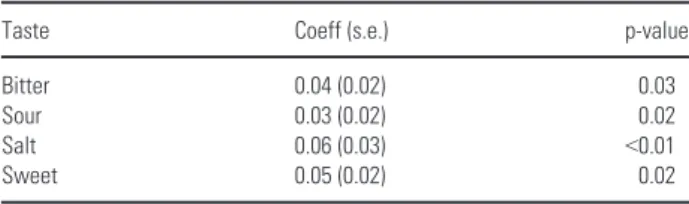
Values for perceived intensity at the three inter-val times resulted as follows: during conditioning therapy, bitter, sour, and salty were recognized only at the third concentration, and sweet at the second concentration; at T2, every flavor was rec-ognized in the most diluted solution, returning to T0 values. The generalized least squares for trend estimation of dose-response data for every solu-tion type resulted statistically significant with an
higher response for the salt taste followed by sour and sweet taste. (Table 4).
The increase in the severity of the conditioning regimen was not statistically associated with either an increase in the alteration of the thresh-old value means or a decrease in the perceived intensity of the stimulus.
ENROLLMENT Assessed for eligibility (n=116)
Consecutive patients (n=61) Excluded (n=55). Not meeting inclusion criteria Analyzed (n=51)
Excluded from analysis (not signed informed
consent) (n=3) Excluded from analysis
(worsening health
condition) (n=6) Excluded from analysis
(death) (n=1)
Fig. 1. Diagram demonstrating the flow of participants through each stage.
Table 3. Threshold values means for each flavor (bitter, sour, salt, sweet) at time T0, T1, T2 SOL 1 (0.000032M) Mean (s.d.) SOL 2 (0.0001M) Mean (s.d.) SOL 3 (0.00032M) Mean (s.d.) SOL 4 (0.001M) Mean (s.d.) Bitter (z-test = "8.23, p < 0.01) T0 2.24 (0.43) 5.00 (0.46) 7.24 (0.76) 9.75 (0.38) T1 0.00 (–) 0.00 (–) 1.13 (0.54) 0.87 (0.52) T2 0.37 (0.50) 3.13 (0.30) 4.50 (0.54) 6.00 (0.52) Sour (z-test = "5.91, p < 0.01) T0 5.00 (0.48) 2.24 (0.44) 4.75 (0.82) 8.25 (0.56) T1 0.00 (–) 0.00 (–) 0.37 (0.50) 1.37 (0.49) T2 0.00 (–) 1.75 (0.49) 2.75 (0.45) 6.63 (0.72) Salt (z-test = "5.85, p < 0.01) T0 1.00 (0.39) 3.50 (0.58) 5.75 (0.56) 8.00 (0.54) T1 0.00 (–) 0.00 (–) 0.75 (0.44) 2.24 (0.46) T2 0.00 (–) 0.63 (0.48) 2.63 (0.49) 5.50 (0.69) Sweet (z-test = "5.90, p < 0.01) T0 2.50 (0.63) 4.50 (0.69) 6.76 (0.83) 9.50 (0.58) T1 0.00 (–) 0.24 (0.31) 3.24 (0.37) 3.37 (0.70) T2 1.63 (0.52) 3.50 (0.54) 6.75 (0.76) 8.25 (0.54) T0 = before starting conditioning therapy.
T1 = mean of the two measurements during conditioning therapy. T2 = mean of the two measurements after engraftment. [0 = neutral stimulus, 10 = maximum intensity of the flavor].
Discussion
Taste alteration is a significant common problem related to cancer therapy (8), and it is one of the major causes of food aversion intake in children. Literature studies focused on TD during HSCT in children are hardly available. This study exam-ines taste perception in children before, during, and after conditioning therapy and attempts to verify the presence and the duration of TD in this type of pediatric population.
There are various mechanisms behind TD: interference between toxic drugs and taste-recep-tor cell turnover seem to play a major role. Che-motherapy protocols use chemicals that interfere with mitotic activity to destroy proliferating cells. As taste receptors proliferate rapidly, the renewal of these cells is stopped by antineoplas-tic drugs until they remain active, with the con-sequence that taste coding might be disrupted during therapy; when chemotherapy stops, a high proportion of taste cells rapidly renew and make new contacts with nerve fibers (13, 14). This can explain our finding that normal taste returns about six months after conditioning therapy (15). Chemotherapy can also have an immediate effect on taste because some drugs pass into saliva, directly modifying taste percep-tion (16).
The mechanisms determining TD may explain the results of this study, which are slightly differ-ent than some previous reports, mostly involving adults. Some studies showed that TD could take from 1 to 3 yr from the end of therapy to nor-malize (17), while we found a return to normal values by six months after engraftment, with a Gaussian trend. This discrepancy could be explained by the more rapid taste receptors regeneration in children compared to adults (18). However, as regards the thresholds values, our results are in agreement with other previously published reports (19, 20), which found signifi-cantly higher recognition threshold values for the four tastes or at least an increase in the salty threshold during chemotherapy (21). In the
pres-ent study, a significant difference between thresh-old value means at T0 and T1 was found for all flavors.
The conditioning regimens were categorized as “severe,” “medium,” and “light” on the basis of the type of drugs and the days each drug was administered (Table 2). Among the chemo-therapy drugs used, cyclophosphamide, melpha-lan, thiotepa, and etoposide are known to be associated with taste changes and to be also highly emetogenic (10). However, no statistically significant correlation between the severity of the conditioning regimen and the alterations of the threshold values or the intensity of the perceived stimulus was found.
The problem of food intake in children with oncologic problems is very common. Nausea and vomiting play a potent role in the development of food aversion. Moreover, food neophobia (that is the avoidance of unfamiliar food) and depression or anxieties due to preoccupied par-ents’ coercion are further contributing factors (10). The results of this study confirm that these children can also temporarily suffer from altered taste sensation. Our results strengthen the hypothesis that taste alterations during cancer therapies should be routinely assessed with the use of an objective, easy to use and low cost method (6), in order to identify factors that inter-fere with the child’s food intake (10, 22). Further studies are needed to identify possible medical devices able to influence food perception. For instance, oral zinc has been used to treat taste and smell abnormalities in several alterated phys-iologic states, including cancer-related TD (23). The child’s individual food preferences and aver-sion should be considered and combinations of oral, enteral, and parenteral nutritional support should be used.
Acknowledgment
The authors wish to thank Stefania Polsoni for the native speaker support.
Authors’ contributions
Prof Alessandra Majorana, FP and Prof Antonella Poli-meni, FP: Participated in concept design and approval of the article; Dr Francesca Amadori, DDS, PhD: Participated in data analysis and drafting of the article; Dr Elena Bardel-lini, DDS: Participated in data collection and drafting of the article; Prof Guglielmo Campus, AP: Participated in data analysis and interpretation; Dr Giulio Conti, DDS, PhD: Participated in data collection and statistical analysis; Dr Richard Fabian Schumacher, MD: Participated in criti-cal revision and approval of the article; Prof Laura Strohm-enger, FP: Participated in concept design and revision of the article.
Table 4. Estimates of the generalized least-square regression for the four tastes in the case group
Taste Coeff (s.e.) p-value
Bitter 0.04 (0.02) 0.03
Sour 0.03 (0.02) 0.02
Salt 0.06 (0.03) <0.01
Sweet 0.05 (0.02) 0.02
Generalized least squares regression: number of obs = 4. Goodness-of-fitv2
References
1. BARDELLINIE, SCHUMACHERF, CONTIG, PORTAF, CAMPUSG, MAJORANAA. Risk factors for oral mucositis in children receiv-ing hematopoietic cell transplantation for primary immunodefi-ciencies: A retrospective study. Pediatr Transplant 2013: 17: 492–497.
2. HOVANAJ, WILLIAMSPM, STEVENSON-MOOREP, et al. A sys-tematic review of dysgeusia induced by cancer therapies. Sup-port Care Cancer 2012: 18: 1081–1087.
3. MORAIS EFE, LIRA JAS, MACEDO RAP, SANTOS KS, ELIAS CTV, ARRUDA-MORAIS MLS. Oral manifestations resulting from chemotherapy in children with acute lymphoblastic leuke-mia. Braz J Otorhinolaryngol 2014: 80: 78–85.
4. HONGJH, OMUR-OZBEKP, STANEKBT, et al. Taste and odour abnormalities in cancer patients. J Support Oncol 2009: 7: 58–65.
5. RABER-DURLACHERJE, BARASHA, PETERSONDE, LALLARV, SHUBERTMM, FIBBEWE. Oral complications and management considerations in patients treated with high-dose cancer chemo-therapy. Support Cancer Ther 2004: 4: 219–230.
6. IMAIH, SOEDAH, KOMINEK, OTSUKAK, SHIBATAH. Prelimin-ary estimation of the prevalence of chemotherapy-induced dys-geusia in Japanese patients with cancer. BMC Palliative Care 2013: 12: 38.
7. MOSELDD, BAUERRL, LYNCHDP, HWANGST. Oral complica-tions in the treatment of cancer patients. Oral Dis 2011: 17: 550–559.
8. BOER CC, CORREAMEP, MIRANDA ECM, SOUZACA. Taste disorders and oral evaluation in patients undergoing allogen-ic hematopoietallogen-ic SCT. Bone Marrow Transplant 2010: 45: 705–711.
9. WONGHM. Oral complications and management strategies for patients undergoing cancer therapy. Scientific World Journal 2014: 581795.
10. SKOLINI, WAHILNYB, BROMANDA, HURSTIUKK, LARSSON MV, HERNELLO. Altered food intake and taste perception in children with cancer after start of chemotherapy: Perspectives of children, parents and nurses. Support Care Cancer 2006: 14: 369–378.
11. HONG CH, DA FONSECA M. Considerations in the pediatric population with cancer. Dent Clin North Am 2008: 52: 155– 181.
12. MAJORANAA, CAMPUSG, ANEDDAS, et al. Development and validation of a taste sensitivity test in a group of healthy chil-dren. Eur J Paediatr Dent 2012: 13: 147–150.
13. BERTERETCHE MV, DALIX AM, CESAR D’ORNANO AM, B EL-LISLEF, KHAYATD, FAURIONA. Decreased taste sensitivity in cancer patients undergoing chemotherapy. Support Care Cancer 2004: 12: 571–576.
14. EPSTEIN JB, BARASCH A. Taste disorders in cancer patients. Pathogenesis and approach to assessment and management. Oral Oncol 2010: 46: 77–81.
15. COHENJ, LAINGDG, WILKESFJ, CHANA, GABRIELM, COHN R. Taste and smell dysfunction in childhood cancer survivors. Appetite 2014: 75: 135–140.
16. COMEAUTB, EPSTEINJB, MIGASC. Taste and smell dysfunction in patients receiving chemotherapy: A review of current knowl-edge. Support Care Cancer 2001: 9: 575–580.
17. MATTESRD, COWARTBJ, SCHIAVOMA, ARNOLDC, GARRISON B, KAREMR. Dietary evaluation of patients with smell and/or taste disorders. Am J Clin Nutr 1990: 51: 233–240.
18. MOJET J, CHRIST-HAZELHOF E, HEIDEMA J. Taste perception with age: Generic or specific losses in threshold sensitivity to the five basic tastes? Chem Senses 2001: 26: 845–860.
19. WALLTD, GABRIELLA. Alteration of taste in children with leukemia. Cancer Nurs 1983: 6: 447–452.
20. COHENJ, LAINGDG, WILKESFJ. Taste and smell function in pediatric blood and marrow transplant patients. Support Care Cancer 2012: 20: 3019–3023.
21. BARALEK, AKERSN, MARTINSENCS. Primary taste thresholds in children with leukemia undergoing marrow transplantation. J Parenter Enteral Nutr 1982: 6: 287–290.
22. WISMERWV. Assessing alterations in taste and their impact on cancer care. Curr Opin Support Palliat Care 2008: 2: 282–287. 23. LYCKHOLML, HEDDINGERSP, PARKERG, et al. A randomized,
placebo controlled trial of oral zinc for chemotherapy-related taste and smell disorders. J Pain Palliat Care Pharmacother 2012: 26: 111–114.