10
Chapter 2
2.1 Correlation between in-vitro models and physiology
When a new in-vitro model is developed the first question that may drive the analysis of its potentiality should be referred to its meaningfulness: which is the correlation to the physiological environment and how deep does the output correspond to a physiological signal? Currently the in-vitro cell models are poorly representative of human physiology. Several aspects are causes of uncorrelated models and some of them will be treated in this short introduction. 2D monocultures represent the gold standard in biology, but they are far from a close representation of reality. Tissues are generally composed of a hierarchical 3D structure where different cells promote different functions and influence the others and their differentiation. It is therefore clear that a system where organization structure and multi cells aspects are not represented cannot be used as model to better understand physiological features. In order to solve this problems recently new 3D models developed. 3D organization should be reconstruct using scaffolds or extracellular matrix, as described in chapter 1. Despite of the possibility that new devices offer to biologists, models composed by a single cell types cannot correlate with a real physiologic tissue. A model where several cells types are cultivated together in order to reproduce the environmental condition that characterize physiology is required. The goal should be to find a way to simulate the hierarchical structure that is typical of an in vivo system. Currently some theories of self organization in tissues suggest that it is possible to mimic physiological hierarchical structure by introducing different cells types in a suitable in-vitro environment and promoting cells differentiation by suitable stimuli. For example McDevitt et al. in [17] observed that when additional cardiomyocytes were seeded onto a pattern cultures obtained using a polyurethane scaffold, new cells aligned in order to form a multilayer structure organized as a 2-3 cell layers thick tissue. After some days of incubation new tissue is able to contract the thin solvent-cast polyurethane. This is a demonstration that
11 there could be a structure memory in cells and that they can self organize if the environmental conditions are suitable. The question is therefore how to promote suitable interaction between cell types and if it is also possible to simulatel all the cross correlation that cells of a target tissue provide. Nowadays it is evident from a practical point of views that it is not possible to establish an in-vitro model that can simulate all the physiological functions of a target tissue. Biologists have therefore to identify key aspects that are relevant in order to simulate physiological relationships between different organs, in order to evaluate a suitable method of study. The need to focus the attention on a particular aspect of physiology is an important characteristic that has to be kept in mind in order to understand the in-vitro model philosophy that is proposed in this thesis.
This chapter is focused on methods that permit the establishment of meaningful in-vitro models to mimic physiological multi organ systems. The attention is focused on Allometry, a mathematical approach that permit researchers to maintain the important relationships between organs and their features that characterize the physiological environment. Using this approach it is possible to design experiments or devices that allow biologists to mimic physiological tissues with a high correlation to some hierarchical aspects that control in vivo cross talk. An example can be represented by cell numbers that should characterize each in-vitro tissue, in order to obtain a multi organs model that take care of physiological ratio between tissues characteristics. In this way the output of the ideal model is closing correlated to what happens in vivo, permitting a better analysis of the physiological environment.
12
2.2 Allometry: the missing link between physiology and in-vitro
models
Allometry is the science of scaling and deals with changes in body size and relationships amongst different parameters and processes in all organisms as a function of body mass W. Features of interest can be for example basal metabolic rate (BMR), life span, body surface area. Allometry is a mathematical approach and it is based on an exponential equation:
(1)
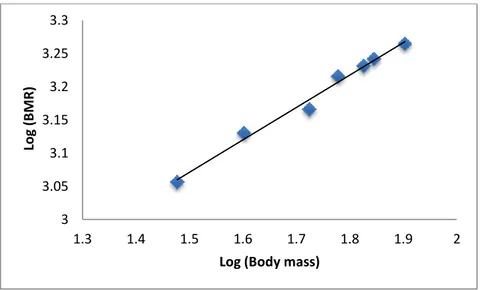
Y stands for features of interest that have to be correlated to body mass W. “a” and “b” are allometric parameters as it will be described. The relationship is valid for all mammals and permits the correlation between inter species or intra species features. “b” is evaluated by a correlation of a particular feature of an animal with its body mass on a log-log graph. The slope of the straight line that follows data is “b” [18]. In figure 2.1 an example is represented. Basal metabolic rate of humans is plotted against body mass using log scales. The sample population is composed of males and females included in a range between 20 and 40 years old. It is possible to estimate the slope of the straight line. As can be seen in figure 2.2.1, the slope is 3/4, then “b” is equal to ¾.
Figure 2.1 log-log plot of BMR and body mass
3 3.05 3.1 3.15 3.2 3.25 3.3 1.3 1.4 1.5 1.6 1.7 1.8 1.9 2 Log (B M R )
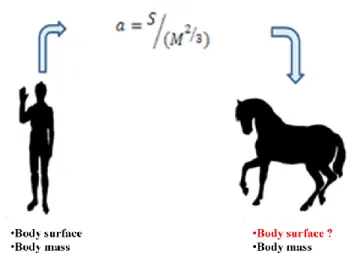
13 The accuracy of “b” is limited by statistic variation in populations. The passages to evaluate “a” are more complex and require a well known allometric relation that characterizes the correlation between feature of interest and body mass of a mammal. The unknown parameter in this equation has to be “a”. Once the proportional parameter is evaluated it is possible to solve the equation that describes the correlation between body mass and a feature of interest for a different mammal [18]. Figure 2.2 represents an example of an algorithm that permits the estimation of “a” in order to evaluate the correlation between body mass and body surface area. Lot of studies analyze body surface area of a standard adult human. The following allometric equation correlates body surface to body mass as described previously (equation 1):
(2)
Once human body surface and body mass are known, “a” can be estimated using the reverse formula. Then it is possible to estimate body surface of a different mammals, such as a horse, as it is described in figure 2.2.
Figure 2.2 Algorithm that permits the correlation between body mass of a horse and its body surface area once “a” using known body mass and surface area
14 As described Allometry permits the estimation of features using correlation with body mass evaluated for different mammals. The advantages that derive from this approach are the possibilities to study features of an animal and then extrapolate correlations valid for other mammals limiting the case of analysis. Moreover it is possible to define theoretical body mass of an “ideal animal” in order to estimate correlation with real features. The last consideration summarizes the approach that can be used in order to evaluate a feature that should be simulated by bioreactors in order to establish a meaningful in-vitro model. The idea is to evaluate body mass of the equivalent human simulated by a bioreactor and then extrapolate features using well known allometric equations and parameters that describe correlation between features and body mass of a real standard human.
2.3 Allometry and bioreactors
Allometry is a useful method that can be used in the chamber design phase or during experimental set up on in-vitro models. The target is the same: increase the meaningfulness of an in-vitro model. There are several approaches that can be followed in order to estimate correlation between physiology and in-vitro models. Two models are going to be presented. A first model is based on surface ratio between hepatic and lung epithelial tissue. This first model is called “Surface scaling model (SSM)” [19]. Another allometric approach that can be used to study cross talk between vascular endothelial tissue and liver is based on cells numbers. A second model that takes care of cells number ratio between liver and endothelial tissue is presented. This second model is called “Cell number scaling model (CNSM)” [19]. Differences between the philosophy that should influence the choice between these systems will be discussed. Algorithms to evaluate body mass of a virtual human simulated by a bioreactor will be described in next paragraph. ILT0 bioreactor is the starting point in order to simulate hepatic tissue.
2.1.1 Surface scaling model (SSM)
The liver is responsible for the uptake, conversion and distribution of many of the nutrients entering the digestive tract and is also the main orchestrator of exogenous metabolism while lung represents an important physiological barrier that permits an exchange of gas.
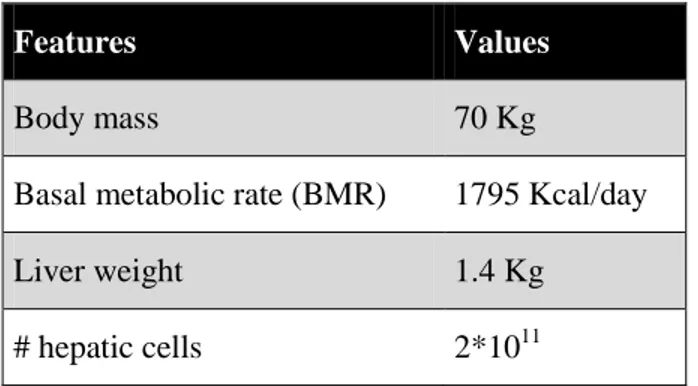
15 We therefore begin by connecting hepatocytes with epithelial lung cells before adding other cells or tissues to construct an in-vitro model of gas exchange and biotransformation. Biotransformation is a metabolic process and depends on the metabolic efficiency of cells, whereas distribution is a surface mediated process. Therefore the hepatocytes in the model are scaled with reference to basal metabolism whereas the endothelium is scaled using the surface area of the human lung as a starting point. As cells are usually plated in monolayers, the allometric design process begins by considering the metabolism of a two dimensional culture of human hepatocytes in a single bioreactor module as described in Mazzei et al [10]. Hepatocytes can be seeded on the bottom surface of the chamber, which has a diameter of 13 mm , identical to that of a 24 plate well. Standard parameters used to establish the experimental set-up in the SSM through allometric scaling are summarized in table 2.1.
Features Values
Body mass 70 Kg
Basal metabolic rate (BMR) 1795 Kcal/day
Liver weight 1.4 Kg
# hepatic cells 2*1011
Table 2.1. Features about a standard 20 years old male are summarized
The surface area of the cell culture zone per well of a ILT0 is 1.33 cm2, so it is possible to estimate the number of hepatocytes which can be seeded in a monolayer. A confluent layer of hepatocytes has a density of about 2.105 cells/cm2 [20] which corresponds to 2.6.105 cells. BMR of a standard man can be evaluated with equation (3)
(3)
The liver generates 27% of the total BMR of a human, corresponding to 23.76 J/s. Then, assuming the total metabolic contribution of the liver is due only to hepatocytes, the BMR per human hepatocyte is 119 pJ/s, while the equivalent BMR of the liver simulated with ILT0 is 30 μJ/s.
16 Despite being a metabolic organ, liver mass scales with an exponent of b~1. The explanation usually given for this is that small organisms have a larger number of metabolic organelles (mitochondria) per cell (b for the number of mitochondria per cell is 4/3). Then the total BMR of the connected culture system is 111 μJ/s.
Allometric equations can be used in order to find equivalent body mass of (WILT0) of a ILT0 connected culture system. Equations (4) and (5) summarize the steps required to estimate WILT0
(4)
(5)
WILT0 in this case is 1 mg. Note that this value depends very much on the number of hepatocytes employed. WILT0 can be up to 5 mg in 3 dimensional scaffolds or tissue slices. Having established this parameter, the allometric approach can be used in order to find a suitable surface area to simulate the lung epithelial exchange area. The allometric equation that links vascular surface area (S) to body mass (W) of a mammal is (6):
(6)
Given that lung epithelia surface of a standard man in resting conditions is 80 m2 [21], it is possible to estimate the constant “a” from equation (7) and then find a suitable surface area to simulate the endothelium in an in-vitro experiment
(7)
Surface of a chamber that simulate endothelial should be 5.5 cm2. This represents an useful specification if a new chamber has to be designed and realized. However sometimes it is convenient to find a correlation that permits the use of standard bioreactors as it could be ILT0, avoiding the necessity to design new devices each time that a new model is established.. The surface of a chamber that represents the lung epithelium should be 5.5
17 cm2. This is about 4 times of the cell culture area of an ILT0 module. Thus if 1 chamber is used to simulate the liver, about 4 modules have to be used to represent the lung. Therefore in order to respect the SSM, 4 lung chambers and 1 hepatocyte chamber are required. Note that the relationship is not linear due to the scaling laws used.
Similar considerations can be used in order to design bioreactors that simulate physiological tissues and maintain physiological surface area ratio. SSM is then a general model that can simulate different organs as user desires. As said previously this is a suitable solution to describe physiological barriers models. Physiological phenomena that can be simulated by this approach are: nutrient exchange, absorption, transport. Table 2.2 summarizes allometric relations that can be estimated for organs that are involved in some cited phenomena.
Physiological phenomena Simulated organs Surface area ratio(r SSM)
Biotransformation Liver 1
Gas exchange Lung, Liver 4 (lung) : 1 (liver) Nutrient absorption Intestine, Liver 9 (intestine) : 1 (liver)
Nutrient transport
Endothelial tissues, Liver
1 (endothelial tissue) : 4 (liver)
Air dispersed Particles
Absorption Skin, Liver 1 (skin) : 12 (liver)
Table 2.2 Physiological phenomena and organs that can be simulated by an allometric SSM [18]
As described in paragraph 2.3 SSM is based on allometric ratio between surfaces. The surface area of exchange is not always the relevant parameter that has to be used in order to simulate a specific physiological function. In particular functions that are related to BMR control are not linked to organ surface area. In order to evaluate physiological parameters to solve allometric equation organs are simulated as 2D cultures. As reported in the introduction organs are organized as 3D hierarchical structures. As can be argued a 2D model is uncorrelated to physiology if the target is to simulate a function that is strictly influenced by 3D structure. In conclusion it is necessary to find a new parameter that has to
18 be simulated with allometric equations. New parameters have to account for the 3D organ dimensions. An example could be represented by volume. The problem is that 2 different organs could have the same volume, but they could influence BMR differently. Volume is therefore an uncorrelated parameter to physiological functions. BMR is correlated to the number of cells that cooperate to produce basal energy that is consumed by body organs. Then cell number of organs is a suitable parameter that can be correlated to BMR control. As can be argued the problem is to find a significant physiological cell number estimation. In next paragraph a model called “Cell number scaling model (CNSM)” and based on cell number ratios is described. In following paragraph CNSM is used to analyze cross talk between hepatic and endothelial tissues.
2.1.2 Cell number scaling model (CNSM)
Metabolic rate is proportional to mitochondrial activity, then to cell number. The allometric model described in this paragraph is based therefore on cell number ratio between organs. Cell number scaling model (CNSM) proposed as alternative to SSM takes care of the ratio between the number of endothelial cells and hepatocytes in the abdomen. It is assumed that differences between organ weights is correlated to differences in cell number. This consideration means that “b” parameter in the allometric equation is ~1. Evaluating the ratio between weights of organs it is therefore possible find correlations between cell numbers. The human body is well studied: percentage relations between body region mass are well characterized in the literature. Vascular endothelial tissue represents 6.28% of human body mass. It has to be underlined that endothelial tissue percentage is correlated with entire body and not only to abdomen district. Liver weight is instead equal to 2% of human body mass [22]. Assuming that abdomen weight represents 3.08% of body mass [22], and that vascular density is the same in all the body, it is possible to evaluate abdomen vascular tissue weight using the following equation (8): (8)
Liver weight is directly evaluated by its weight contribution to body mass (2%). Assuming that hepatocytes represent the main percentage of liver mass, the following equation
19 permits calculation of the ratio (r CNSM) between abdomen endothelial weight and hepatic tissue weight (equation 9):
(9)
“r CNSM” represents the physiological ratio between endothelial and hepatic weight. It can be argued that evaluation of cell number is not a passage directly involved in bioreactor design. Extrapolating geometrical specifications from a CNSM output is not a trivial passage. Cell behaviour in-vitro is not the same as that in vivo conditions. Let us assume that the surface area to design a new bioreactor is required. The cell number approach is directly correlated to in-vitro experiments design. It represents a key point in order to decide the number of cells that has to be seeded in each bioreactor. If for example the target is to evaluate cell numbers that permit the establishment of a relevant in-vitro model that describes cross talk between liver and endothelial according to CNSM hepatocytes have to be 10 times the number of endothelial cells. As said in paragraph 2.3.1, 2.6 *105 hepatocytes are necessary in order to have a monolayer at confluent condition, so endothelial cells are ~ 104. While the SSM focuses attention on transport phenomena in a cross talk in-vitro model with endothelial and hepatic tissues, in contrast the CNSM points out the nutrient absorption and biotransformation phases. In theory the proposed models could be used together in order to improve the meaningfulness of an in-vitro models. In practice it is almost impossible to respect all specifications that can be estimated by allometric models. It has to be underlined that confluence condition is strictly correlated to geometrical dimension of the support device. The bigger the membrane, the more cells are required to create tight junctions. The Allometry approach that estimates cell number is not associated to device specifications. In fact these is some conflict between specifications from allometric models and the necessity to limit dimensions and device. Volumes of this conflict is responsible for unfeasibility of in-vitro models. Consequently it has to be decided which is physiological function has to be simulated by in-vitro model and then which is the suitable allometric approach that has to be followed. In the next paragraph an example of an in-vitro model is proposed in order to better explain the implications in making the choice between different allometric approaches.
20
2.4 Gastro intestinal in-vitro model
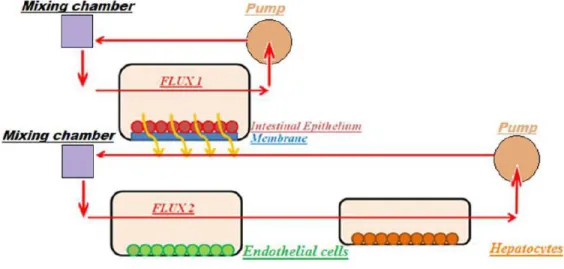
In this paragraph an example of an in-vitro model is presented. The target of the system is simulation of nutrient or nano particle absorption and transport by the human gastro-intestinal tract. Analyzed organs are: gastro-intestinal epithelial, vascular endothelial and liver. The first tissue represents a physiological barrier that target solutes have to cross. Intestinal epithelial cells are cultivated on a membrane and confluence conditions are required in order to mimic physiological functions. Vascular endothelia represents a transport tissue that allows solutes to reach the liver, where they are processed. Based on these considerations the in-vitro model presents a first bioreactor where a membrane is placed. It is possible to seed intestinal cells on the porous surface of the filter, in order to simulate a physiological barrier. Endothelial cells and hepatocytes are cultivated in a pair of bioreactors joined in series. An overview of the system permits an identification of two independent fluidic circuits. The cross talk between intestinal epithelia and endothelial cells is through the membrane placed in the first bioreactor. Figure 2.3 shows a scheme of the described model.
Figure 2.3 In-vitro model to study the human gastro-intestinal tract
Figure 2.3 shows two different fluidic circuits (red arrows). Each circuit is provided a mixing chamber, representing medium reservoir and a peristaltic pump that imposes
21 medium flow. Yellow arrows represent solute absorption by intestinal epithelia and passage through the cellular barrier. The description of bioreactors used to establish the model is target of the next chapter. To begin we suppose that there are no limitations in the design in order, other than obeying allometric scaling laws. Once the structure of the model is decided, specifications about correlation between in-vitro system and physiology have to be extrapolated. As described previously allometric approach is an useful method that helps during the experiment design phase. Both theoretical models presented in previous paragraphs can be applied. As mentioned, the results of the CSSM value will be different from that of SSM, so the decision about which one is the best solution to study the GI tract is a key point. It has to be underlined that the difference between results has to be correlated to the scope of the experiment. In case of the SSM, the attention is focused on the solute exchange between tissues. On the other hand the CNSM emphasises the solute absorption and degradation by liver, in order to produce products that are typical of human metabolism. Of course decision about target that has to be studied influences the methods of analysis. In particular the SSM requires samples of medium that has to be taken following a time table, in order to characterize exchange solutes kinetic between tissues. On the other hand the CNSM requires a study of the liver products that will be diluted in medium solution. The next paragraph describes procedure that validates the hypothesis about the better correlation between the CNSM and BMR than the SSM.
2.1.3 CNSM versus SSM: experimental validation
It has to be assumed that intestinal epithelia has fixed in-vitro parameters of confluence conditions in correlation to membrane geometry. Attention is then focused only on endothelial and liver cross talk. Applying the SSM procedure to physiological parameters it is possible to evaluate the surface area that is required in order to simulate tissues. The in-vitro model based on the SSM method requires 4 bioreactors to simulate the liver and 1 to mimic endothelial tissue, as is summarized in table 2.2. All modules have to be joined in series. An accurate description of the procedures to establish a fluidic circuit can be found in [Appendix A, B]. Following the CNSM method presented in paragraph 2.3.2 it is also possible evaluate cell numbers that have to be seeded in the bioreactors. Specifications presented in paragraph 2.3.2 highlight that the ratio between endothelial cells number and
22 hepatocytes has to be 0.1. An experimental protocol described in [19] was established in order to compare two in-vitro models results based on theoretical models described in previous paragraphs. 5 different ILT0 were connected in series. The total volume of common medium used to fill the circuit was 15 ml. The flow rate was set at 250 µl/min, in order to maintain shear stress in an acceptable range for hepatocytes, the most sensitive cells, as described in Mazzei et al. [10]. The bioreactors were placed inside a 37°C/5% CO2 incubator for 72 h. After incubation, cell viability and cytochrome activity were analyzed . Medium was collected and stored at –80°C for metabolite dosing. Each test was reproduced at least three times. The following graphs show some of the results obtained. As generally accepted the gold standard is represented by Petri dish cell culture in static conditions and characterized by the same common medium volume as the dynamic tests. Experimental results were compared with the static condition in order to evaluate the meaningfulness of values obtained. Figure 2.4 represents triglyceride uptake in cell cultures. This test is correlated to metabolism of that particular tissue: the higher the uptake, the higher is metabolism and then more active are cells. As can be seen by figure 2.4 the triglyceride uptake is higher in CNMS despite the fact that total cell number used is smaller than SSM cells number. This data highlights the higher cell activity rate in the CNMS, a parameter that is correlated to their metabolism.
23
Figure 2.4 triglyceride uptake evaluated in SSM and compared to CNMS
In order to control the meaningfulness of the previous data, a control on glucose consumed rate was performed. Figure 2.5 summarizes data that can be extrapolated from this analysis. The results highlight that glucose consumption rate does not have significant differences between models. It means that the changes recorded in triglyceride uptake test are correlated to cell metabolism that increases if cells are more active.
0 0.2 0.4 0.6 0.8 1 1.2 SSM CNMS µM
Triglyceride uptake
Petri dynamic24
Figure 2.5 Glucose consumed rate of SSM compared to CNMS one
Analyzing figures 2.4 and 2.5 we can conclude that dynamic conditions promote higher cells metabolism than static conditions, as was expected [20]. These data highlight a better correlation between physiological metabolism the CNMS than in the SSM, as hypothesised previously. This is an example of how different methods permit a better correlation between data and physiology. It represents a typical situation where it is not possible to apply different allometric models at the same time, because of experimental constants. This consideration highlights the importance of deciding which is the physiological function that has to be modelled and apply Allometry accordingly.
0 0.05 0.1 0.15 0.2 0.25 0.3 SMSM CNSM m g/ m L/c o ve rsl ip
![Table 2.2 Physiological phenomena and organs that can be simulated by an allometric SSM [18]](https://thumb-eu.123doks.com/thumbv2/123dokorg/7574324.111917/8.774.107.672.467.680/table-physiological-phenomena-organs-simulated-allometric-ssm.webp)