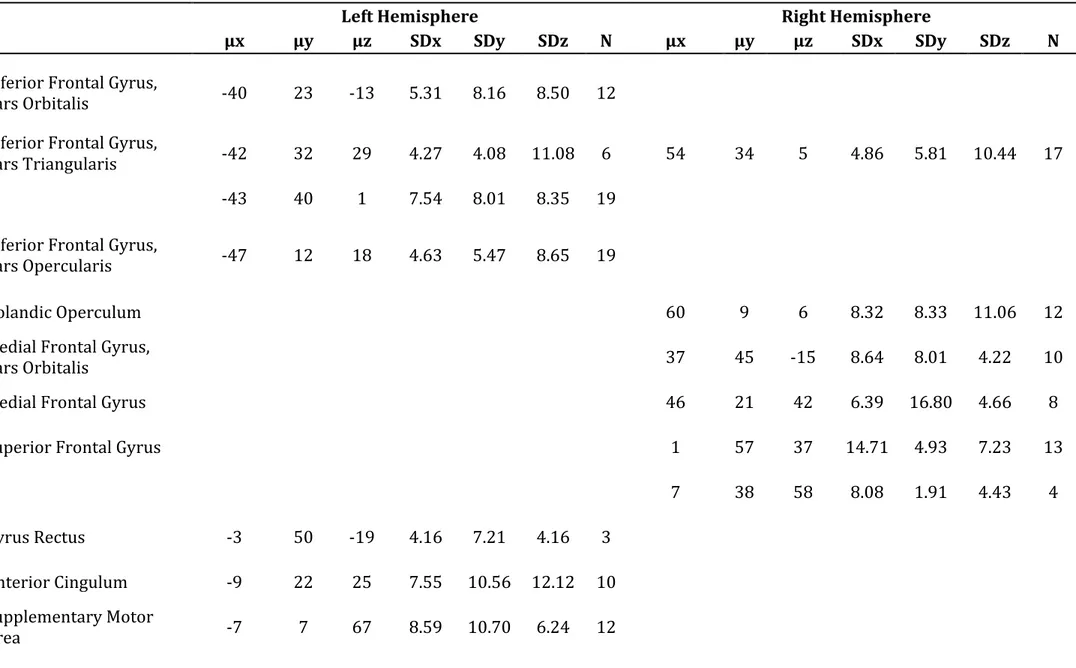
Table S2 | Results of CluB with User’s Spatial Criterion set to 8 mm. For each cluster, the mean centroid coordinates in MNI stereotaxic space, the standard deviation along the three axes and the cardinality (N) are reported.
Left Hemisphere Right Hemisphere
μx μy μz SDx SDy SDz N μx μy μz SDx SDy SDz N
Inferior Frontal Gyrus, pars Orbitalis -40 23 -13 5.31 8.16 8.50 12 Inferior Frontal Gyrus, pars Triangularis -42 32 29 4.27 4.08 11.08 6 54 34 5 4.86 5.81 10.44 17 -43 40 1 7.54 8.01 8.35 19 Inferior Frontal Gyrus, pars Opercularis -47 12 18 4.63 5.47 8.65 19 Rolandic Operculum 60 9 6 8.32 8.33 11.06 12 Medial Frontal Gyrus, pars Orbitalis 37 45 -15 8.64 8.01 4.22 10 Medial Frontal Gyrus 46 21 42 6.39 16.80 4.66 8 Superior Frontal Gyrus 1 57 37 14.71 4.93 7.23 13 7 38 58 8.08 1.91 4.43 4 Gyrus Rectus -3 50 -19 4.16 7.21 4.16 3 Anterior Cingulum -9 22 25 7.55 10.56 12.12 10 Supplementary Motor Area -7 7 67 8.59 10.70 6.24 12
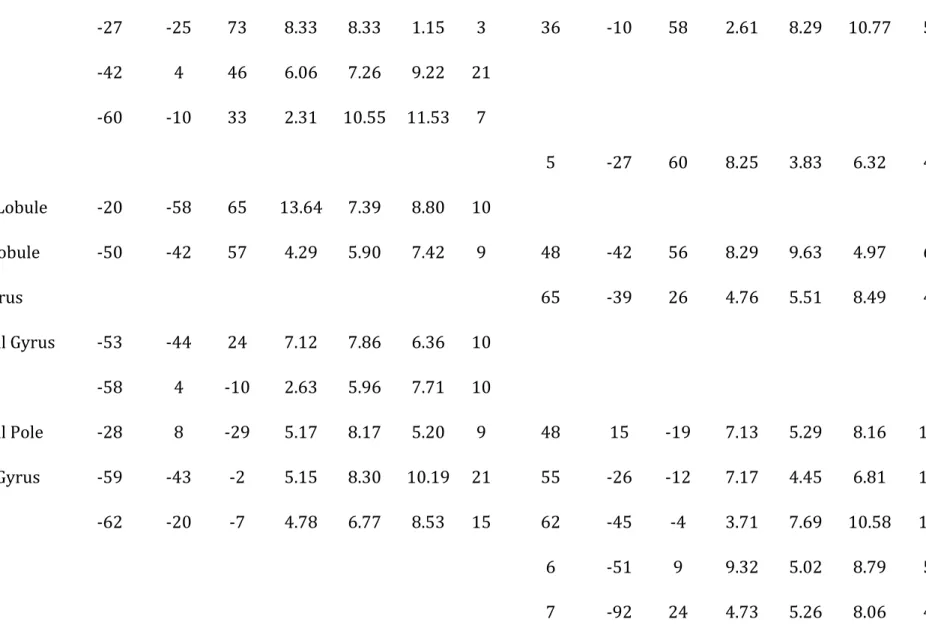
Table S2 | Results of CluB with User’s Spatial Criterion set to 8 mm. For each cluster, the mean centroid coordinates in MNI stereotaxic space, the standard deviation along the three axes and the cardinality (N) are reported. Precentral Gyrus -27 -25 73 8.33 8.33 1.15 3 36 -10 58 2.61 8.29 10.77 5 -42 4 46 6.06 7.26 9.22 21 Postcentral Gyrus -60 -10 33 2.31 10.55 11.53 7 Postcentral Lobe 5 -27 60 8.25 3.83 6.32 4 Superior Parietal Lobule -20 -58 65 13.64 7.39 8.80 10 Inferior Parietal Lobule -50 -42 57 4.29 5.90 7.42 9 48 -42 56 8.29 9.63 4.97 6 Supramarginal Gyrus 65 -39 26 4.76 5.51 8.49 4 Superior Temporal Gyrus -53 -44 24 7.12 7.86 6.36 10 -58 4 -10 2.63 5.96 7.71 10 Superior Temporal Pole -28 8 -29 5.17 8.17 5.20 9 48 15 -19 7.13 5.29 8.16 12 Medial Temporal Gyrus -59 -43 -2 5.15 8.30 10.19 21 55 -26 -12 7.17 4.45 6.81 14 -62 -20 -7 4.78 6.77 8.53 15 62 -45 -4 3.71 7.69 10.58 16 Precuneus 6 -51 9 9.32 5.02 8.79 5 Cuneus 7 -92 24 4.73 5.26 8.06 4
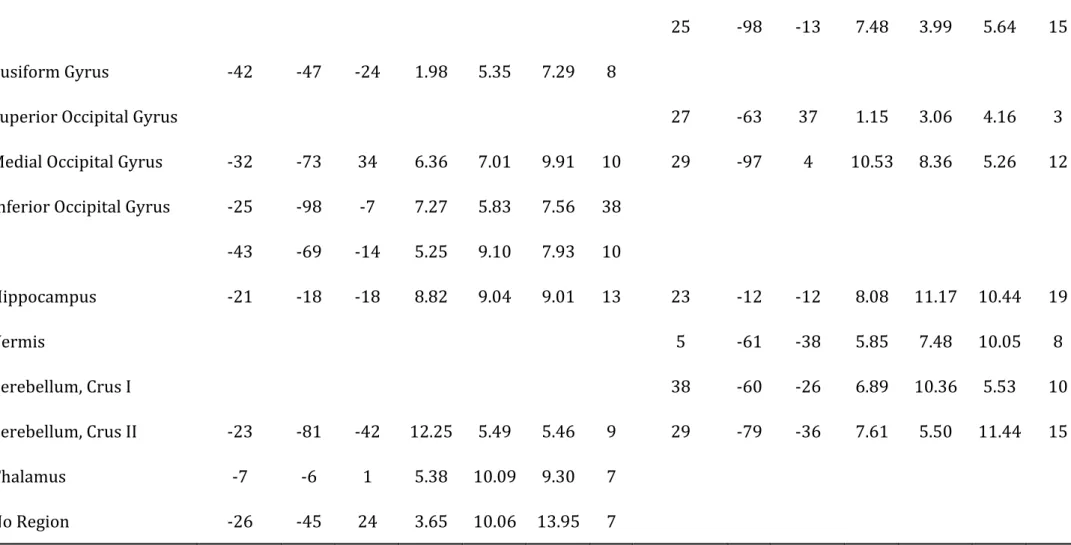
Table S2 | Results of CluB with User’s Spatial Criterion set to 8 mm. For each cluster, the mean centroid coordinates in MNI stereotaxic space, the standard deviation along the three axes and the cardinality (N) are reported. Lingual Gyrus 10 -76 -10 7.27 9.50 6.20 6 25 -98 -13 7.48 3.99 5.64 15 Fusiform Gyrus -42 -47 -24 1.98 5.35 7.29 8 Superior Occipital Gyrus 27 -63 37 1.15 3.06 4.16 3 Medial Occipital Gyrus -32 -73 34 6.36 7.01 9.91 10 29 -97 4 10.53 8.36 5.26 12 Inferior Occipital Gyrus -25 -98 -7 7.27 5.83 7.56 38 -43 -69 -14 5.25 9.10 7.93 10 Hippocampus -21 -18 -18 8.82 9.04 9.01 13 23 -12 -12 8.08 11.17 10.44 19 Vermis 5 -61 -38 5.85 7.48 10.05 8 Cerebellum, Crus I 38 -60 -26 6.89 10.36 5.53 10 Cerebellum, Crus II -23 -81 -42 12.25 5.49 5.46 9 29 -79 -36 7.61 5.50 11.44 15 Thalamus -7 -6 1 5.38 10.09 9.30 7 No Region -26 -45 24 3.65 10.06 13.95 7