189
Chapter 7
7. Application of the Composed Utility Function
Ψ
Ψ
Ψ
Ψp
7.1. Introduction
Nowadays, one of the main tasks of energy engineers is to understand the best strategy between the promotion of efficiency increase and the introduction of pollutant emissions control in the energy systems. In order to define this goal it is necessary to understand, which are the acceptable energy conversion efficiencies and pollutant control targets, as well as the optimal size of the plants. Different solutions may be pursued for the pollutant emissions control as increasing efficiencies due to the introduction of gas turbine cycles, or in the case of emission capture technologies; to decide between integrated or end-of-the-pipe equipments.
The use of the Ψp function, proposed in Chapter 6, permits to obtain the optimum design of each single system under consideration, in the same way as described for the Brayton cycle power plant in the section 6.3. But also, the Ψp function can be used as a synthetic indicator for the comparison of different energy conversion systems. The comparison analysis aims to clarify which energy conversion system is more efficient,
190
namely, which technology makes a better use of the resources. Furthermore, when introducing a CO2 capture, it can be also seen which are the different effects produced
on the thermodynamic performances of the systems.
For this purpose, in this chapter a comparison among different fossil fuel power plants is carried out. The idea is to compare a coal-fired advanced power plant with a natural gas based cogeneration system that is, at present, the best fossil fuel technology, since it performs the better use of the resources with the minimum among of emissions and less costs.
To begin with, a thermodynamic definition of the two analyzed power plants is shown. Then, the analysis by mean of the synthetic indicator Ψp of the plants and two
parametric studies are outlined.
7.2. Conventional steam power plant
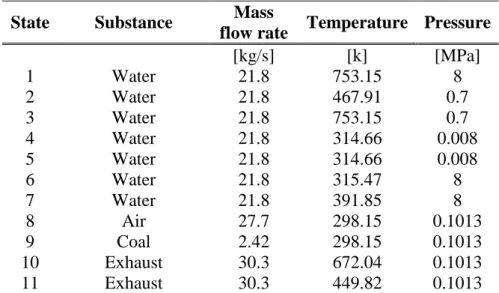
Chosen as a base of comparison is considered a conventional pulverized coal combustion steam power plant described by Munoz and Michaelides1. The operating
conditions of this plant, mass flow rates, temperatures and pressures as well as other important details of its operation are give in table 7.1. The plant outlay is shown in figure 7.1, where are also displayed the exhaust gases composition, the reference state and the fuel type used.
This conventional steam power plant has a thermal efficiency of 41.8%, bases on the LHV of the coal. The coal feedstock mass flow rate is 2.42 kg/s, yielding a plant net power output of 30 MW.
It should be noted that the lower heating vale of coal has been taken as the chemical exergy of the fuel, which is 29.61 MJ/kg1.
191 State Substance Mass
flow rate Temperature Pressure
[kg/s] [k] [MPa] 1 Water 21.8 753.15 8 2 Water 21.8 467.91 0.7 3 Water 21.8 753.15 0.7 4 Water 21.8 314.66 0.008 5 Water 21.8 314.66 0.008 6 Water 21.8 315.47 8 7 Water 21.8 391.85 8 8 Air 27.7 298.15 0.1013 9 Coal 2.42 298.15 0.1013 10 Exhaust 30.3 672.04 0.1013 11 Exhaust 30.3 449.82 0.1013
Table 7.1: Operating conditions of the 30 MW coal-fired plant
10 T T 30 MW Cond. 4 1 2 3 8 9 B 7 11 6 5 P Econ. T T 30 MW Cond. 4 1 2 3 8 9 B 7 11 6 5 P Econ. [8] Air: 77.48 N2, 20.59 O2, 0.03 CO2, 1.90 H20 (g) [9] Coal: 72 C, 4.4 H, 4.6 S, 3.6 O, 8 H2O, 9 ash [11] Exhaust: 74.40 N2, 3.30 O2, 14.07 CO2, 8.11 H20. 0.12 SO2
192
7.3. Natural Gas cogeneration power plant
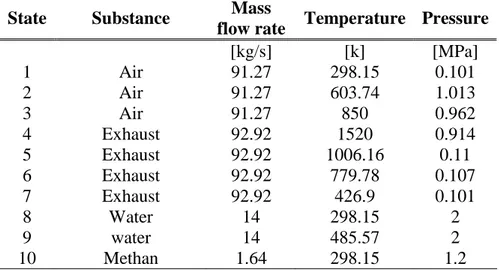
The natural gas cogeneration power plant described by Bejan et al.2 has been chose as
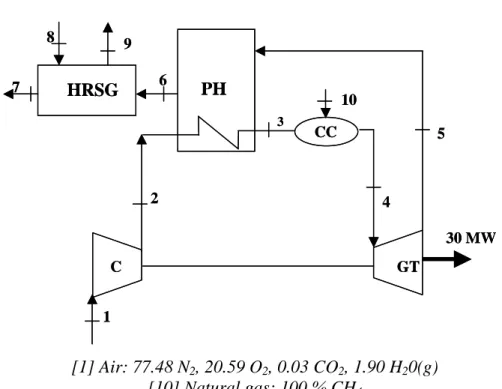
a reference for the outlay of a combined cycle power plant. The operating conditions of this plant, mass flow rates, temperatures and pressures as well as other important details of its operation are give in table 7.2. The plant outlay is shown in figure 7.2, where are also displayed the exhaust gases composition, the reference state and the fuel type used.
This cogeneration power plant has a first law efficiency of 35.5%, bases on the LHV of the gas, and a second law efficiency of 50.7%. The mass flow rate of the natural gas feedstock is 1.64 kg/s, yielding a plant net power output of 30 MW.
State Substance Mass
flow rate Temperature Pressure
[kg/s] [k] [MPa] 1 Air 91.27 298.15 0.101 2 Air 91.27 603.74 1.013 3 Air 91.27 850 0.962 4 Exhaust 92.92 1520 0.914 5 Exhaust 92.92 1006.16 0.11 6 Exhaust 92.92 779.78 0.107 7 Exhaust 92.92 426.9 0.101 8 Water 14 298.15 2 9 water 14 485.57 2 10 Methan 1.64 298.15 1.2
193 PH HRSG 8 9 7 6 5 30 MW GT C CC 10 4 1 2 3 PH HRSG 8 9 7 6 5 30 MW GT C CC 10 4 1 2 3 [1] Air: 77.48 N2, 20.59 O2, 0.03 CO2, 1.90 H20(g) [10] Natural gas: 100 % CH4 [7] Exhaust: 75.07 N2, 13.72 O2, 3.14 CO2, 8.07 H20
Figure 7.2: Schematic diagram of the 30 MW natural gas cogeneration power plant
7.4. Application of the composed utility function
Ψ
Ψ
Ψ
Ψ
p as a synthetic
indicator
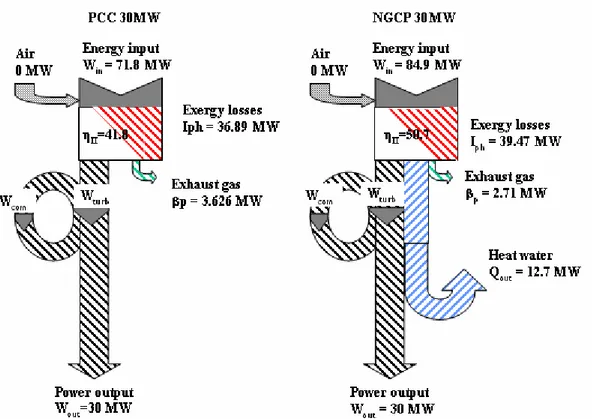
In this section is given an application of the Ψp function, defines in chapter 6, used as a synthetic indicator for the comparison of energy production systems. The systems used as reference, are the natural gas cogeneration power plant, and the coal-fired power plant described before. Figure 7.3 illustrates the Sankey-diagram for these two plants, where are represented the different coefficients of the functionΨp.
Moreover, the function Ψp as described in eq. 7.1 is the base used to propose two environmental impact indicatorsfor comparing the different power plants. The ηe is the
environmental indicator displays at the eq. 7.2. The environmental indicator gives a rate among the energy produced by the system and what have been required from the environment in order to produce it. Namely, this indicator points out how have been used the resources together with the emitted “energy” that has to be absorber by the environment.
194
Figure 7.3: Sankey-diagram for analyzing plants
(
I β)
γ W Q W Ψp = out − ph + p − ⋅ in +ε
⋅ out (7.1) in p ph out out e W I Q W ⋅ − + + ⋅ + = ) (γ
η
β
ε
η
(7.2)Furthermore, other proposed indicator is the sacrifice index displays in eq. 7.3. This indicator is planned in order to estimate how much the environment pays to produce a unit energy output.
(7.3)
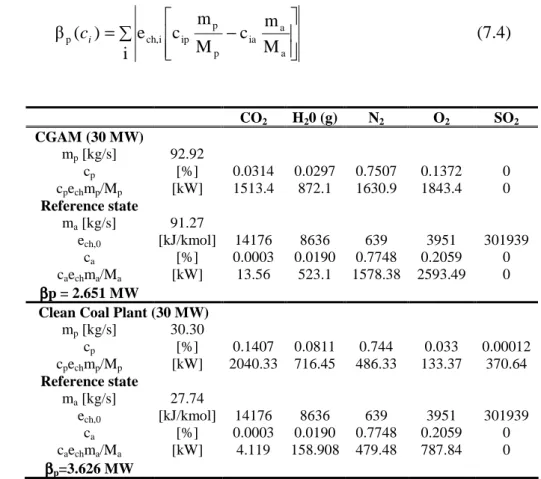
Where the coefficient ε is defined as the rate among the heat and its associated exergy. The pollutant emission factor βp is calculated as explained in chapter 6, see eq. 7.4.
out out in p ph out out p Q W W I Q W P + ⋅ ⋅ − − − ⋅ + = Ψ ε γ β ε
195
The evaluation of the βp for the two power plants describe above is shown in the table 7.3. ∑ − = i M m c M m c e ) ( β a a ia p p ip i ch, p ci (7.4) CO2 H20 (g) N2 O2 SO2 CGAM (30 MW) mp [kg/s] 92.92 cp [%] 0.0314 0.0297 0.7507 0.1372 0 cpechmp/Mp [kW] 1513.4 872.1 1630.9 1843.4 0 Reference state ma [kg/s] 91.27 ech,0 [kJ/kmol] 14176 8636 639 3951 301939 ca [%] 0.0003 0.0190 0.7748 0.2059 0 caechma/Ma [kW] 13.56 523.1 1578.38 2593.49 0 ββββp = 2.651 MW
Clean Coal Plant (30 MW) mp [kg/s] 30.30 cp [%] 0.1407 0.0811 0.744 0.033 0.00012 cpechmp/Mp [kW] 2040.33 716.45 486.33 133.37 370.64 Reference state ma [kg/s] 27.74 ech,0 [kJ/kmol] 14176 8636 639 3951 301939 ca [%] 0.0003 0.0190 0.7748 0.2059 0 caechma/Ma [kW] 4.119 158.908 479.48 787.84 0 ββββp=3.626 MW
Table 7.3: Data for the calculation of the
β
p coefficientAccording to the data reported in Table7.3, the pollutant emission factor βp assumes the value βp = 2.65 MW, for the NGCG power plant, and βp = 3.626 MW for the coal-fired power plant. These values are relatively higher than the chemical exergy of its respective exhaust gases with the concentrations as exposed above; where ech = 0.3665
MW for the NGCG power plant and ech = 1.6 MW at the outlet of the coal-fired plant2.
But still, are not big enough to be compared with the exergy losses term I, since the exhaust gases are rather clean for both power plants. In the two cases a complete combustion is carried out, where there is no trace of any uncombusted substances as CH4 or CO. These substances hold a high standard molar chemical exergy, as
196
displayed in table 6.2. However further consideration bout the evaluation of the pollutant emission factor are detailed in section 7.5.2.
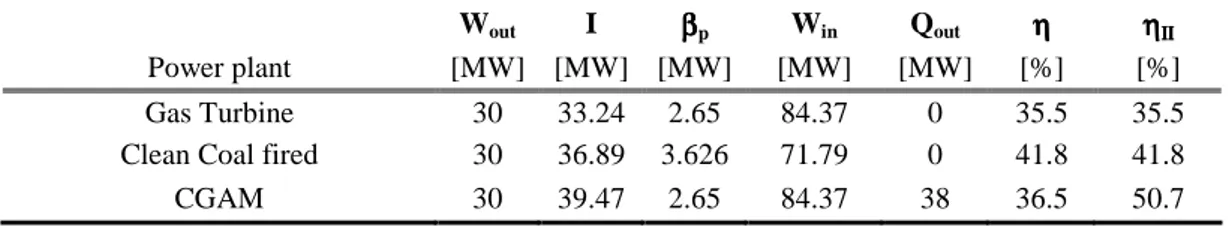
Table 7.4 provides all the terms included in the eq. 7.1, considering the two configurations described before, adding a gas turbine system with the same configuration of CGAM plant defined by Bejan2.
Wout I ββββp Win Qout ηηηη ηηηηΙΙΙΙΙΙΙΙ
Power plant [MW] [MW] [MW] [MW] [MW] [%] [%] Gas Turbine 30 33.24 2.65 84.37 0 35.5 35.5 Clean Coal fired 30 36.89 3.626 71.79 0 41.8 41.8 CGAM 30 39.47 2.65 84.37 38 36.5 50.7
Table 7.4: Values of the terms of the utility function
Ψ
pTable 7.5 presents the results of the evaluation of the synthetic indicators Ψ and Ψp, of
the environmental coefficient ηe, defined in eq. 7.2, and of the sacrifice index describe
in eq. 7.3. The results show that as expected the natural gas cogeneration plant is the best option, since it uses in the most efficient way the resources. According to the environmental coefficient it has the bigger value, that is, it requires less “environment” that the others technologies, where environment here means either the function of the environment as a sink as well as the resource consumption. On the other hand, the sacrifice index of the NGCG power plant reaches the lower value, which means that the environment has paid less to produce a unit energy output.
NGCG 30MW Gas Turbine 30MW PCC 30MW γγγγ 0.5 0.5 0.45 εεεε 0.33 - - Ψ -39.11 -45.42 -38.69 Ψp -41,76 -48.07 -42.32 │Ψp/Wout│ 0.98 1.6 1.4 ηηηηe 0.795 0.623 0.699
197
Moreover, as outline in the table 7.5, the introduction of the term βp does not determine a sensible difference between the absolute value assumed by the functions
Ψp and Ψ, even if the difference can be quite remarkable when exhausts are particularly “dirty”. Anyway, we must remember that a part of the environmental damage was already included in the degraded energy, I. In this sense, pollutant emission control could become the opportunity for the promotion of high efficiency design of conventional plants and the dissemination of advanced technologies that have difficulties to compete in the energy market. Under this point of view method of emission control, like CO2 capture, appears to be very questionable. The analysis
summarized in Table 7.5 evidences that if the operating parameter of the coal plant reach well defined targets, (obviously it is not necessary to reach the level of the gas turbine systems), the perspective defined by the Ψ function indicate that coal technologies can be competitive with a natural gas based technology. This occurs if and only if well-defined objectives in term of efficiency and pollutant emissions are satisfied, converting coal with a high efficiency and with not so high pollutant emission. This example is important in order to show that if thermodynamic, environmental and economic dimensions of the power plant are interrelated, by taking into account the input data, (resource used), the power output (product) and the environmental impacts associate to thermal and chemical emissions (like obtained with the Ψp function), it is possible to obtain conclusion, a little bit different from general “commonplace” about “clean” coal technologies. These results demonstrate how a hypothetical “clean” coal-fired technology can be competitive with a natural gas based technology not only from an economic point of view but considering also the thermodynamic and emission performance.
7.5. Parametric studies
An interesting feature of this analysis is to be able to evaluate the energetic effects of introducing into the power system capture technologies in order to mitigate the CO2
198
emissions problem into the energy system analyses. The effects of introducing an end-of-the-pipe CO2 capture devise on the thermodynamic performance of the two plants
are evaluated. Later on, the evaluation of the pollutant emission factor βp with respect to different exhaust gas compositions is carried out.
7.5.1. Evaluation of retrofitting an end-of-the-pipe CO
2capture technology
by means of the synthetic indicator
Ψ
Ψ
Ψ
Ψ
pThe synthetic indicator Ψp is used in order to compare the different effects inflict on
the thermodynamic performance of the two analyzed power plants, when CO2 capture
technologies are implemented.
For this reason, a CO2 chemical absorption capture technology using MEA as solvent
is retrofitted into the plants as an end-of-the-pipe facility. The data for the post combustion technology are the one obtained in chapter 2.
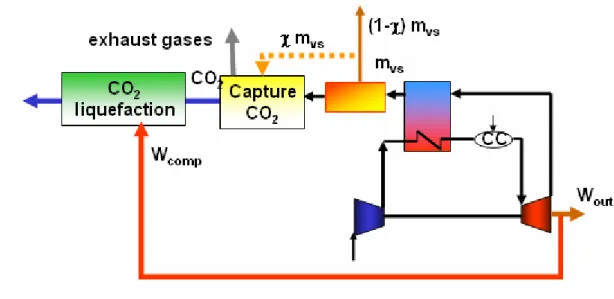
Figure 7.4 shows the natural gas cogeneration power plant with end-of-the-pipe CO2
capture technology. Likewise, it can be also seen the flow diagrams for the steam and energy require by the capture process.
As already studied in chapter 2, the more energy intensive process of the chemical absorption CO2 capture is the sorbent regeneration. The regeneration of the chemical
solvent, MEA, is carried out in the stripper at elevated temperatures, between 80-150ºC and at pressures not very much higher than the atmospheric. Heat is supplied from the reboiler to maintain the regeneration conditions, providing the required desorption heat for removing the chemically bound CO2 and for steam production,
which acts as a stripping gas. As seen in figure 7.4, the steam required for the capture process in the natural gas cogeneration power plant is supplied by the HRSG. Therefore, only the energy required in order to compress the CO2 for its liquefaction
199
Figure 7.4: Natural gas cogeneration power plant with an end-of-the-pipe CO2
capture technology.
χχχχ χχχχms (1-χχχχms) ηηηηII Wout I ββββ Qout Ψ ηe Ψ/Wout
% kg/s kg/s % MW MW MW MW MW - - 0 0 14 0.50 30 41.581 2.6 37.7 -42.2 0.76 -1.40 0.1 0.75 13.2 0.49 29.84 41.58 2.5 35.6 -43.0 0.74 -1.44 0.2 1.50 12.4 0.48 29.68 41.58 2.4 33.6 -43.8 0.73 -1.47 0.3 2.25 11.7 0.4 29.52 41.58 2.2 31.6 -44.6 0.72 -1.51 0.4 3.00 10.9 0.46 29.36 41.58 2.0 29.6 -45.4 0.70 -1.54 0.5 3.76 10.2 0.45 29.20 41.58 1.9 27.5 -46.2 0.69 -1.5 0.6 4.51 9.48 0.44 29.04 41.58 1.7 25.5 -47.0 0.68 -1.60 0.7 5.26 8.73 0.43 28.88 41.58 1.6 23.5 -47.8 0.66 -1.65 0.8 6.01 7.98 0.42 28.72 41.58 1.4 21.5 -48.6 0.65 -1.69 0.9 6.76 7.23 0.41 28.56 41.58 1.2 19.4 -49.4 0.64 -1.73 1 7.51 6.48 0.40 28.40 41.58 1.1 17.4 -50.2 0.62 -1.77
Table 7.6: Results form the natural gas cogeneration power plant with CO2 capture
200
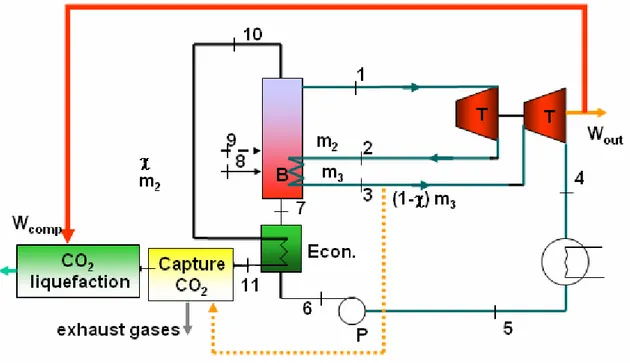
Figure 7.5 shows the coal-fired power plant with an end-of-the-pipe CO2 capture
technology, where the flow diagrams for the steam and energy require by the capture are also displayed.
In this process the steam is supplied by the low pressure steam reducing significantly the electricity output of the system. In addition, the energy required for compressing the CO2 is also subtracted from the electricity output, as seen in table 7.7. These two
energy requirements reduce significantly the power output of the plant.
201
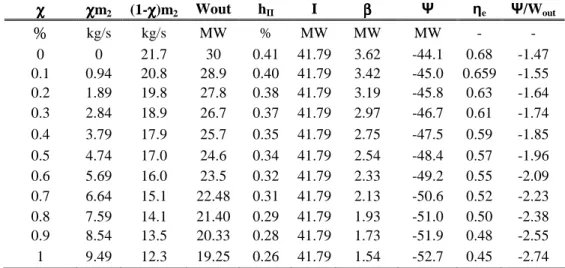
χχχχ χχχχm2 (1-χχχχ)m2 Wout hII I ββββ Ψ ηe Ψ/Wout
% kg/s kg/s MW % MW MW MW - - 0 0 21.7 30 0.41 41.79 3.62 -44.1 0.68 -1.47 0.1 0.94 20.8 28.9 0.40 41.79 3.42 -45.0 0.659 -1.55 0.2 1.89 19.8 27.8 0.38 41.79 3.19 -45.8 0.63 -1.64 0.3 2.84 18.9 26.7 0.37 41.79 2.97 -46.7 0.61 -1.74 0.4 3.79 17.9 25.7 0.35 41.79 2.75 -47.5 0.59 -1.85 0.5 4.74 17.0 24.6 0.34 41.79 2.54 -48.4 0.57 -1.96 0.6 5.69 16.0 23.5 0.32 41.79 2.33 -49.2 0.55 -2.09 0.7 6.64 15.1 22.48 0.31 41.79 2.13 -50.6 0.52 -2.23 0.8 7.59 14.1 21.40 0.29 41.79 1.93 -51.0 0.50 -2.38 0.9 8.54 13.5 20.33 0.28 41.79 1.73 -51.9 0.48 -2.55 1 9.49 12.3 19.25 0.26 41.79 1.54 -52.7 0.45 -2.74
Table 7.7: Results form the coal-fired power plant with CO2 capture technology (
χ
is %of capture CO2 and ms is required kg steam/kg CO2 recovery
While no major technical obstacles exist for retrofitting post-combustion MEA capture in these two plants, the results are very interesting in viewing how the CO2 abatement
produces completely different effects on the cogeneration natural gas plant than on the coal-fired power plant.
Indeed, the results shown at table 7.6 and 7.7 demonstrate that a most significant reduction takes place in the electrical output of the steam turbine. This is due to the diversion of significant amounts of low-pressure steam to the reboiler of the MEA recovery system. Certainly, the low-pressure stage of the steam turbine may need to be rebuilt in order to be able to handle the lower low-pressure steam availability.
A thorough examination of the results in table 7.6 and 7.7 drives at the significant difference among the reduction suffered by the pollutant emission factor and the reduction suffered by the electric output. Indeed, inside the function Ψp the
improvement suffers by the βp due to the CO2 reduction, does not compensate the
reduction in the electric output, due to the energy required for the capture. The term exergy losses, I, remains constant because it has been considered that the capture technology has no exergy losses.
202
This is an interesting finding, since, it indicates that the term given by eq. 7.4, βp, does not represent the minimum work required to eliminate the various pollutants or to re-establish the original concentration. Because for doing that, the energy consumption rates requires for the abatement technologies would be needed.
Moreover, it is indispensable to suggest that the here selected environmental reference state, the atmospheric air, is a very simplified reference. Indeed, the βp values obtain with eq. 7.4 are very low. This is specially complicated by CO2 case. Since, CO2 has a
low chemical exergy and therefore, its differential chemical exergy is very little. The relevant important value of CO2 in this study, being one of the most important
greenhouse gases, claim for more sophisticate reference state. The analysis challenges the assumption of reference states that can introduce also, for instance, the fuels.
7.5.2. Effect on the pollutant emission factor
ββββ
pof the diverse compositions
of the exhaust gases in the evaluation of
the function
Ψ
Ψ
Ψ
Ψ
pIn order to evaluate the pollutant emissions coefficient is needed a detailed knowledge of the exhaust-gases chemical composition and of the combustion process, which represents one of the most difficult tasks into the environmental energy system analysis. This evaluation includes also the difficult of working with a reference state, argument that has been already discussed in the last section.
7.5.2.1 Analysis of the combustion products
The analysis of the pollutant environmental impact has to be based on the research of the different exhaust gas compositions. Mainly the components related to the green house effect as CO2 and CH4, to the incomplete combustions as CO and H2 or to the
acid rain as the NOx and SOx.
All the carbon in the fuel will eventually be transformed to carbon dioxide in the atmosphere. Even if we have incomplete combustion, the CO will be speedily oxidized in the atmosphere. Thus, using fossil fuels will invariably lead t oCO2 production.
203
incomplete combustion, affects the final temperature, which is lower than the adiabatic flame temperature. This can be regulated having rich air combustion and a good mix between the fuel and the air. The high chemical exergy contented in these species is seen not only as a potential of environmental damage but also as an inefficiency use of the resources.
The presence of CO and H2 can also be caused by dissociation effects that take place at
typical combustion temperatures, where the main products of combustion will decompose or dissociate into other species. At this temperature dissociation affects mostly CO2 and H2O, although other species will also be affected at higher
temperatures. This also may be regulated by controlling combustion temperatures. One of the most serious pollutants attributed to combustion sources are nitric oxide (NO) and nitrogen dioxide (NO2), collectively called NOx. Usually, only NO is
emitted, but this will react in the atmosphere to create NO2.
There are three mechanisms by which NO is formed in combustion: the fuel NO, the prompt NO and the thermal NO.
For the fuel and the prompt NO, the formation takes place during combustion where the N2 contain in the fuel or in air, for the prompt formation, will react with the
hydrocarbon radicals like CH or CH3 to form HCN, which then leads almost invariably
to NO. There is no much it can be done to stop the generation of this type of NO. For the thermal mechanism the nitrogen oxides (NOX) emissions are stimulated by the
high temperatures and pressures presented at the combustion chamber. These emissions are produced from the nitrogen content in the air and also by the organic bound nitrogen compound in the fuel, reacting at high temperatures with oxygen in the combustion process. Thermal NO is important only for temperatures higher than about 1800K and is relatively slow compared to combustion reactions. Hence shortening the residence time at high temperatures decreases the final NO emitted. This behavior unfortunately combats the efforts of improving on engine efficiency because conversion of energy at the highest possible temperature level is to be aimed for to reach the optimal efficiencies of combustion processes. However, the NO emitted from
204
coal combustion is controlled by reacting it with a reducing agent, e.g. ammonia, in a variety of techniques explained at chapter 2.
Furthermore, a very harmful pollutant liked to the fossil fuel combustion is the sulphur oxides (SOx). Sulphur oxides emissions are formed due to the combustion of sulphur
contained in the fuels. All of the sulphur will be oxidized in the flame into SOx, being
one of the primary causes of acid rain. The SO2 can be relative easy remove by adding
calcareous sorbent in the combustor operating typically at 750 °C, the technology most widely applied today is the wet scrubbing with lime and limestone, see chapter 2.
7.5.2.2. Sensitive analysis of
ββββ
p in a coal-fired power plantIn this section it is presented a sensitive analysis of the pollutant emission factor βp, in order to understand how sensible is its evaluation inside the Ψp function, shown in eq.
7.1, with respect to the exhaust gases composition. The combustion products of a coal-fired power plant are examined3. Each key pollutant emitted by this energy system is
analyzed, in order to evaluate the βp coefficient.
The environmental coefficient is defined as the sum of the environmental coefficients of the different pollutants.
) ( .... ) ( ) ( ) ( 2 2 1 1 1 n n n i i i p β c β c β c β c β =
∑
= + + + = (7.5)Where xi is the molar concentration of the different pollutants in the exhaust gases.
An analysis of the pollutant emission factor, is illustrate in table 7.10, where different values of the emission factor βp, related to the different pollutant compound concentrations of the exhaust gases, CO2, CO, SO2, NO, and H2 are illustrated. The
coal-based fuel composition and the reference state composition are shown in table 7.8 and 7.9, respectively.
205
Fuel Composition
C H2 O2 S H2O N2
ca [% molar] 0.678 0.247 0.0126 0.0056 0.0503 0.005
Table 7.8: Specific fuel composition for the sensitive analysis of the pollutant emission
factor Reference state CO2 H2O N2 O2 ech [kJ/mol] 14176 8636 639 3951 ca [% molar] 0.03 1.90 77.48 20.59 cia·ech·ma/Ma [kJ/s] 8.2 317.8 958.9 1575.6
Table 7.9: Reference state
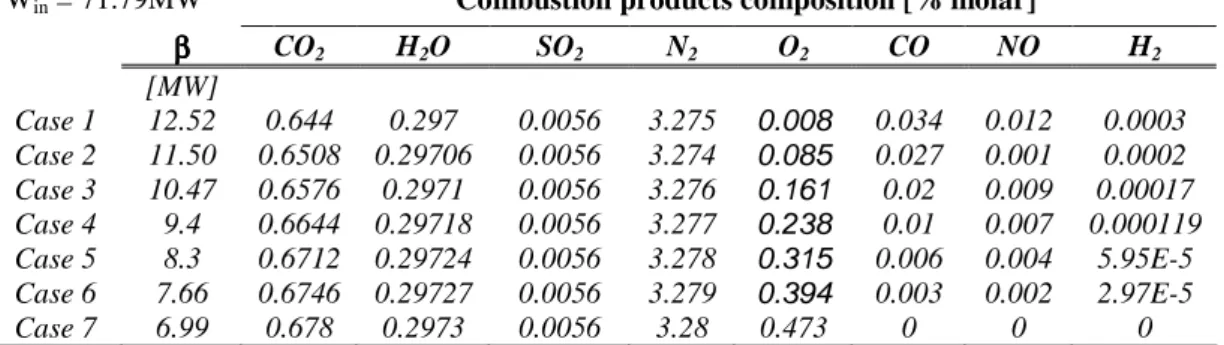
Win = 71.79MW Combustion products composition [% molar]
ββββ CO2 H2O SO2 N2 O2 CO NO H2 [MW] Case 1 12.52 0.644 0.297 0.0056 3.275 0.008 0.034 0.012 0.0003 Case 2 11.50 0.6508 0.29706 0.0056 3.274 0.085 0.027 0.001 0.0002 Case 3 10.47 0.6576 0.2971 0.0056 3.276 0.161 0.02 0.009 0.00017 Case 4 9.4 0.6644 0.29718 0.0056 3.277 0.238 0.01 0.007 0.000119 Case 5 8.3 0.6712 0.29724 0.0056 3.278 0.315 0.006 0.004 5.95E-5 Case 6 7.66 0.6746 0.29727 0.0056 3.279 0.394 0.003 0.002 2.97E-5 Case 7 6.99 0.678 0.2973 0.0056 3.28 0.473 0 0 0
Table 7.10: sensitive analysis for the pollutant emission factor
β
p, for different amountof air combustion values for a coal-fired power plants pollutants (Theoretical Air: O2,min=2.67C+8H+S-O = 2.4709 kgO2/kg fuel, Hu = 34.8C+93.9H+10.5S+6,3N-10.8
O-2.5 H2O = 31.62914 MJ/kg fuel)
In table 7.10 can be seen how change the values of βp with the concentration of the single chemical species. For the case 7, where a complete combustion is considered, the βp value is the lowest, increasing successively which the increase of CO, NO and H2 concentration in the exhaust gases. The pollutant coefficient attains its higher
values when incomplete combustion happens, caused by a low amount of air for the combustion process or by technical limitations that induce the emissions of high
206
chemical exergy contained species. As seen also the combustion temperature is a decisive factor in the composition of the exhaust gases requiring an exhaustive analysis out of the limit of this thesis.
7.6 Conclusions
The impact of mitigating the pollutant emissions on the energy conversion system has been analyzed in this chapter by means of the utility function Ψp proposed in chapter 6.
Even if as seen, the approach with the function Ψp presents some weakness, as the low value gave to the emissions by the pollutant emission factor βp. The analysis has unmistakable established that from an energetic point of view the CO2 capture is far to
be energetically sustainable. This appears obvious when analyzing the environmental impact for a global perspective, including the resource consumption. Even though, the energetic penalization decreases when achieving more integrated solutions, as the one featured by the natural gas cogeneration power plant.
This turns to be a very important result, since it shows how the function Ψp is able to
take into consideration the technological different among the two analyzed plants, offering very different results.
Indeed, for the coal-fired power plant as seen in the table 7.7, in order to abate the 50% of the CO2 emissions 20% of the electricity output is required. Attaining solutions
where, if the electricity output should be conserve, the fuel input should be considerably increased, which will inevitably accomplish an increase in the CO2
emitted. Therefore, evidences have emerged about the indiscriminate use of CO2
capture as an end-of-the-pipe technology that at the present are far too energy intensive in order have an unconditional application.
Additionally, the issues surrounding the retrofitting of these plants as the expected capital requirements and increase in operation and maintenance cost are expected to pose significant challenges to owner and policy makers.
207
References
1
Muñoz, J.R. and Michaelides, E.E., 1999, “The Effect of the Model of the Environment on Exergy Analyses”, Journal of Energy Resources Technology, 121 (4), pp. 268-276.
2
Bejan, A., Tsatsaronis, G., Moran, M., 1996, “Thermal Design and Optimization”. New York: John Wiley and Sons.
3 Muñoz, J.R., Michaelides, E.E., 1999, “The Effect of the Model of the Environment on Exergy