74
4 Integral Reactor Applications
The first integral application of SIMMER-III to the CDA assessment was successfully performed for a typical LMFR of an intermediate size, as reported by Tobita [1].
Nowadays the integral applications are performed for LMFR (both sodium and lead or LBE cooled) but also for molten salt reactor and light water reactor, with some code implementations. As example, some applications found in literature are reported below.
4.1 Lead cooled reactors
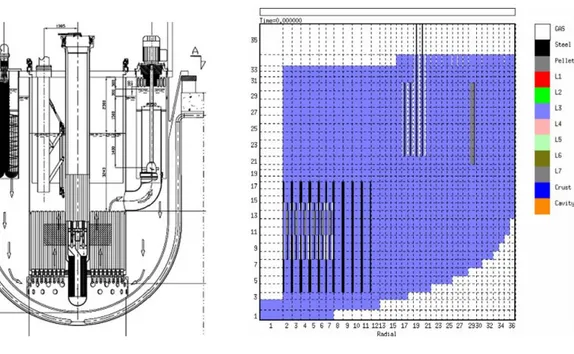
For this type of reactors, the steady-state and transient analysis of the European Facility for Industrial Transmutation (EFIT) performed by ENEA in 2008 [2] and KIT in 2010 [3] are reported. The EFIT is a 400 MW ADS transmuter loaded with a CERCER U-free fuel (Figure 4.1).
Concerning the ENEA work, SIMMER-III is implemented in order to set up the natural convection paths for the DHR circuit. The reactor is modeled by a 2-Dimensional cylindrical geometry; the core is represented by 6 radial fuel rod rings plus the reflector and the by-pass zones, and meshed in 14 axial nodes. The primary pump section, the steam generators and the DHR heat exchangers are represented by annular zones with equivalent cross flow areas (see Figure 4.2)
75
Figure 4.1: Vertical section of EFIT preliminary layout.
Figure 4.2: Scheme of SIMMER model for EFIT (ENEA)
Two accidental scenarios, important to the safety of EFIT, are analyzed. A protected loss of heat sink (PLOHS) at BoC with beam and pump trip and only one DHR loop operating are analyzed to verify the effectiveness of DHR system in natural circulation conditions. An unprotected loss of flow (ULOF) at BoC with SGs full capacity and without reactivity feedback is analyzed to assess the inherent safety behavior of the primary layout.
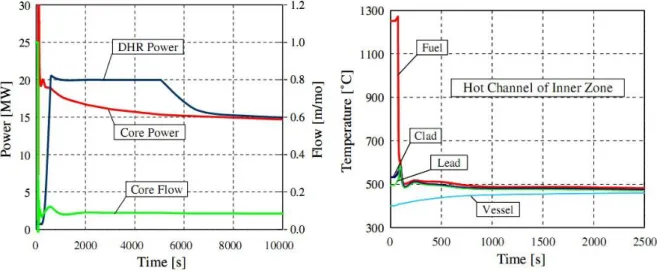
The PLOHS results in Figure 4.3a show how after some initial oscillations both core and DHR mass flow rates became stable. The peak clad temperature (Figure 4.3b) reaches 585 °C in the hot channel of the inner core zone, and then in a few seconds all temperatures fall to operational values. This behavior is acceptable for an accident in DBC 4 category, where the clad temperature can remain between 550 and 600 °C.
76
Figure 4.3: (a) Power and flow transient; (b) temperature transient in PLOHS condition.
In the ULOF calculation (Figure 4.4a) after pumps stop, the natural circulation rapidly stabilizes the core mass flow rate at about 35% of the nominal value. Maximum peak clad and fuel temperatures (Figure 4.4b) reach, respectively, about 870 °C and about 1525 °C then they quickly stabilize at values below failure temperatures. The relatively high temperatures calculated during a few seconds are considered acceptable for design extension conditions (DEC) transients.
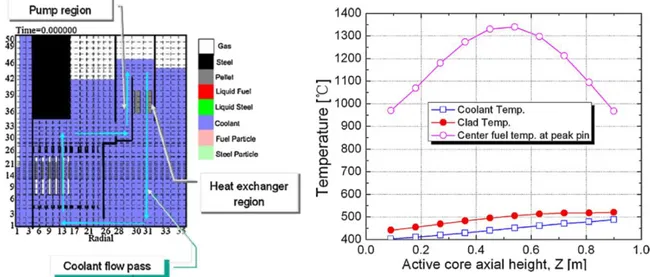
77 In SIMMER-III simulations performed by KIT, a different model has been adopted (Figure 4.5a). In steady state conditions (shown in Figure 4.5b), the SIMMER-III simulated peak temperature is 1340 °C while the peak clad temperature is 520 °C, which simulate the design values reasonably well.
Figure 4.5: (a) S-III model of EFIT (KIT);(b) axial temperature profile in the first fuel ring.
The transient cases that were simulated by SIMMER-III are the beam trip, the beam overpower, the protected and unprotected transient overpower, the protected and unprotected loss of flow, and the protected and unprotected coolant flow blockage accident. Unprotected is synonymous with a beam on condition during the accident, while protected means a beam off condition. In this thesis work, only the flow blockage and the loss of flow are reported, and the latter are compared with the previously result obtained by ENEA.
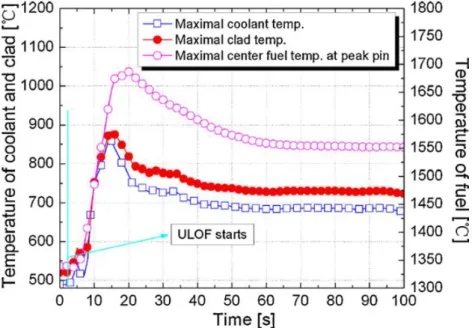
78 The initial event starts at different time, in particular, pumps coast-down after 2 second from the steady-state. But the time stopping of the pumps is the same, within 1 s. Both of the simulations present an undershooting of the coolant mass flow rate in the core, that leads to a overshooting of power and temperature, as shown in Figure 4.6. The remaining coolant mass flow rate simulated by KIT is smaller than that obtained by ENEA, in particular is assessed at about 30%. For this reason, the fuel and clad peak temperatures are higher, in particular are 1687 and 884 °C, respectively.
With the 30% remaining coolant heat removing capacity, the fuel, clad and coolant peak temperatures finally stabilized at 1552, 730 and 685 °C respectively, with a peak due to the overshooting of 1687, 884 and 858 °C, respectively.
Figure 4.6: Temperature transients in ULOF transient.
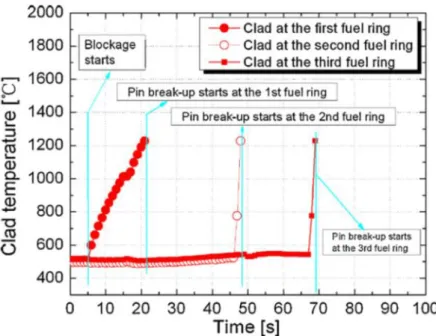
The Unprotected Blockage Accident (UBA) represents a possible initial event to core damage. Because the axial-symmetric geometry of the model, the blockage is simulated by coherently blocking a ring in the fuel assemblies. In the transient shown in Figure 4.7, a total blockage at the inner core in the first fuel ring is simulated. The blockage starts 5 s after the initial steady-state. When clad temperature reaches 1007 °C, gas blows out through cracks in the clad. The break up is assumed to occur at around 1230 °C. The temperature of the wrapper of the adjacent fuel assemblies increases and the wrapper melts and the fuel of the first fuel ring escapes from the blocked channel to its
79 neighboring gap channel, initiating the failure propagation. In the first three rings the melt occurs, because fuel is not easily removed. With the failure of the third fuel ring, more area is available for fuel escaping from the core, so power decreases and no more fuel rings will fail later on.
80
4.2 Sodium cooled reactors
One of the most recent reports in literature about the application of the code in a Sodium Fast Reactor (SFR) is performed by Yamano in 2009 [4]. Because SIMMER-III was applied early to SFR, in literature it is possible to find various applications of the code, and recently also the implementation of a new three-dimensional code SIMMER-IV.
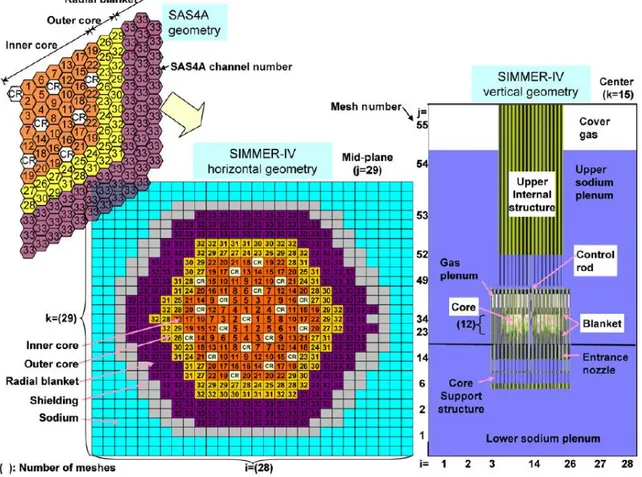
In the simulation, the initial condition is based on the obtained results by the SAS4A analysis. Figure 4.8 shows horizontal and vertical geometries used in the SIMMER-IV calculation together with the SAS4A geometry of a 1/3 sector model of the core. The calculation was carried out using the computation meshes of 28x29x55 = 44660. Only 12 axial meshes were used for the core.
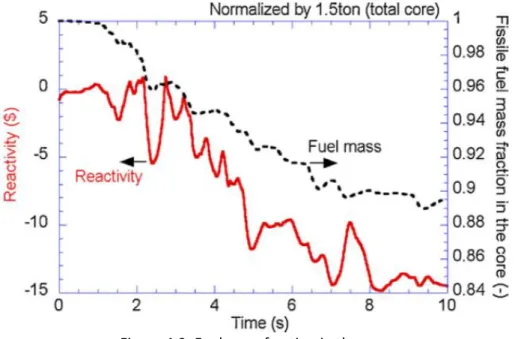
81 The fuel mass in the core decreases due to successive fuel discharges from the core (Figure 4.9) and according to that, the reactivity decreases with the decrease of fuel mass. However, it is shown that reactivity presents a certain number of peaks that are due to the fuel accumulation at the lower part of the core.
Figure 4.9: Fuel mass fraction in the core.
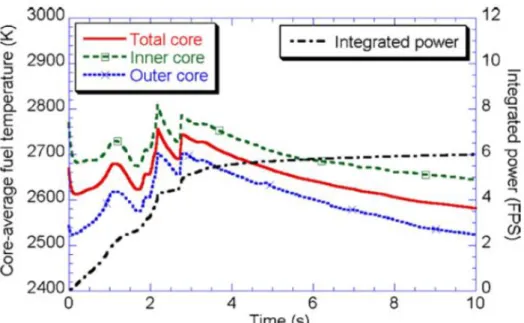
As shown in Figure 4.10, the maximum value of total-core-average fuel temperature is 2755 K. The temperatures tend to decrease because the heat transfer between fuel and steel components.
The simulated disruptive core relocation at the end of the transition phase is drawn in Figure 4.11. Although the fuel pellets in the outer core regions are still intact, most of the fuel pellets are disrupted and accumulate in the lower part of the core. The disruptive core contains pellets of the axial blanket fuel region that contributing to dilution of the fissile core.
82
Figure 4.10: Average fuel temperature in the core.
83
4.3 Molten salt reactors
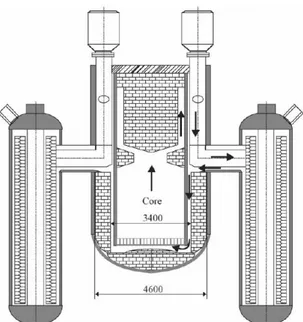
Recently, in the European Union, molten salt reactor technology has been taken into consideration because of its ability to greatly long life waste due to high burn up and on-site simplified processing and the potential to transmute minor actinides [5]. In Russia, a new molten salt reactor concept, MOSART, has been developed (see Figure 4.12).
The geometrical model of SIMMER-III for the MOSART is illustrated in Figure 4.13. The basic assumption of the present simulation is two-dimensional circular-symmetric geometry. The fluid dynamical mesh points are 20x30 in R-Z. The neutronic mesh is 60x90 where most fluid dynamics meshes are subdivided into three neutronic mesh intervals. The main feature of molten salt reactors is the liquid fuel circulating in the core region and in the external primary loop. Due to this design, the fissile materials are not only confined in the core, but circulate through the heat exchangers and the pumps in the loop. In this condition there is a strong correlation between the neutronics in the core and operating conditions, for instance, a fraction of the delayed neutrons is emitted outside the core.
Figure 4.12: 2400 MWth MOSART preliminary
design configuration.
Figure 4.13: MOSART geometric model for SIMMER-III analysis.
84 The original SIMMER-III neutronic model does not taking into account for precursor movement, but in this case, the precursor decay cannot be neglected because have the same time scale of the convective motion. So, a new model for delayed neutron precursor movement is implemented. Also the thermo fluid-dynamic part has to be extended, to simulate primary loop behavior, as one-dimensional.
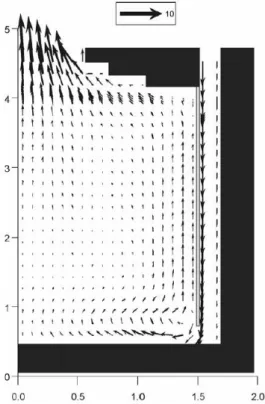
Figure 4.14 shows the 2D velocity distribution in the simulation with a properly designed distribution plate. Note that the vector scale is 10. Figure 4.15 gives the corresponding temperature distribution of the molten salt. In this case the maximal temperature region is located near the reactor core outlet region, and furthermore, the maximal molten salt temperature is about 1150 K. The safety margin has improved.
85
4.4 Light water reactors
SIMMER-III code is applied in specific LWR areas such as core disruption phenomena and steam explosion. Thermo-hydraulic validation has already occurred; in fact many basic experiments of “phase-1” and “phase-2” program assessment have been recalculated using water as simulating liquid [6].
More extensions of the code are ongoing, especially in the neutronic model. Heterogeneities appears in the resonance region through the absorption by heavy isotopes, leading to dips in the flux spectra much more pronounced in the fuel than in the no-fuel regions. This phenomenon, neglected in LMFR, cannot be neglected in thermal neutron systems, so it has to be provided in SIMMER-III extensions. Also, the application of the original SIMMER cross-section model to water-cooled thermal systems would provide unreliable reactivity feedbacks and inaccurate kinetics parameters so a new model has to be implemented. The XSs for LMFRs analyses can be evaluated reasonably accurately by assuming that each particular reactor region can be approximated by a bulk of a homogeneous mixture of reactor materials. Furthermore, the spatial neutron flux distribution may be considered as a fairly flat or a "smooth" function within a fuel subassembly. During the transient, the multigroup XSs of each nuclide are computed in SIMMER by using a basic multigroup data library. To use SIMMER for thermal reactor studies, a capability to represent core sub-regions by simplified cell models consisting of three components (fuel, structure and coolant) has been introduced. The heterogeneity treatment uses a set of pre-calculated, non-unity factors applied to XSs for the non-fuel components that take into account intra-cell neutron flux distributions in space group-wise. These factors are the structure-to-fuel and coolant-to-fuel neutron flux ratios which can be evaluated by any sophisticated cell code for a fine described fuel subassembly. As an example, an application to degraded configurations is reported, in particular in a fuel subassembly during RIA. The geometry of the fuel SA may dramatically change, and if the reactivity injection is sufficiently high, the cladding starts to melt, whereas the water coolant in the core remains rather cold. An FCI may cause the formation of destructive pressure waves.
86 To simulate this accident scenario, six degraded models for low enriched fuel plate-type SA have been assessed at different instants during the transient. Figure 4.16 shows the fuel, clad and other volume fractions computed by SIMMER during the SPERT transient in the cell where the clad breaks first. Starting from model 0 (intact model), the degraded heterogeneous models are assessed by employing the volume fractions. The fuel and the clad temperatures increase and the fuel and clad expand first in models 1 and 2 by about 20% and 5% respectively. After the clad and fuel breakup, part of fuel melts, but the fuel fragments remain in the fuel plate (models 3 and 4). The clad particles go into the water channel because their velocity is higher than the fuel fragments velocity. A small amount of liquid clad (about 1%) comes from the surrounding cells and remains close to the fuel components (model 5). Finally a very small amount of liquid fuel remains and all other components are homogeneously mixed (models 6).
87 The reactivity effects computed by the extended and original SIMMER code have been compared to those of ECCO (Figure 4.17). Results obtained by using the new technique in SIMMER are in very good agreement with the reference ECCO ones, the maximum discrepancy being of about 12% for model 6. Results concerning models 1 and 2 are indistinguishable. Results from the original SIMMER code instead, show larger discrepancies of about 20% up to about 30%.
Figure 4.17: Reactivity effect in degraded models (comparison with S-III and ECCO).
The k∞ values and the heterogeneity effects have been evaluated for each model by means of SIMMER and ECCO. The results reported in Table 4.1 show that the k∞ values
computed with the extended SIMMER version are in quite good agreement with the corresponding ECCO results. In fact, the results show that the reactivity difference between the ECCO heterogeneous model and the SIMMER XSs is below 100 pcm except for model 4 where the difference is about 200 pcm. The results also show that the heterogeneity effects evaluated by means of the ECCO and SIMMER codes are similar, but discrepancies are observed for the most degraded models mainly due to the different performance of the two codes, in fact a fine energy description with 1968 groups is employed in ECCO while only 40 groups are employed in SIMMER.
88
Models k∞ Heterogeneity effect (pcm)
ECCO SIMMER ECCO SIMMER
0 1.69010 1.68718 599 540 1 1.65976 1.65734 1030 789 2 1.66007 1.65763 1036 783 3 1.58300 1.58537 674 352 4 1.59287 1.59806 693 480 5 1.59151 1.59185 683 275 6 1.59133 1.60086 1 31
Table 4.1: Effect of heterogeneity and k∞ values computed by ECCO and SIMMER XSs.
Concluding, the SIMMER-III is capable of being applied both to molten salt reactors with some extension in neutronic and fluid dynamic models, and also in LWR, the results for not degraded conditions agree with reference, and also in the degraded conditions, even if efforts are going on to improve the effect of heterogeneity during an accidental scenario.
89
4.5 References
[1] Tobita Y., et al., “Evaluation in a CDA Energetics in the Prototype LMFBR with Latest Knowledge and Tools”, Proc.7th Int. Conf. Nuclear Engineering, (ICONE 7), Tokyo, Japan, 12-23 April 1999.
[2] Meloni P, et al., “T/H and transient analyses to confirm EFIT preliminary design”, Nucl.Eng.Des. 376 (2008) 405-408.
[3] Liu P., et al., “Transient analyses of the 400MWth-class EFIT accelerator driven transmuter with the multi-physics code: SIMMER-III”, Nucl.Eng.Des. 240 (2010) 3481-3494.
[4] Yamano H., et al., “A three-dimensional neutronics-thermohydraulics simulation of core disruptive accident in sodium-cooled fast reactor”, Nucl.Eng.Des. 239 (2009) 1673-1681.
[5] Wang S., et al., “Molten salt related extensions of the SIMMER-III code and its application for a burner reactor”, Nucl.Eng.Des. 236 (2006) 1580-1588.
[6] Gabrielli F., et al., “Extensions of the SIMMER Code for Sever Accident Analyses in Light Water Reactor”, 16th SIMMER-III/IV Review Meeting, University of Pisa, 29th May – 1st June 2012.