! ! ! ! ! ! !
!
Dipartimento!di!Chimica!e!Tecnologie!del!Farmaco!
!
Dottorato!di!Ricerca!in!Scienze!Farmaceutiche!–!XXXI!Ciclo!
! ! ! ! !!
!
!
!
!
!
!
Application!of!Nuclear!Magnetic!Resonance!
Spectroscopy! in! the! study! of! complex!
matrices!
! ! ! ! ! ! ! ! ! ! ! ! ! ! ! ! ! ! PhD!STUDENT!Simone!Circi!
! ! ! ! TUTOR!! ! COTUTOR!Prof.ssa!Luisa!Mannina!
!
Dr.!Anatoly!P.!Sobolev!
! ! ! ! ! ! ! ! ! ! ! ! ! ! ! ! ! ! ! ! ! ! ! ! ! ! ! ! ! ! ! ! ! ! ! ! ! ! ! ! ! ! ! ! ! ! ! ! ! ! ! ! ! ! ! !
LIST OF PUBLICATIONS
!1.! Sobolev, A.P., Thomas, F., Donarski, J., Ingallina, C., Circi, S., Marincola, F.C., Capitani, D., Mannina., L. (2018). Use of NMR applications to tackle future food fraud issues. ACCEPTED in Trends in Food Science & Technology.
2.! Circi, S., Ingallina C., Vista S., Capitani D., Di Vecchia A., Leonardi G., D'Achille G., Centauri L., Camin F., Mannina L. (2018). A Multi-Methodological Protocol to Characterize PDO Olive Oils. Metabolites 8(43), 1-10.
3.! Iebba, V., Guerrieri, F., Di Gregorio, V., Levrero, M., Gagliardi, A., Santangelo, F., Sobolev, A.P., Circi, S., Giannelli, V., Mannina, L., Schippa, S., Merli, M. (2018). Combining amplicon sequencing and metabolomics in cirrhotic patients highlights distinctive microbiota features involved in bacterial translocation, systemic inflammation and hepatic encephalopathy. Scientific Reports 8(8210), 1-14.
4.! Fraschetti, C., Guarcini, L., Zazza, C., Mannina, L., Circi, S., Piccirillo, S., Chiavarino, B., Filippi, A (2017). A real time evolution of unprotected protonated galactosamine probed by IRMPD spectroscopy. Physical Chemistry Chemical Physics 20(2), 8737-8743.
5.! Circi, S., Capitani, D., Randazzo, A., Ingallina, C., Mannina, L., Sobolev, A.P. (2017). Panel test and chemical analyses of commercial olive oils: a comparative study. Chemical
and Biological Technologies in Agriculture 4(18), 1-10.
6.! Sobolev, A.P., Circi, S., Capitani, D., Ingallina, C., Mannina, L. (2017). Molecular fingerprinting of food authenticity. Current Opinion in Food Science 16, 59-66.
7.! Sobolev, A.P., Circi, S., Mannina, L. (2016). Advances in Nuclear Magnetic Resonance Spectroscopy for Food Authenticity Testing. In book: Advances in Food Authenticity
1.! Circi, S., Ingallina, C., Capitani, D., Sobolev, A.P., Mannina, L. NMR-based approach to characterize tomatoes from Lazio region. XLVII National Congress on Magnetic Resonance - Torino, 19-21 September 2018.
2.! Circi, S., Ingallina, C., Sobolev, A.P., Capitani, D., Mannina, L. Applications of Metabolomics in food science and medical research: “teas” and “hepatic cirrhosis” as case studies. Secondo Workshop sulla Ricerca 2018 - Roma, 12 July 2018.
3.! Circi, S., Ingallina, C., Botta, B., Capitani, D., Sobolev, A.P., Ghirga, F., Mannina, L. e-ALIERB Project: NMR characterization of typical products from Lazio region. International
Conference on FoodOmics 2018 (5th Edition) - Cesena, 10-12 January 2018.
4.! Circi, S., Quaglio, D., Sobolev, A.P., Capitani, D., Miccheli, A., Giusti, A.M., Donini, L.M., Mannina, L. 1H NMR-based metabolomic approach to characterize urine samples of female obese patients. Advances in NMR and MS-based Metabolomics - Padova, 14-16 November 2017.
5.! Circi, S., Ingallina, C., Botta, B., Capitani, D., Sobolev, A.P., Ghirga, F., Mannina, L. NMR characterization of hemp products. XLVI National Congress on Magnetic Resonance - Fisciano, 27-29 September 2017.
6.! Circi, S., Marini, F., Capitani, D., Sobolev, A.P., Mannina, L. Combined approach of NMR and Chemometrics for comparing European and non-European olive oils. Food Integrity Conference 2017 - Parma, 10-11 May 2017.
7.! Circi, S., Capitani, D., Sobolev, A.P., Iebba, V., Schippa, S., Merli, M., Mannina, L. NMR-based metabolic approach to characterize stool samples of patients with liver cirrhosis. XLV National Congress on Magnetic Resonance - Modena, 5-7 September 2016.
8.! Circi, S., Marini, F., Sanzò, G., Capitani, D., Sobolev, A.P., Mannina, L. Impiego della spettroscopia 1H-NMR e di metodi chemiometrici per confrontare oli europei e non europei. V Workshop Applicazioni della Risonanza Magnetica nella Scienza degli Alimenti - Roma, 26-27 May 2016.
!
LIST OF ORAL COMMUNICATIONS
1.! Circi, S. Caratterizzazione di Pomodori del Basso Lazio attraverso un approccio multimetodologico. VI Workshop Applicazioni della Risonanza Magnetica nella Scienza degli Alimenti - Roma, 21-22 June 2018.
2.! Circi, S. Caratterizzazione della Canapa Industriale dell’Alto Lazio mediante Risonanza Magnetica Nucleare. La Sapienza per valorizzare gli alimenti del territorio laziale - Roma, 13 April 2018.
3.! Circi, S. L’olio di oliva e la Risonanza Magnetica. Workshop “DayOne presenta il progetto ReInVenture” - Roma, 5 May 2017.
4.! Mannina, L., Sobolev, A.P., Circi, S. Caratterizzzione dei prodotti della canapa con e-ALIERB. Workshop “La canapa industriale: sviluppo e valorizzazione di una nuova filiera agroalimentare ecosostenibile” - Roma, 17 March 2017.
!
TABLE OF CONTENTS
Chapter 1 – Introduction
1.1 Nuclear Magnetic Resonance Spectroscopy in Food Science 1
1.2 References 22
Chapter 2 – Basics of Nuclear Magnetic Resonance
2.1 Introduction 27
2.2 Classical description of Nuclear Magnetic Resonance 28
2.2.1 Nuclear magnetic moment 28
2.2.2 Nuclear Magnetic Resonance phenomenon 31
2.3 Quantum description of Nuclear Magnetic Resonance 34
2.3.1 Theoretical basics of quantum mechanics applied to NMR 34
2.3.1.1 Time independent perturbations 35
2.3.1.2 Tensor representation of the Hamiltonians 36
2.3.1.3 Rotations in NMR 37
2.3.1.4 Average Hamiltonian and calculation of the perturbation 39
2.3.2 Nuclear magnetic interactions 39
2.3.2.1 The Zeeman interaction 40
2.3.2.2 The chemical shift interaction 43
2.3.2.3 The dipolar interaction 46
2.3.2.4 The scalar interaction 48
2.3.2.5 The electric quadrupolar interaction 49
2.4 References 50
Chapter 3 – Chemometrics
3.1 Introduction 53
3.2 Explorative unsupervised analysis 56
3.2.1 Principal Component Analysis (PCA) 56
3.2.2 Tree Clustering Analysis (TCA) 58
3.3 Supervised classification/regression methods 60
3.3.1 Partial Least Square (PLS) 62
3.3.2 Linear Discriminant Analysis (LDA) 62
3.3.3 PLS-DA 64
3.3.4 SIMCA 64
3.3.5 Genetic Algorithms (GA) and Genetic Programming (GP) 65
3.3.6 Artificial Neural Networks (ANNs) 66
3.4 References 67
Chapter 4 – Typical Foods of Lazio Region
4.1 Project “e-ALIERB” 69
4.2 Peperone Cornetto di Pontecorvo DOP 79
4.2.1 Introduction 79
4.2.2 Material and Methods 80
4.2.3 Results and Discussion 86
4.2.4 References 93
4.3 Sedano Bianco di Sperlonga IGP 95
4.3.3 Results and Discussion 98
4.3.4 References 107
4.4 Tomatoes from Fondi 109
4.4.1 Introduction 109
4.4.2 Material and Methods 110
4.4.3 Results and Discussion 113
4.4.4 References 128
4.5 Hemp and processing products 129
4.5.1 Inflorescences (1st case study) 132
4.5.1.1 Material and Methods 132
4.5.1.2 Results and Discussion 135
4.5.2 Inflorescences (2nd case study) 155
4.5.2.1 Material and Methods 155
4.5.2.2 Results and Discussion 156
4.5.3 Hempseed Oil 162
4.5.3.1 Material and Methods 162
4.5.3.2 Results and Discussion 165
4.5.4 Hempseed Flour 172
4.5.4.1 Material and Methods 172
4.5.4.2 Results and Discussion 175
4.5.5 References 179
Chapter 5 – Olive Oil
5.1 Panel Test and Chemical Analyses of commercial Olive Oils 181
5.1.1 Introduction 181
5.1.2 Material and Methods 182
5.1.3 Results and Discussion 184
5.1.4 Conclusions 198
5.1.5 References 199
5.2 A Multi-Methodological Protocol to Characterize PDO Olive Oils 201
5.2.1 Introduction 201
5.2.2 Material and Methods 203
5.2.3 Results and Discussion 209
5.2.4 Conclusions 215
5.2.5 References 216
Chapter 6 – Foods with High Biological Value
6.1 Blueberries 219
6.1.1 Introduction 219
6.1.2 Material and Methods 222
6.1.3 Results and Discussion 225
6.1.4 References 241
6.2 Teas 244
6.2.1 Introduction 244
6.2.2 Material e Methods 245
6.2.3 Results and Discussion 248
6.2.4 References 251
Chapter 7 – Baobab
!
7.2 Material e Methods 255
7.3 Results e Discussion 258
7.4 Conclusions 275
7.5 References 276
Chapter 8 – NMR-based metabolic approach to characterize stool samples of patients with liver cirrhosis
8.1 Introduction 279
8.2 Material and Methods 281
8.3 Results and Discussion 284
8.4 References 289 Acknowledgements 295 ! ! ! ! ! ! ! ! ! ! ! ! ! ! ! ! ! ! ! ! ! ! ! ! ! ! ! ! ! ! ! ! ! ! ! ! ! !
! ! ! ! ! ! ! ! ! ! ! ! ! ! ! ! ! ! ! ! ! ! ! ! ! ! ! ! ! ! ! ! ! !
!
Chapter 1: Introduction
1.1 Nuclear Magnetic Resonance Spectroscopy in Food Science
Any foodstuff is a complex matrix including many compounds, widely ranging in concentration, with different chemical structure and physicochemical properties, which originate from biological raw material and/or are produced during treatment, storage, etc. Therefore, a very exhaustive food characterization, important to assure its quality and authenticity, usually needs different complementary analytical techniques to be used.
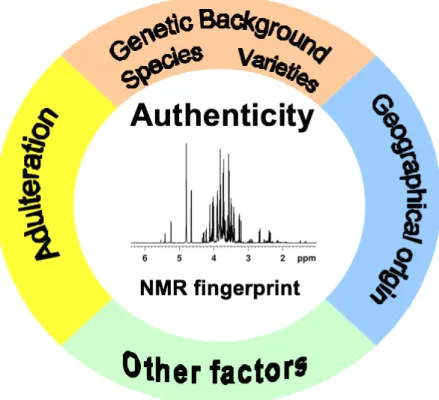
Foodomics (Capozzi & Bordoni, 2013) embodies a comprehensive approach to food characterization and with its different branches such as foodgenomics, proteomics, -glycomics, -lipidomics, and -metabolomics is able to give an exhaustive picture of foodstuff at different levels of molecular organization. Metabolomics (Fiehn, 2002) is the most comprehensive approach aimed to identification and quantification of all metabolites present in a given sample. Food metabolome originates from biochemical reactions and carries information not only about the biological source of a given foodstuff but also about all treatments during food production. The identity of a foodstuff is the fruit of its history from the origin (genetic background) to the final step when it is ready to be consumed. During this history different factors in a different manner influence its metabolite composition leaving an imprint at the molecular level. The most important factors are reported in the Figure 1.1.
An exhaustive characterization of food metabolome is possible by complementary analytical methodologies such as Nuclear Magnetic Resonance (NMR) spectroscopy (Mannina et al., 2012), Mass spectrometry (MS) (Gika et al., 2014), and vibrational spectroscopy (Cozzolino, 2015).
Figure 1.1. The most important factors influencing the metabolite composition of foodstuff.
High resolution Nuclear Magnetic Resonance (NMR) spectroscopy is known to be a robust quantitative analytical technique, but it also has proper tools for identification of compounds even in the absence of standards. One of the main advantages of NMR is that very different chemical species can be quantitatively determined altogether in a single NMR experiment. NMR simultaneously brings ‘‘high-throughput’’ spectroscopic/structural information on all metabolites present in food sample above the detection limit. Moreover, it does not require complicated sample preparation and separation of components prior to the analysis.
Liquid state high field NMR has been extensively used in foodstuffs analysis (Mannina et al., 2012). One of the most important characteristics of this technique is its high throughput due to the high resolution of NMR spectra that permits the direct qualitative and quantitative analysis of complex mixtures without physical separation of corresponding components. This characteristic makes liquid state NMR one of the most attractive and
!
suitable techniques for the direct analysis of liquid foods (beverages, oils etc.) and even for solid foods, although a minimal manipulation to extract metabolites is necessary.
NMR methodologies can be useful to characterize food matrices in terms of quality and authenticity, allowing also the identification of counterfeits (Sobolev, Circi & Mannina, 2016). Basically, this can be accomplished by using one of two approaches, either targeted or untargeted analysis according to specific application.
In the case of a specific component to be analyzed, a selective extraction can be also performed before the NMR analysis to concentrate the selected component and to avoid interference from other compounds. The targeted approach allows the identification of specific markers of identity/adulteration for a given foodstuff. For example, high resolution
1H NMR analysis was successfully applied to detect the presence of 16-O-methylcafestol
(16-OMC) in roasted coffee labeled as “100% Arabica”. 16-OMC is a chemical marker of less expensive Robusta coffee, therefore its presence in Arabica coffee confirms the adulteration (Monakhova et al., 2015). Another example is the control of sugar addition in honey: the characteristic minor sugar turanose present in honey can be easily observed and quantified by
1H-NMR. The absence or extremely low levels of this molecule has been reported to indicate
the dilution of honey with sugar syrup (Spiteri et al., 2015). Using specific markers, the NMR approach has been also used for the quantitation of sweeteners (sucralose or cyclamate, for instance) in non-alcoholic beverages (Ackermann et al., 2017), terpenols in coffee (Wei et al., 2012) or methylglyoxal or leptosperin in Manuka honey (Donarski, Roberts & Charlton, 2010a; Spiteri et al., 2017).
Unfortunately, the characterization of food authenticity or adulteration cannot always be simply restricted to the identification of a single or a few marker compounds. In some cases, an analysis based on the combination of several compounds or on the entire metabolite profile of the foodstuff, representing a unique pattern characteristic of the food identity, must be used to discriminate samples according to authenticity identifying fraudulent food. In this
case, the NMR based untargeted approach is used since it allows the characterization of the chemical composition of complex mixtures providing simultaneously information on a wide range of metabolites or a set of selected ones.
Several general untargeted approaches such as metabolic profiling, metabolic fingerprinting, and metabolomics developed for the analysis of metabolites in biological samples using liquid state NMR or diverse analytical methods have been successfully applied for food analysis. Metabolic profiling consists in identification and quantification of a number of selected metabolites, belonging to various classes of compounds, in a given sample often without a separation procedure. Metabolic fingerprinting is used when classification of samples without recognition of individual specific metabolites is sufficient: in this case, the NMR spectrum can be considered as a fingerprint of the foodstuff and all the NMR resonances are measured without any identification.
Figure 1.2 shows a typical workflow of a metabolomics study adaptable also to food quality, safety and authentication applications.
Each step is fundamental and critical with important consequences for obtaining reliable and meaningful biological results. The principles of experimental design are universal. In this phase, a number of aspect must be taken into consideration in order to maximize the possibilities of answering the research question of interest as clearly and efficiently as possible. This includes sampling size and collection, laboratory and data analysis, identification of variables (independent, dependent and controlled) and potential biases that could be introduced.
!
Figure 1.2. Typical metabolomics workflow and sources of variability (dashed box). Sources
for data pre-processing and pre-treatment phases refer specifically to a NMR-based study.
Proper sampling is a crucial point of any analytical protocol. As previously underlined, foodstuff is a complex matrix where the distribution of metabolites can be not homogeneous. If it is necessary to analyze just a piece of sample since it is impossible to put in the instrument the foodstuff as a whole (which is the most common case) it is important to perform the sampling in a correct way. For instance, one can choose to take different parts of the foodstuff to have a “representative” sample to analyze. According to specific food, samples can be analyzed as it is (liquid foodstuffs) or after a pretreatments or a suitable extraction (liquid and solid samples). Olive oils, vinegars, wines, fruits juices are often analyzed without any treatment, whereas dilution for a viscous liquid such as honey is recommended. In the case of solid foodstuffs, after sample homogenization and/or disruption, an extraction with a suitable solvent has to be performed both for vegetal samples (Kaiser et al., 2009; Kim and Verpoorte, 2010), and for animal tissues (Lin et al., 2007; Wu et al., 2008).
allows one to extract both hydrophobic and hydrophilic compounds. It has been used in the case of maize (Piccioni et al., 2009), lettuce (Sobolev et al., 2005), as well as in animal derived foodstuffs such as sea bass (Mannina et al., 2008), and meat (Jung et al., 2010).
Conservation occurring after sampling requires suitable care to preserve the quality and composition of foodstuffs. In fact, some operations such as harvesting for vegetables, and slaughter for animals can be followed by an enzymatic attack and other degradation processes. Freezing in liquid nitrogen followed by storing in the dark at low temperature are the most common procedures used to avoid chemical or enzymatic degradation.
In the case of targeted NMR analysis the choice of the solvent to extract selected metabolites is a crucial point. Acetic acid/H2O is used for extracting specific target compounds, such as polyphenols (McDougall et al., 2008). Chloroform/ethyl acetate/2-butanol mixture is used to extract aromatic compounds (Khatib et al., 2006). Solid phase extraction (SPE) has also been suggested for isolation of the compounds of interest eliminating interference from high molecular weight compounds (Beretta et al., 2008). In the case of blueberry, the SPE has allowed to reduce the sugar content and to provide NMR characterization of anthocyanins not easily identifiable in aqueous solution (Capitani et al., 2014).
According to all said up to now, well-designed experiments together with appropriate analytical data and statistical analysis, enable researchers to increase the robustness and validity of their experimental results. The importance of these aspects on the quality of metabolomics output has been widely described in many papers and reviews (Scalbert et al., 2009; Wishart, 2008; Dunn & Ellis, 2005; Smolinskaa et al., 2012). Overall, each research group follows its own optimum protocol, often developed after a case-by-case evaluation of the best compromise between quality of data and throughput of analysis. In order to promote comparison of food data among different laboratories, it is recommended that any metabolomics study provides detailed information of the experimental design and the relative
!
experimental details. Indeed, at present, the lack of standardization in procedures is a serious drawback for inter-laboratory comparison.
The use of NMR as a methodology suitable for metabolomics is supported by its high resolution and robustness. Further considerations must be given on the source of variability when NMR-based metabolomics is used towards food authentication. Often in metabolomics projects all samples are analyzed simultaneously and no or minimal consideration is needed for factors that influence acquired data over time. These factors include instrumental drift, extraction solvents and NMR acquisition buffers. Instrumental drift (minor diminishing of the magnetic field strength of an NMR instrument), except in the most extreme of circumstances, will not impact comparability of data. A modern instrument can expect to have a magnetic field drift of less than 1 Hz per hour, corresponding to approximately 8000 Hz per annum. Using the minimal field strength of 400 MHz as an example, this impact equates to a change in field strength of 0.002 %. Furthermore, it is typical to bin NMR spectra to defined regions based on chemical shift. The universal nature of the chemical shift dictates that changes in magnetic field strength will not influence data. Extraction solvents and NMR acquisition buffers are considered together. These factors are controlled through the use of good laboratory practise, using precise and accurate volumes and masses. It is also recommended that where possible large batches of NMR acquisition buffers are prepared, and aliquots stored in suitable conditions (e.g. -20 °C). The incorporation of a known, previously analysed sample in all batches and checks to assure that these data are still comparable, is the recommended practice. This aspect is particularly important when the information is derived from the comparison between spectra as, for instance, in the case of fruit varieties, development, type of farming, etc. In order to have reproducible and comparable spectra it is extremely important to control pH and temperature which have to be maintained constant within a set of experiments. In particular, variation of pH cause changes in the chemical shift of NMR signals of compounds with acidic or basic
functional groups (organic acids, amino acids, etc). It is therefore often recommended the use of suitable buffered solution in proper concentration or the addition of small volumes of acid or basic solutions.
As with any other analytical method, each individual compound in a mixture can be identified by its characteristic signals in NMR spectrum after the comparison with the NMR spectrum of pure compound (database matching approach). One of the main limitations of this approach is that an exhaustive database should be available, otherwise it would require an enormous number of compounds to be synthesized or isolated from natural sources. Another limitation is the variation of NMR spectral parameters (chemical shifts, relaxation times, etc) that can occur when the compound is analyzed in a mixture, as opposed to alone in solution, due to interactions with other molecules or, more simply, to changes in experimental conditions (e.g. concentration, ionic strength, pH, temperature, solvent, etc.). In this case, it is clear that some chemical shift values can be different from the values found in the library database, thereby precluding unambiguous identification.
Along with database matching, another complementary approach for identification of metabolites present in food samples relies on specific NMR experiments that enable signal editing o reveal correlations between different signals present in NMR spectra (NMR elucidation approach).
Frequently used signal editing approaches consist in removing the NMR signals due to either low- (diffusion-filters) or high-molecular weight compounds (relaxation spin–spin or T2 filters). The widely used correlation experiments give as a result 2D maps (or even nD maps, n>2) with the cross correlations between the proton signals of the same molecule (1
H-1H COSY, 1H-1H TOCSY, 1H-1H NOESY) or between 1H and 13C NMR signals (2D HSQC
for directly bound H-C or 2D HMBC for long-range correlations between protons and carbons generally two or three bonds away).
!
Finally, it is also useful to confirm assignments by directly adding to the investigated sample an appropriate amount of a pure chemical standard, once its presence has been inferred, or at least suspected. Overall, considering the high level of complexity of foodstuffs samples, the highest information content can only be revealed by combining all of these approaches.
Apart from qualitative and structural information, robust quantitative data can be
obtained from NMR spectra. As a quantitative method, 1H NMR is unbiased versus all classes
of organic compounds owing to the proportionality of NMR signal integral only to the number of equivalent protons and molar concentration of the corresponding compound independently on its structure or physicochemical properties. Taking into account that each NMR spectrum is a sum of single scans repeated periodically, the recycling time (the time interval between consecutive scans) has to be sufficiently long (at least five times the longitudinal relaxation time (T1) of the slowest relaxing nuclei) to assure the complete relaxation of all nuclei in mixture components and internal standard molecules.
The metabolomics workflow ends with the multivariate statistical analysis of the quantitative data and the subsequent biochemical or physiological interpretation of the experimental results, the last element of the workflow (van der Greef & Smilde, 2005; Wishart, 2008). Generally, explorative unsupervised techniques, such as Principal Component Analysis (PCA), are applied to evidence outliers or natural grouping of samples, while supervised multivariate techniques such as Partial Least Squares Discriminant Analysis (PLS-DA) are required to create classification or prediction models. Since different statistical methods use specific data treatment and a set of unique assumptions, it is recommended to verify metabolic difference by using a variety of tests.
It is therefore evident that the usefulness of metabolomics in obtaining reliable and biological meaningful results for food authentication largely depends on multiple factors and overall on the ability to set up appropriate quality control strategies to monitor the robustness
of the metabolomics workflow, thus minimizing the impact of error sources on the data interpretation.
The most foodstuffs are complex mixtures and their NMR analysis can be challenging because they are generally constituted of a myriad of distinct compounds (saccharides, polysaccharides, lipids, peptides, amino acids, etc.), which are present in a large
range of concentrations. The corresponding 1H NMR spectra of foodstuffs are highly crowded
due to the presence of numerous, often multiplet, resonances. Excellent reviews relevant to the NMR based structural assignment of compounds present in mixtures are available in the literature (Novoa-Carballal et al., 2011; McKenzie et al., 2011).
A prominent example of the unique information available from the application of NMR and metabolomics regards honey. Verifying the geographical origin of honey samples from the French island of Corsica by applying a 1H NMR statistical protocol has been demonstrated in a study performed on 118 samples collected from a range of European countries and regions (Donarski, Jones & Charlton, 2008). The subsequent statistical model, built using a combination of PLS-DA and genetic algorithm, was able to correctly identify honey samples as originating from Corsica (overall, correct classification rates, from a cross validated model, were 96.2%). A follow-up study which combined data from a second year of study investigated the variables used in a new classification algorithm and identified several biomarkers that were present in specific honey floral types (e.g. kynurenic acid was identified by a genetic algorithm as an indirect marker of geographical origin) (Donarski et al., 2010b). Spiteri et al. (2015) reported a bulk screening 1H NMR study of 205 commercial honey samples against 518-reference honeys by using Independent Components Analysis. As a result, a significant number of the commercial samples were found to fall outside the classification model created with authentic samples, suggesting a possible addition of exogenous sugars.
!
NMR spectroscopy has proven to be an extraordinary tool also for the characterization of olive oils in terms of quality, authenticity and geographical origin (Mannina & Sobolev, 2011). A geographical classification of Mediterranean virgin olive oils produced in three consecutive years was performed on 896 authentic samples by 1H NMR spectroscopy and different statistical models (Mannina et al., 2010). The potential influence of
the historical meteorological parameter averages was investigated by the 1H
NMR-metabolomics approach on more than 200 samples of extravirgin olive oils collected over a four-year period in Italy, European and non-European countries. Besides suggesting the possible use of this approach for olive oils geographical origin prediction, the results of this study indicated also a possible application to the assessment of correlation between the profile of olive oils and climate data (Rongai et al., 2017). Blending of virgin olive oil with
low-quality hazelnut oil can be unmasked by the statistical elaboration of 1H NMR signals from
fatty acid chains, squalene, and β-sitosterol (Mannina et al., 2009). Finally, it is worth reminding that, since NMR does not require prior knowledge about the compounds present in the sample, it is ideally suited to detect unexpected changes in the metabolite profile of food, such as the addition of new adulterants, without the need of an a priori hypothesis.
1H NMR spectroscopy in combination with multivariate data analysis can be
successfully used also to achieve information on various aspect of wine quality such as the authenticity, grape variety, geographical origin, and the year of vintage (Godelmann et al., 2013).
NMR method is becoming more and more popular within the food testing community, proving to be also a well suited technique for quality control (QC) applications, both as targeted or non-targeted approach. Indeed, a single NMR sample measurement can answer many authenticity issues that could not be resolved by conventional methods. The high throughput of NMR spectroscopy enables the analyst to quickly measure the large number of samples required to populate a comprehensive database. The whole spectrum is
measurable with a high reproducibility, even between laboratories. This is possible thanks to precise standard operating procedures for sample preparation and new technological developments that have minimised variability between laboratories. These include: precise monitoring of the sample temperature; automation of settings such as tuning and matching of the probe; gradient shimming to ensure magnetic field homogeneity. The whole spectrum can be considered as a reproducible fingerprint, without sophisticated pre-processing before statistical evaluation. To finalise the recognition of non-targeted NMR methods, standardisation is the final goal. Normalisation bodies are currently considering the potential of these methods including the wider requirements relating to data accessibility and database maintenance.
Therefore, the potential of NMR is not only to measure the major signals from the main metabolites but also to do so without the influence of spectral artefacts and inconsistencies such as electrical noise, peak width differences and chemical shift modification. Spectra can then be compared to each other, and by comparing an unknown spectrum with a series of reference spectra from a well-defined population, defaults are detected, without any a priori selection of variables. Such models of classification or verification are not performed as “black-box” since the user can move back to the spectral fingerprint and identify which signal is responsible for the deviation.
Through the integration of the NMR methodology inside a Quality Management System and with the use of periodic QC, the laboratory can even obtain Third Party accreditation for its NMR techniques. On the technical level, it should periodically evaluate its performance of tests. The performance validation of the analytical method must encompass all stages of preparation, extraction and analysis encountered by samples during routine analyses. Performance characteristics include: selectivity, measuring range, linearity, sensitivity, limit of detection, limit of quantitation, robustness, precision, and accuracy. Additionally, laboratories should start participating in collaborative trials and making use of
!
various International Proficiency Testing Schemes (PTS) for monitoring their analytical performance and compares the results to laboratories worldwide. They include the Pro-PTS organised by Eurofins laboratory and the Food Analysis Performance Assessment Scheme (FAPAS) from Fera.
A considerable number of literature reports have highlighted the use of NMR methodology for the study of food samples and its development of routine use in this field. This way of working is now adopted in different food control laboratories where NMR is in the portfolio of routine methods for control of products to protect producers and consumers. Applications include, for example, the control of honey (detection of added sugar, geographical and botanical origin confirmation), beverages (Lamanna et al., 2011; Li et al., 2016; Cuny et al., 2008; Spraul et al., 2009a; Spraul et al., 2009b), coffee, fats and oils (through the use of 13C-NMR it is possible to observe the alpha or beta positional distribution of fatty acid chains in the glycerol moiety (Mannina & Sobolev, 2011), vinegars (Boffoet al., 2009; Consonni et al., 2008), spices (detection of added forbidden dyes or detection of other spices and herbs or natural adulterants (Petrakis et al.,2015; Yilmaz, 2010)) and many other applications (detection of authorised processes for dried fruits such as forbidden / non-declared cleaning or drying agents). Further details on how NMR could be use in food QC are provided in the following sections.
A NMR-based platform that uses targeted and untargeted analysis called FoodScreener™, has been developed. It allows the simultaneous evaluation of different quality and authenticity related-parameters. To date, two different modules of the
FoodScreenerTM platform are available, namely: Spin Generated Fingerprint-Profiling
(SGF-Profiling™) for fruit juice and Wine-Profiling™ for wine. As demonstration of its commercial application and its increasing acceptance as routine use, it can be reported the recent decision of the Hungarian Ministry of Agriculture (August 2017) to start a program in order to authenticate and identify Hungarian wines using NMR
FoodScreener-Wine-Profiling™. The cost of single analysis can vary in relation to the possibility to buy and use the platform or to send the sample to a laboratory equipped with FoodScreener.
The SGF-Profiling™ module represents a heterogeneous collection of statistical models which can be applied consecutively to one single spectrum (Spraul et al., 2009a). Depending on the model used, the following are predictable: fruit and product type differentiation, adulteration by sugar or acid addition, geographical origin and fruit mixture. Furthermore, information on the quantification of substances can be carried out. In particular, targeted analysis provides information on the content of sugars (glucose, fructose and sucrose), the total acidity of the juice (citric, malic, isocitric and quinic acid), perishable indicators (ethanol, fumaric acid, lactate) and process control parameters (galacturonic acid, phlorin). The values are compared to reference standards. The screening is based on a database composed by thousands of NMR spectra from authentic juices. Finally, the combination of SGF-Profiling™ and the associated software JuiceScreener™ provides the analytical report in which the analytical answer and results are summarized. Regarding the untargeted analysis, both the assessment of concentration deviation of hundreds of compounds and unexpected ingredients are detectable to verify adulteration and unknown fraud (Spraul et al.,2013). The application of SGF-Profiling™ is well established for the routine use analysis of fruit products (juices, concentrates, nectars, purees…).
This technology has been extended to other types of food material such as wine (Spraul et al., 2009b; Monakhova et al., 2014a). Wine-Profiling™ is a method for wine analysis. The comparison of the spectroscopic fingerprint obtained for each individual sample with that of a large database of authentic wine samples allows to answer question on the composition, geographical origin, grape variety and vintage. Although this procedure had been already developed for fruit juice analysis, it was further optimized for wine and alcoholic beverages in general. In particular, to overcome the need to eliminate the major signals (water and ethanol), a methodology was developed which can suppress both signals from water and
!
ethanol during NMR experiment without losing signals outside those regions (Minoja & Napoli, 2014). In a similar way to SGF-Profiling™, Wine-Profiling™ provides both targeted and untargeted analysis. The former is performed through the quantification of 56 parameters per sample and their comparison with official reference values, while the latter is carried out through verification models able to detect any deviation from authentic reference data.
New NMR benchtop instrumentations, low field but high resolution, represent a new frontier in the food authentication field. Several manufacturers currently offer benchtop instruments that operate at a proton frequency between 45 - 90 MHz. These instruments have significantly lower purchase and maintenance costs than conventional NMR instruments, do not require liquid nitrogen and helium cryogens and do not require specialised staff for their operation. Although some NMR phenomenon are adversely effected at lower field strengths, e.g. sensitivity is lower and spectral overlap is greater, these instruments are still incredibly powerful for food authentication analysis.
The utilisation of low field instrumentation for food analysis was presented at the 7th International Symposium on Recent Advances in Food Analysis (RAFA 2015). The example of rapid analysis for spirit authentication was shown. Under Council Regulation (EEC) No 110/2008 of the European Parliament and of the Council of 15 January 2008 “laying down general rules on the definition, description and presentation of spirit drinks”, minimum alcoholic strengths for spirit drinks are set. The alcohol content of a spirit drink can be altered by two common fraud types: extension (diluting a spirit drink with water) and counterfeiting (replacing a genuine product with a copy). Therefore, the ability to accurately assess the alcoholic strength of a spirit drink can assist in detection of these frauds. The quantitative nature of the NMR resonances can be theoretically exploited to determine the alcoholic strength of a sample without the requirement for an internal standard. In practise, the assumptions made are non-trivial and a correction coefficient must be calculated to routinely
early generation low field spectrometer could accurately calculate ethanol content within 1.96% (CI 95%), whereas results from a high field 500 MHz NMR spectrometer were approximately 20-fold more accurate. It is expected that a significant increase on accuracy will be observed as further advances are made in instrumentation.
Benchtop NMR provides also a fast, direct, and user-friendly method to determine the fat and oil content in foodstuffs. The technique is based on measurement of the NMR response obtained from oil (fat) in the product, and quantification of its content by calibration. The study performed by Jakes et al. (2015) is a good demonstration on the ability of low field NMR spectroscopy to differentiate beef from horse meat. The lipid constituents of beef and horse samples analysed by low-field NMR were sufficiently different to enable the creation of classification models. When these models were challenged with blind samples (ones that had not been used in model creation) excellent classification results were obtained. Another successful example of food analysis by benchtop NMR is provided by Defernez et al. (2017). In this study, a methodology for distinguishing Arabica and Robusta coffee by using high field NMR spectroscopy (Monakhova et al., 2015) was transferred to a 60 MHz low field spectrometer. Arabica coffee beans command a higher price than Robusta beans, therefore an incentive exists for unscrupulous traders to substitute Robusta beans for Arabica. Although it is possible to differentiate whole Arabica and Robusta beans by eye due to morphological differences, this is not possible on roasted and ground coffee. Chemically, the beans can be distinguished through detection of the compound 16-O-methylcafestol (16-OMC), which is found exclusively in Robusta beans. Therefore, authentic samples of Arabica do not contain 16-OMC and this compound can be used to detect adulteration/substitution with Robusta. The developed low-field NMR methodology was rapid, with a total time for analysis, including extraction and data acquisition, of approximately 45 minutes. It could detect adulteration of Arabica with Robusta when the adulteration level was greater than 10-20%. The methodology was used to perform a small market survey, the results of which showed no adulteration.
!
Benchtop NMR instrumentation has the potential to be a breakthrough technology in the field of food authentication within the industry. It utilises the power of NMR spectroscopy but with significantly reduced infrastructure requirements and costs. It can be applied in either the targeted or the untargeted approach. In the targeted approach, it is possible to routinely quantify components within complex mixtures and to translate academic research into deployable solutions. In the untargeted approach, models of normality can be rapidly developed and used by industry to confirm their products are consistent with previous batches. This application of spectroscopic technology is not new, and has been implemented using profiling technologies such as near and Fourier Transform infra-red (NIR, FT-IR) spectroscopy. The unique advantage of routine profiling using low-field NMR spectroscopy though, is the interpretability of signals to specific chemicals. This is because NMR phenomenon is directly transferable from benchtop instrumentation to high field, laboratory based instrumentation and the advantages they provide. For example, in a theoretical case where a food sample is shown to be inconsistent by benchtop NMR, the same sample analysed on a high field instrument would show the same inconsistency, enabling rapid unknown identification. Once identified, intelligence can be applied to the inconsistent sample to determine what action, if any is required. Studies that apply both low of high field analysis are recommended to demonstrate the utility of this approach.
Liquid foods, such as beverages, vegetable oils and fully soluble foodstuffs like honey are very simple to analyse by 1H NMR because they do not require specific preparation. Therefore, they can be analysed with no to minimal pre-treatment and high resolution spectra are usually obtained. Some experimental difficulties due to the presence of the signals of the most abundant components (water in fruit juices, ethanol and water in wine and beer, etc.) have been resolved using specific pulse sequences to suppress these signals (Mannina et al., 2016).
Non-homogeneous liquid foods usually do not show sufficiently resolved NMR spectra, and additional extraction procedures may be necessary to extract and study their components. Due to its nature, milk can be considered one of the most complicated foods to study. Milk is an emulsified colloid consisting of small globules of fat and protein suspended
in water, the principal component of milk. Therefore, a well-resolved 1H NMR spectrum is
difficult to obtain. In literature, only one example of 1H NMR analysis of milk without any
pretreatment is reported (Hu et al., 2004). Other studies of milk have required sample pretreatment such as the use of spin filters with specific cut-off to remove residual lipids and protein (Sundekilde et al., 2013), the extraction of triacylglycerols, and/or adjustment of the pH before the acquisition of 13C and 31P NMR spectra (Belton & Lyster, 2009; Andreotti et al.,2002). The “traditional” frauds encountered in milk include: watering, lactoserum addition, species blend, old milk reuse, etc. More recently, other issues have involved the addition of nitrogen containing compounds (melamine, dicyandiamide, protein hydrolysates, etc.) to artificially increase the protein content (as determined from total nitrogen). The current approach offered by routine laboratories to control the authenticity of milk and milk powder consist of doing 2 extractions in parallel in order to cover all potential adulterations (unpublished):
- one extraction in water to monitor the sugar profile (with the possibility of identifying delactosed milk and to observe if sucrose or maltodextrin have been added), to detect protein hydrolysate and to control microbial degradation,
- one extraction in dimethyl sulfoxide to monitor the fat content (whole, semi-skimmed, skimmed), to detect addition of foreign fats, to identify the thermal treatment (pasteurized or sterilised) or to detect melamine or other N-enhancers.
Solid food samples require specific preparation, including sampling, conservation and homogenization for extraction, to be analyzed by liquid state 1H NMR. The extraction procedure is a critical step contributing significantly to the final quali-quantitative profile
!
composition revealed by NMR. As an illustration of this extraction procedure, untargeted screening methods have been developed to authenticate caviar (Heude et al., 2016) as a tool to protect the PGI (Protected Geographical Indication) “caviar d’Aquitaine”. Using an untargeted approach, authentic caviar d’Aquitaine and foreign origin caviar were analysed
using 1H NMR spectroscopy. This method was validated and implemented in control
laboratory.
Another problem source for NMR is the widespread presence of paramagnetic metals (i.e. Fe3+, Mn2+) in various foodstuffs, namely spices, cereals, dried fruits and meat. During the extraction procedure, these cations can be co-extracted and give rise to the broadening of 1H signal of metabolites, leading to decreased resolution.
The direct application of the High Resolution Magic Angle Spinning (HR-MAS) for products without any pretreatment is possible for semisolid foodstuff (Ritota et al., 2010). Such technology has been used to control fish freshness (Heude et al., 2015) but because of the lack of automation, currently applications are limited to specific studies.
NMR methodologies have already shown a noticeable potential in food analysis to solve specific problems. The versatility of NMR and possibility to employ either targeted or untargeted approaches enable one to develop a suitable protocol ad hoc for a specific problem. Despite these prospectives, important challenges still remain. Due to high cost of equipment and its maintenance, as well as a necessity of high qualified personnel, high resolution NMR is still too expensive for day-to-day application. To reduce the cost per single measurement and make NMR more accessible, the complete automation of NMR analysis is in progress. The spectral processing, assignment and statistical analysis of NMR data are still too laborious and sometimes constitute a bottleneck of the entire analysis. Fortunately, the constant development of software suitable for assignment and quantification of metabolites in food matrices could significantly help and encourage the application of NMR. The creation and development of interactive databases with NMR data for foodstuffs and standardization
of successful protocols of analysis are also important to extend NMR application in the authenticity testing field.
An example of existing food databases is FooDB that aggregates data from different sources reporting food constituents and their chemical and biological properties, mostly for unprocessed foodstuffs. Unfortunately, the general classification of food types does not include some essential aspects relative to variety, processing, etc, that determine the food identity. For instance, tea (Camellia sinensis) is reported as a single type product without taking into consideration different fermentation types and varieties.
An attempt to create a comprehensive database including food NMR spectra and data on their origin, composition, variety etc. is being undertaken by the Italian Group of Magnetic
Resonance in Food Science (e-ALIERB OpenLab, 2016 http://www.e-alierb.it/). Outputs and
recommendations will be drawn from this research to provide implementation guidelines and it is recommended that these conclusions are published in a peer reviewed journal.
The creation of comprehensive NMR databases of foodstuffs is hindered by the fragmentation of experimental approaches used until to now. Different extraction procedures, solvents, quantification and statistical analysis have been applied for the same foodstuff that results in non-comparable NMR profiles. Therefore, an international collaboration between researchers is necessary to unify different approaches and can be a key element in the development of a food NMR database that is constantly, or at least periodically, updated.
The combination of data from different platforms (NMR and other analytical methods) is a powerful strategy to enrich the final information content regarding food identity and thus improve the identification of food frauds followed by routine applications. The benefit of combining two untargeted methods has been recently illustrated on honey by Spiteri et al. (2016). Using data from two analytical platforms, namely NMR and high resolution mass spectrometry (HRMS), and two separate HRMS technologies, honey samples were analysed with the aim of determining their botanical origins. No one of the PCA models built
!
with individual NMR or MS data set was able to discriminate samples in terms of botanical origin. Then, mid-level fusion of the data was explored in two ways to improve the discrimination: fusion of PCA scores from the combined data sets or after selection of variables by PLS-DA. In both cases, it was possible to improve the discrimination so that botanical origin could be assigned without the need for pollen analysis.
Another example of the benefit of fusing NMR data with alternative techniques has been provided by Monakhova et al. (2014b). The authors evaluated the combination of discrete isotopic data with untargeted NMR spectrum to have better control of wines. Both
techniques are known to provide useful information to the characterization of wine: 1H NMR
spectroscopy can be used to build robust classification models for grape variety, year of vintage and geographical origin, while stable isotope ratio analysis is a good source of chemical information for the authenticity assessment of food products. By combining these two methodologies, improvement of classification rates of wine was achieved: 100% for the determination of geographical origin (60–70% correct prediction was obtained with stable
isotope data alone and 82–89% with 1H NMR spectroscopy) and 99% for the vintage of wine
1.2 References
Ackermann, S.M., Dolsophon, K., Monakhova, Y.B., Kuballa, T., Reusch, H., Thongpanchang, T., …Lachenmeier, D.W., 2017. Automated multicomponent analysis of soft drinks using 1D 1H and 2D 1H-1H J-resolved NMR spectroscopy. Food Anal. Methods 3, 827-836.
Andreotti, G., Lamanna, R., Trivellone, E., & Motta, A., 2002. 13C NMR spectra of TAG: An easy way to distinguish milks from different animal species. J. Am. Oil Chem. Soc. 79, 123-127.
Belton, P.S., & Lyster, R.L.J. 2009., 31P nuclear magnetic resonance spectra of milk from various species. J. Dairy Res. 58, 443-451.
Beretta, G., Caneva, E., Regazzoni, L., Bakhtyari, N.G., Facino, R.M., 2008. A solid-phase extraction procedure coupled to 1H NMR, with chemometric analysis, to seek reliable markers of the botanical origin of honey. Anal. Chim. Acta 620, 176–182.
Boffo, E.F., Tavares, L.A., Ferreira, M.M.C., Ferreira, A.G., 2009. Classification of Brazilian vinegars according to their 1H NMR spectra by pattern recognition analysis. LWT – Food Sci. Technol. 42, 1455-1460.
Capitani, D., Sobolev, A.P., Delfini. M., Vista, S., Antiochia, R., Proietti, N., Bubici, S., Ferrante, G., Carradori, S., De Salvador, F.R., Mannina, L., 2014. NMR methodologies in the analysis of blueberries. Electrophoresis 35, 1615-1626.
Capozzi, F., Bordoni, A., 2013. Foodomics: a new comprehensive approach to food and nutrition. Genes Nutr. 8, 1–4.
Consonni, R., Cagliani, L.R., Rinaldini, S., Incerti, A., 2008. Analytical method for authentication of Traditional Balsamic Vinegar of Modena. Talanta 75, 765-769.
Cozzolino, D., 2015. Foodomics and infrared spectroscopy: from compounds to functionality. Curr. Opin. Food Sci. 4, 39-43.
Cuny, M., Vigneau, E., Le Gall, G., Colquhoun, I., Lees, M., Rutledge, D.N., 2008. Fruit juice authentication by 1H NMR spectroscopy in combination with different chemometrics tools. Anal. Bioanal. Chem. 390, 419-427.
Defernez, M., Wren, E., Watson, A.D., Gunning, Y., Colquhoun, I.J., Le Gall, G., …Kemsley, E.K., 2017. Low-field 1H NMR spectroscopy for distinguishing between Arabica and Robusta ground roast coffees. Food Chem. 216, 106-113.
Donarski, J.A., Jones, S.A., & Charlton, A.J., 2008. Application of cryoprobe 1H nuclear magnetic resonance spectroscopy and multivariate analysis for the verification of Corsican honey. J. Agric. Food Chem. 56, 5451-5456.
Donarski, J.A., Jones, S.A., Harrison, M., Driffield, M., & Charlton, A.J., 2010b. Identification of botanical biomarkers found in Corsican honey. Food Chem. 118, 987-994.
!
Donarski, J.A., Roberts, D.P.T., & Charlton, A.J., (2010a). Quantitative NMR spectroscopy for the rapid measurement of methylglyoxal in manuka honey. Anal. Methods. 10, 1479-1483. Dunn, W.B., & Ellis, D.I., 2005. Metabolomics: Current analytical platforms and methodologies. Trends Analyt Chem. 24, 285-294.
Fiehn, O., 2002. Metabolomics – the link between genotypes and phenotypes. Plant Mol. Biol. 48, 155–171.
FooDB., (2017). http://foodb.ca/ Accessed 20.11.2017.
Godelmann, R., Fang, F., Humpfer, E., Schutz, B., Bansbach, M., Schafer, H., & Spraul, M., 2013. Targeted and nontargeted wine analysis by 1H NMR spectroscopy combined with multivariate statistical analysis. Differentiation of important parameters: grape variety, geographical origin, year of vintage. J. Agric. Food Chem. 61, 5610-5619.
Heude, C., Lemasson, E., Elbayed, K., & Piotto, M., 2015. Rapid assessment of fish freshness and quality by 1H HR-MAS NMR spectroscopy. Food Anal. Methods. 8, 907–915.
Heude, C., Elbayed, K., Jezequel, T., Fanuel, M., Lugan, R., Heintz, D., …Piotto, M., 2016. Metabolic characterization of caviar specimens by 1H NMR spectroscopy: Towards caviar authenticity and integrity. Food Anal. Methods. 9, 3428-3438.
Hu, F., Furihata, K., Ito-Ishida, M., Kaminogawa, S., & Tanokura, M., 2004. Nondestructive observation of bovine milk by NMR spectroscopy: analysis of existing states of compounds and detection of new compounds. J. Agric. Food Chem. 52, 4969–4974.
Jakes, W., Gerdova, A., Defernez, M., Watson, A. D., McCallum, C., Limer, E., …Kemsley, E. K., 2015. Authentication of beef versus horse meat using 60 MHz 1H NMR spectroscopy. Food Chem. 175, 1-9.
Gika, H.G., Wilson I.D., Theodoridis, G.A.,2014. Chapter 9 – The role of mass spectrometry in nontargeted metabolomics. In: Comprehensive Analytical Chemistry. Fundamentals of advanced omics technologies: From genes to metabolites. Edited by Simó, C., Cifuentes, A., García-Cañas, V., Elsevier,63, 213-233.
Jung, Y., Lee, J., Kwon, J., Lee, K. S., Ryu, D. H., Hwang, G.S., 2010. Discrimination of the geographical origin of beef by 1H NMR-based metabolomics. J. Agric. Food Chem. 58 (19), 10458–10466.
Kaiser, K.A., Barding Jr, G.A., Larive, C.K., 2009. A comparison of metabolite extraction strategies for 1H NMR-based metabolic profiling using mature leaf tissue from the model plant Arabidopsis thaliana. Magn. Reson. Chem. 47, S147–S156.
Kim, H.K., Verpoorte, R., 2010. Sample preparation for plant metabolomics. Phytochem. Anal. 21, 4–13.
Khatib, A., Wilson, E.G., Kim, H.K., Lefeber, A.W.M., Erkelens, C., Choi, Y.H., Verpoorte, R., 2006. Application of two-dimensional J-resolved nuclear magnetic resonance spectroscopy to differentiation of beer. Anal. Chim. Acta 559, 264–270.
Lamanna, R., Braca, A., Di Paolo, E., & Imparato, G., 2011. Identification of milk mixtures by 1H NMR profiling. Magn. Reson. Chem. 49, S22-S26.
Li, Q., Yu, Z., Zhu, D., Meng, X., Pang, X., Liu, Y., Frew, R., Chen, H., Chen, G., 2016. The application of NMR-based milk metabolite analysis in milk authenticity identification. J. Sci. Food Agric. 97, 2875-2882.
Lin, C.Y., Wu, H., Tjeerdema, R.S., Viant, M.R., 2007. Evaluation of metabolite extraction strategies from tissue samples using NMR metabolomics. Metabolomics 3, 55–67.
Mannina, L., Sobolev, A.P., Capitani, D., Iaffaldano, N., Rosato, M.P., Ragni, P., Reale, A., Sorrentino, E., D’Amico, I., Coppola, R., 2008. NMR metabolic profiling of organic and aqueous sea bass extracts: implications in the discrimination of wild and cultured sea bass. Talanta 77, 433–444.
Mannina, L., Marini, F., Gobbino, M., Sobolev, A. P., & Capitani, D., 2010. NMR and chemometrics in tracing European olive oils: the case study of Ligurian samples. Talanta 80, 2141–2148.
Mannina, L., & Sobolev, A. P., 2011. High resolution NMR characterization of olive oils in terms of quality, authenticity and geographical origin. Magn. Reson. Chem. 49, S3-S11. Mannina, L., Sobolev, A.P., Viel, S., 2012. Liquid state 1H high field NMR in food analysis. Prog. Nucl. Magn. Reson. Spectrosc. 66, 1–39.
Mannina, L., Marini, F., Antiochia, R., Cesa, S., Magrì, A., Capitani, D. & Sobolev, A.P., 2016. Tracing the origin of beer samples by NMR and chemometrics: Trappist beers as a case study. Electrophoresis 37, 2710-2719.
McDougall, G., Martinussen, I., Stewart, D., 2008. Towards fruitful metabolomics: high throughput analyses of polyphenol composition in berries using direct infusion mass spectrometry. J. Chromatogr. B 871, 362–369.
McKenzie, J.S., Donarski, J.A., Wilson, J.C., Charlton, A.J., 2011. Analysis of complex mixtures using high-resolution nuclear magnetic resonance spectroscopy and chemometrics. Prog. Nucl. Magn. Reson. Spectrosc. 59, 336–359.
Minoja, A.P., & Napoli, C., 2014. NMR screening in the quality control and nutraceuticals. Food Res. Int. 63, 126-131.
Monakhova, Y.B., Godelmann, R., Hermann, A., Kuballa, T., Cannet, C., Schäfer, H., Rutledge, D.N., 2014b. Synergistic effect of the simultaneous chemometric analysis of ¹H NMR spectroscopic and stable isotope (SNIF-NMR, 18O, ¹³C) data: application to wine analysis. Anal. Chim. Acta. 833, 29-39.
Monakhova, Y.B., Ruge, W., Kuballa, T., Ilse, M., Winkelmann, O., Diehl, B., …Lachenmeier, D.W., 2015. Rapid approach to identify the presence of Arabica and Robusta species in coffee using 1H NMR spectroscopy. Food Chem. 182, 178-184.
Monakhova, Y.B., Schutz, B., Schafer, H., Spraul, M., Kuballa, T., Hahan, H., & Lachenmeier, D.W., 2014a). Validation studies for multicomponent quantitative NMR analysis: the example of apple fruit juice. Accredit. Qual. Assur. 19, 17-29.
!
Novoa-Carballal, R., Fernandez-Megia, E., Jimenez, C., Riguera, R., 2011. NMR methods for unravelling the spectra of complex mixtures. Nat. Prod. Rep. 28, 78–98.
Petrakis, E.A., Cagliani, L.R., Polissiou, M.G., & Consonni, R., 2015. Evaluation of saffron (Crocus sativus L.) adulteration with plant adulterants by 1H NMR metabolite fingerprinting. Food Chem. 173, 890-896.
Piccioni, F., Capitani, D., Zolla, L., Mannina, L., 2009. NMR metabolic profiling of transgenic maize with the Cry1A(b) gene, J. Agric. Food Chem. 57, 6041–6049.
Ritota, M., Marini, F., Sequi, P., & Valentini, M., 2010. Metabolomic characterization of Italian sweet pepper (Capsicum annum L.) by means of HRMAS-NMR spectroscopy. J. Agric. Food Chem. 58, 9675-9684.
Rongai, D., Sabatini, N., Del Coco, L., Perri, E., Del Re, P., Simone, N., …Fanizzi, F.P., 2017. 1H NMR and multivariate analysis for geographic characterization of commercial extra virgin olive oil: A possible correlation with climate data. Foods 6, 96.
Scalbert, A., Brennan, L., Fiehn, O., Hankemeier, T., Kristal, B.S., van Ommen, B., …Wopereis, S., 2009. Mass-spectrometry-based metabolomics: limitations and recommendations for future progress with particular focus on nutrition research. Metabolomics 5, 435-458.
Smolinskaa, A., Blancheta, L., Buydensa, L.M.C., & Wijmengaa, S.S., 2012. NMR and pattern recognition methods in metabolomics: From data acquisition to biomarker discovery: A review. Anal. Chim. Acta. 750, 82-97.
Sobolev, A.P., Brosio, E., Gianferri, R., Segre, A.L., 2005. Metabolic profile of lettuce leaves by high-field NMR spectra. Magn. Reson. Chem. 43, 625–638.
Sobolev, A.P., Circi, S., & Mannina, L., 2016. Advances in nuclear magnetic resonance spectroscopy for food authenticity testing. In: G. Downey (Ed.), Advances in Food Authenticity Testing (pp. 147-170). Elsevier Ltd. United Kingdom: Woodhead Publishing Spiteri, M., Dubin, E., Cotton, J., Poirel, M., Corman, B., Jamin, E., …Rutledge, D.N., 2016. Data fusion between high resolution 1H-NMR and mass spectrometry: A synergetic approach to honey botanical origin characterization. Anal. Bioanal. Chem. 408, 4389-4401.
Spiteri, M., Jamin, E., Thomas, F., Rebours, A., Lees, M., Rogers, K.M., & Rutledge, D.N., 2015. Fast and global authenticity screening of honey using 1H-NMR profiling. Food Chem. 189, 60-66.
Spiteri, M., Rogers, K. M., Jamin, E., Thomas, F., Guyader, S., Lees, M., & Rutledge, D.N., 2017. Combination of 1H NMR and chemometrics to discriminate Manuka honey from other floral honey types from Oceania. Food Chem. 217, 766–772.
Spraul, M., Shutz, B, Humpfer, E., Mortter, M., Schafer, H., Koswig, S., & Rinke, P., 2009a. Mixture analysis by NMR as applied to fruit juice quality control. Magn. Reson. Chem. 47, S130-S137.
Spraul, M., Schuz, B., Rinke, P., Koswig, S., Humpfer, E., Schafer, H., …Minoja, A., 2009b. NMR-based multi parametric quality control of fruit juices: SGF profiling. Nutrients 1, 148-155.
Spraul, M., Schafer, H., Shutz, B., Fang, F., & Link, M., 2013. Novel NMR-technology to assess food quality and safety. IJABE 7, 960-963.
Sundekilde, U.K., Poulsen, N.A., Larsen, L.B, & Bertram, H.C., 2013. Nuclear magnetic resonance metabonomics reveals strong association between milk metabolites and somatic cell count in bovine milk. J. Diary Sci. 96, 290–299.
Wei, F., Furihata, K., Koda, M., Hu, F., Miyakawa, T., & Tanokura, M., 2012. Roasting process of coffee beans as studied by nuclear magnetic resonance: Time course of changes in composition. J. Agric. Food Chem. 60, 1005-1012.
Wishart, D. S., 2008. Quantitative metabolomics using NMR. Trends Analyt Chem. 27, 228-237.
Wu, H., Southam, A.D., Hines, A., Viant, M.R., 2008. High-throughput tissue extraction protocol for NMR and MS-based metabolomics. Anal. Biochem. 372, 204–212.
van der Greef, J., & Smilde, A.K., 2005. Symbiosis of chemometrics and metabolomics: past, present, and future. J. Chemom. 19, 376-386.
Yilmaz, A., 2010. 1H NMR metabolic fingerprinting of saffron extracts. Metabolomics 6, 511-517. ! ! ! ! ! ! ! ! ! ! !
!
Chapter 2: Basics of Nuclear Magnetic Resonance
2.1 Introduction
Nuclear Magnetic Resonance in the condensed phase was discovered in 1946 independently by two groups of scientists, Bloch, Hansen and Packard at the University of Stanford (California, USA) (Bloch, Hansen & Packward, 1946), and Purcell, Torrey and Pound at the University of Cambridge (Massachussets, USA) (Purcell, Torrey & Pound, 1946).
Right from the beginning, NMR was approached from two distinct perspectives. Bloch and coworkers envisioned NMR in classical terms, considering the orientation of microscopic magnetic moments with respect to an external magnetic field, whereas Purcell and coworkers pictured NMR in terms of quantum transitions.
The first conception affords one a rather simple and efficient way to describe the NMR phenomenon, providing insight regarding fundamental issues such as magnetization precession and nuclear relaxation. However, the classical description becomes rapidly limited and the second approach, the so-called spectroscopic description, relying mainly on quantum mechanics, becomes indispensable as soon as a deeper understanding of the interactions that rule nuclear spins is sought.
Accordingly, this chapter is divided into two sections that reflect the views of Bloch and Purcell, respectively. In a first part, we present the Bloch formalism and show how it can be applied to describe the NMR phenomenon. In a second part, we address the NMR phenomenon more rigorously using quantum mechanics. Specifically, a quantum mechanical description of the main interactions controlling the behavior of the nuclear spins is given, both
for the liquid and the solid state. Because many excellent text books exist on these topics, only the main results will be exposed here and the reader is referred to the general references given at the end of this chapter for more rigorous treatments (Pople, Schneider & Bernstein, 1959; Abragam, 1961; Lynden-Bell & Harris, 1969; Ferrar & Becker, 1971; Shaw, 1976; Fukushima & Roeder, 1981; Mehring, 1983; Ernst, Bodenhausen & Wokaun, 1987; Neuhaus & Williamson, 1989; Callaghan, 1991; Sanders & Hunter, 1993; Schmidt-Rohr & Spiess, 1994; Stejskal & Memory, 1994; Cavanagh et al., 1996; Kimmich, 1997; Levitt, 2001; Canet, Boubel & Canet Soulas, 2002).
2.2 Classical description of Nuclear Magnetic Resonance
This section describes the theoretical bases of NMR focusing on the so-called classical approach due to Bloch. The notion of magnetic moment is explained and the NMR phenomenon is described.
2.2.1! Nuclear magnetic moment
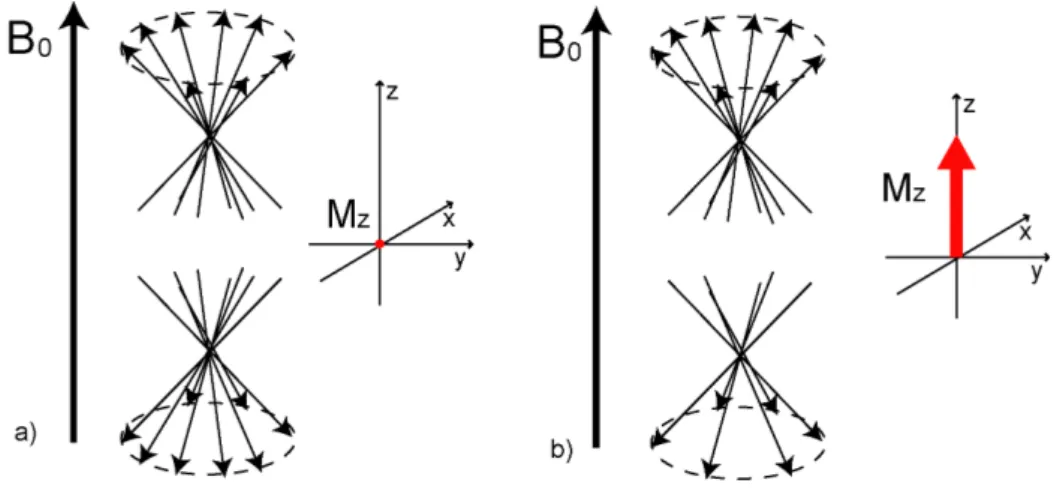
The NMR phenomenon is related to the existence of nuclear paramagnetism caused by the orientation of the individual nuclear magnetic moments µ! in the presence of an external static magnetic field B!0. The magnetic moment of a nucleus µ! is proportional to the nuclear spin angular momentum I! according to
I!
" !
γ
µ = (1)!
where γ is the magnetogyric ratio of the nucleus and ! is Planck’s constant divided by 2π. In contrast with the electron, whose spin number I always equals ½, the nuclear spin number I of a nuclei XA
Z depends on the mass number A and the charge number Z such as:
•! If A is odd, then I is an half integer (1H, 13C, 27Al, 23Na); •! If A is even and Z is odd, then I is an integer (14N, 2H);