Minerva Urologica e Nefrologica
EDIZIONI MINERVA MEDICA
ARTICLE ONLINE FIRSTThis provisional PDF corresponds to the article as it appeared upon acceptance. A copyedited and fully formatted version will be made available soon.
The final version may contain major or minor changes.
Subscription: Information about subscribing to Minerva Medica journals is online at: http://www.minervamedica.it/en/how-to-order-journals.php
Reprints and permissions: For information about reprints and permissions send an email to: [email protected] - [email protected] - [email protected]
Assessment of local tumor ablation and non-interventional
management versus partial nephrectomy in T1a renal cell
carcinoma
Carlotta PALUMBO, Francesco Alessandro MISTRETTA, Sophie KNIPPER, Elio MAZZONE, Angela PECORARO, Zhe TIAN, Paul PERROTTE, Alessandro
ANTONELLI, Francesco MONTORSI, Shahrokh F. SHARIAT, Fred SAAD, Claudio SIMEONE, Alberto BRIGANTI, Luke LAVALLEE, Pierre I KARAKIEWICZ
Minerva Urologica e Nefrologica
DOI: 10.23736/S0393-2249.19.03496-9 Article type: Original article
© 2019 EDIZIONI MINERVA MEDICA Article first published online:
Manuscript accepted: August 2, 2019 Manuscript revised: July 10, 2019 Manuscript received: April 16, 2019
Assessment of local tumor ablation and non-interventional management versus partial nephrectomy in T1a renal cell carcinoma
Authors
Carlotta PALUMBO1,2*, Francesco A. MISTRETTA1,3, Sophie KNIPPER1,4, Elio MAZZONE1,5, Angela PECORARO1,6, Zhe TIAN1, Paul PERROTTE7, Alessandro ANTONELLI2, Francesco MONTORSI5, Shahrokh F. SHARIAT8,9,10,11,12, Fred SAAD1,6, Claudio SIMEONE2, Alberto BRIGANTI5, Luke T. LAVALLEE13 and Pierre I. KARAKIEWICZ1,6.
Affiliations
1 Cancer Prognostics and Health Outcomes Unit, University of Montreal Health Center, Montreal,
Quebec, Canada
2 Urology Unit, ASST Spedali Civili of Brescia. Department of Medical and Surgical Specialties,
Radiological Science and Public Health, University of Brescia, Italy
3 Department of Urology, European Institute of Oncology, Milan, Italy
4 Martini Klinik, University Medical Center Hamburg-Eppendorf, Hamburg, Germany
5 Division of Experimental Oncology/Unit of Urology, Urological Research Institute (URI), IRCCS
San Raffaele Scientific Institute, Milan, Italy; Vita-Salute San Raffaele University, Milan, Italy
6 Department of Urology, San Luigi Gonzaga Hospital, University of Turin, Orbassano, Turin, Italy 7 Division of Urology, University of Montreal Hospital Center (CHUM), Montreal, Quebec, Canada 8 Department of Urology, Comprehensive Cancer Center, Medical University of Vienna, Vienna,
Austria
12 Institute for Urology and Reproductive Health, I.M. Sechenov First Moscow State Medical
University, Moscow, Russia
13 Division of Urology, The Ottawa Hospital, University of Ottawa and the Ottawa Hospital
Research Institute, Ottawa, Ontario, Canada
* Corresponding Author
Carlotta Palumbo, MD
Urology Unit, ASST Spedali Civili of Brescia. Department of Medical and Surgical Specialties, Radiological Science and Public Health, University of Brescia, Italy
Piazzale Spedali Civili 1, 25123, Brescia, Italy
Cancer Prognostics and Health Outcomes Unit, University of Montreal Health Center, Montreal, Québec, Canada.
Phone number: +393491289501 - Fax number: +390303995055 E-mail: [email protected]
Words count (abstract): 233 Words count (text): 2641 Tables: 4
Figures: 2
Abstract Background
Local tumor ablation (LTA) and non-interventional management (NIM) emerged as alternative management options for T1a renal cell carcinoma (RCC). We investigated trends and cancer-specific mortality (CSM) after LTA and NIM, compared to partial nephrectomy (PN).
Methods
Within the Surveillance, Epidemiology, and End Results database (2004-2015), T1a RCC patients treated with PN, LTA or NIM were identified. Estimated annual proportion change methodology (EAPC), 1:1 ratio propensity score (PS) matching, cumulative incidence plots and multivariable competing risks regression models (CRR) were used to compare LTA vs PN and NIM vs PN. Subgroup analyses focused on patients <65 and ≥65years.
Results
Overall 4,524 patients underwent LTA vs 1,654 NIM vs 25,435 PN. Annuals rates increased for NIM (EAPC: +3.3%, p<0.001), but not for either LTA or PN. After PS-matching in multivariable CCR, LTA (HR 1.9, p<0.001) and NIM (HR 3.0, p<0.001) showed worse 5-year CSM, relative to PN. In subgroup analyses, LTA showed no CSM disadvantage relative to PN in younger patients (HR 2.0, p=0.07). In older patients 1.64-fold CSM increase was recorded. Conversely, NIM younger (HR 3.1, p=0.001) and older (HR 3.1, p<0.001) patients exhibited higher CSM relative to PN.
Conclusion
In T1a RCC patients, NIM rates showed a modest but significant increase, while LTA and PN rates remained stable. In survival analyses, LTA exhibited higher CSM rates only for elderly patients. Conversely, NIM exhibited higher CSM rates in both younger and older patients.
1. Introduction
Both European and North American guidelines 1,2 recommend partial nephrectomy (PN) as standard treatment for clinical stage T1a renal cell carcinoma (RCC), when technically feasible. In the last decade, both observation (non-interventional management, NIM) and ablative techniques (local tumor ablation, LTA) emerged as alternative approaches for either elderly patients or poor surgical candidates 3–6.
Data regarding LTA versus nephrectomy originating from 7 institutional studies (from 1998 to 2012) formed the basis of a recent meta-analysis 7, which showed a 3.4-fold increase of cancer specific mortality (CSM) when LTA was performed instead of partial (PN) or radical nephrectomy (RN). Conversely, of five population based studies 8–12, only one 9 showed worse CSM for LTA
relative to PN. However, their historic nature represents a limitation; the most recent included patients diagnosed from 2004 to 2013 12. Moreover, with the exception of SEER-Medicare studies 10,11 that exclusively focused on patients older than 65 years, no stratification was performed according to age. Finally, only two studies relied on competing risks regression 9,11.
Very similar limitations apply to NIM. Only two institutional studies compared NIM to either RN or PN 13,14. Both found no differences in 5-year CSM. Conversely, data from four population based studies that relied on patients treated from 1988 to 2011 with either NIM or surgery 15–19 reported significantly worse 5-year CSM for NIM. However, the disadvantage of NIM disappeared, when only patients older than 75 years 16 or those at higher cardiovascular risk 18 were compared. Only one 11 of the four population based studies specifically compared NIM to PN. Finally, only two 17,19 of four relied on competing risks regression models that account for other-cause mortality (OCM)
and for elderly patients.
Taken together, no contemporary data allows to ascertain whether LTA or NIM might predispose T1a patients to higher CSM relative to PN. This lack of comparative data is particularly important for elderly individuals who are at high risk of OCM. To address this unmet need, we hypothesized that no CSM disadvantage exists when contemporary LTA or NIM are used in elderly
individuals, especially when OCM is accounted for. We tested our hypothesis in the 2004-2015 version of the SEER database and relied on multivariable competing risks models adjusted for OCM in addition to detailed propensity-score adjustment.
2. Materials and Methods
2.1 Data source and patient selection
Within the SEER databases (2004 to 2015) 20, we focused on patients aged 18 years or older
with non-metastatic T1a histologically confirmed RCC (International Classification of Disease for Oncology [ICD-O] site codes C64.9). We only included patients submitted to no local treatment, local tumor ablation or partial nephrectomy, as primary treatment.
Death was defined according to the SEER mortality code, as either cancer specific mortality (CSM, death from RCC) or other cause mortality (OCM, death from any other causes). All autopsy or death certificate cases and those with missing follow-up data were excluded.
2.2 Statistical analyses
Statistical analyses consisted of four analytical steps. First, we evaluated overall rates of NIM, LTA and PN. Second, we examined the estimated annual percentage changes (EAPCs) for NIM, LTA and PN in the overall population and according to age groups (<65 and ≥65 years). Third, we relied on 1:1 propensity score (PS) matching according to the nearest neighbor to minimize differences that may distinguish LTA or NIM patients from their PN counterparts. The PS-matched cohorts (LTA vs PN and NIM vs PN) were balanced according to age at diagnosis, gender, race, year of diagnosis, population density, marital status, socioeconomic status, tumor grade, histology and tumor size. In the fourth step, we relied on PS-matched comparisons between LTA vs PN and NIM vs PN. Specifically, cumulative incidence plots depicted CSM and OCM rates. The statistical significance of CSM and OCM difference was tested with the Gray test. Finally, we relied on PS-matched data for purpose of multivariable comparisons between LTA vs PN and NIM vs PN. Specifically, multivariable competing risks regression models (CRR) predicted CSM and OCM according to treatment type. Adjustment variables consisted of age at diagnosis, gender, race, year of diagnosis, population density, marital status, socioeconomic status, tumor grade, histology and tumor size. Subgroups analyses according to age (<65 and ≥65 years) were performed for the comparison between LTA vs PN and NIM vs PN.
All statistical tests were two-sided with a level of significance set at p < 0.05. Analyses were performed using the R software environment for statistical computing and graphics (version 3.4.1; http://www.r-project. org/).
3. Results
3.1 Patient and tumor characteristics
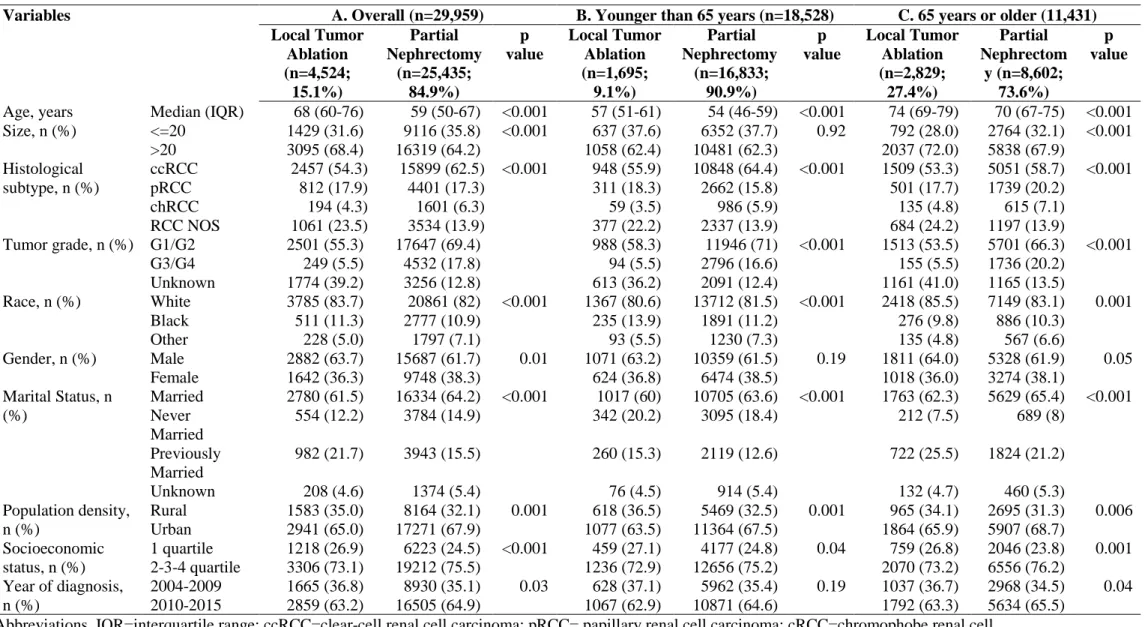
The comparison between LTA and PN prior to any matching relied on 4,524 (15.1%) LTA and 25,435 (84.9%) PN patients (Table 1). Relative to PN patients, LTA patients were older (median age 68 vs 59 years, p<0.001), and less frequently treated in more contemporary years (for period 2010-2015, 63.2 vs 64.9%, p<0.001).
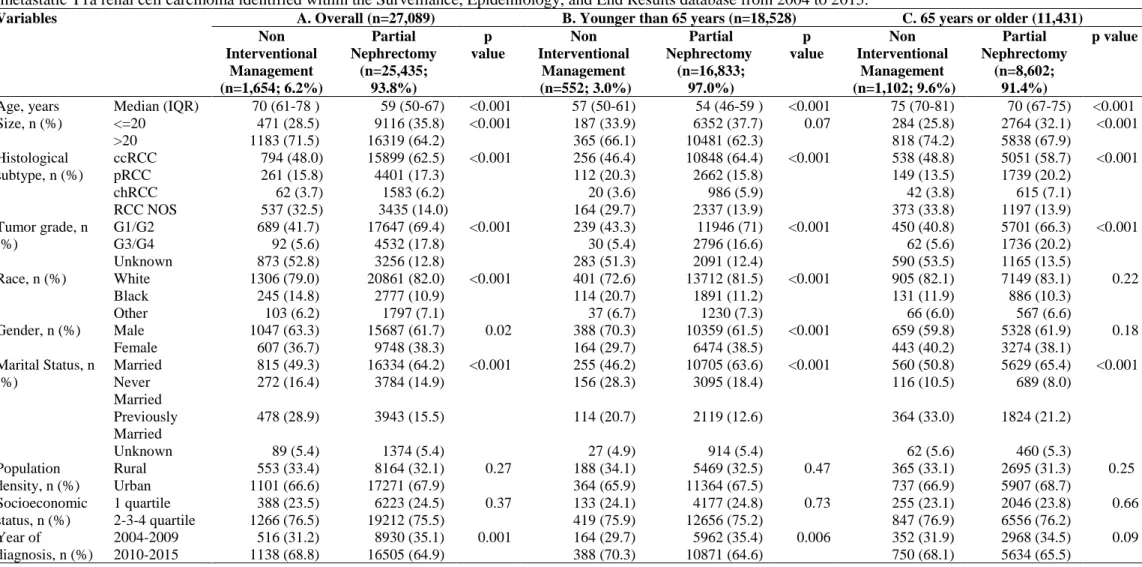
The comparison NIM versus PN prior to any matching relied on 1,654 (6.2%) NIM patients and 25,435 (93.8%) PN patients (Table 2). Relative to PN patients, NIM patients were older (median age 70 vs 59 years, p<0.001) and more frequently treated in the more contemporary years (for period 2010-2015, 68.8 vs 64.9%, p<0.001).
3.2 Analyses based on annual rates of treatment types
In the overall population, the absolute rates of LTA changed from 11.2 to 15.6% (EAPC: +0.4%, p = 0.71), those of NIM changed from 4.1 to 6.4% (EAPC: +3.3%, p<0.001) and those for PN from 84.7 to 78% (EAPC: -0.3%, p = 0.18). Virtually the same treatment rates were recorded, when data were stratified according to age <65 and ≥65 years.
3.3 Matched cumulative incidence plots and multivariable competing risks regression models: comparison between local tumor ablation vs. partial nephrectomy
After 1:1 PS-matching, no statistically significant differences remained between LTA and PN patients (n=4,307 LTA vs n=4,307 PN patients in the overall cohort; n=1,693 LTA vs n=1,693 PN in patients aged <65 years; n=2,584 LTA vs n=2,584 PN in patients aged ≥65 years).
In the overall matched cohort, year CSM rates were 2.6% vs. 1.1% (p=0.004) and five-year OCM rates were 8.4 vs. 5.8% (p<0.001), for respectively LTA and PN patients (Figure 1A). In the subgroup aged <65 years, five-year CSM rates were 1.0 vs. 0.8% (p=0.4) and five-year OCM rates of 5.7 vs. 3.1% (p<0.001), for respectively LTA and PN patients (Figure 1B). In the subgroup aged ≥65 years, five-year CSM rates were 3.4 vs 1.4% (p=0.001) and five-year OCM rates were 9.9 vs 7.4% (p=0.001), for respectively LTA and PN patients (Figure 1C).
In PS-adjusted multivariable competing risks regression models (Table 3), in the overall cohort LTA independently predicted higher CSM in the overall cohort (HR: 1.6, p=0.003) and higher OCM (HR: 1.5, p<0.001), relative to PN. In the subgroup aged <65 years, LTA independently predicted higher OCM (HR: 1.7, p<0.001), but not CSM (HR: 1.3, p=0.5). Finally, in the subgroup aged ≥65 years, LTA independently predicted higher CSM (HR: 1.8, p=0.002) and OCM (HR: 1.3, p=0.003).
3.4 Matched cumulative incidence plots and multivariable competing risks regression models: comparison between non-invasive management and partial nephrectomy
After 1:1 PS-matching, no statistically significant differences remained between NIM and PN patients (n=1,556 NIM vs. n= 1,556 PN patients in the overall cohort; n=541 NIM vs. n=541 PN patients in the subgroup aged <65 years; n=998 NIM vs. n=998 PN patients in the subgroup aged ≥65 years).
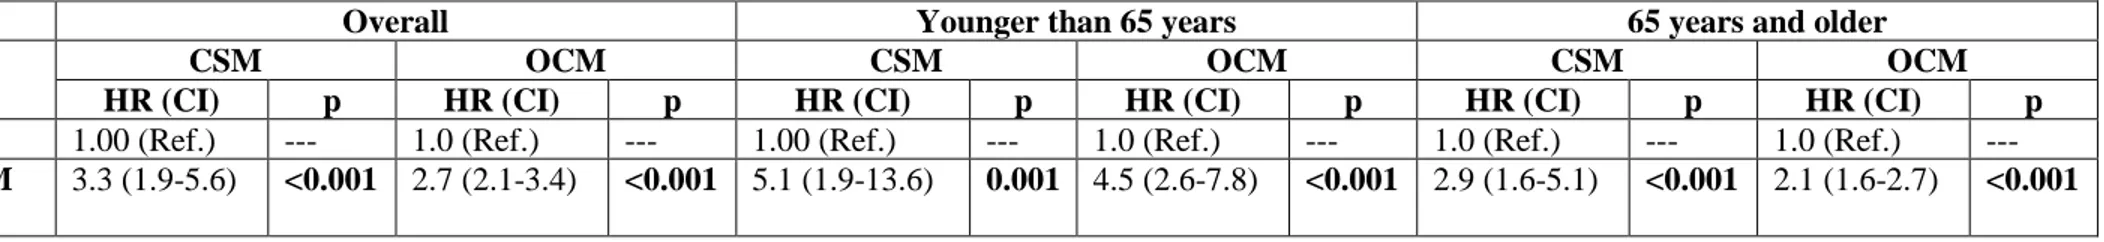
In the overall matched cohort, five-year CSM rates were 5.9 vs. 1.3% (p<0.001) and five-year OCM rates of 17.3 vs. 4.8% (p<0.001), for respectively NIM vs PN (Figure 2A). In the subgroup aged <65 years, five-year CSM rates were 4.2 vs. 0.3% (p<0.001) and five-year OCM rates were 13.9 vs 2.8% (p<0.001), for respectively NIM vs PN (Figure 2B). In subgroup aged ≥65 years, five-year CSM rates were 6.5 vs. 1.4% (p<0.001) and five-year OCM rates were 19.0 vs. 8.2% (p<0.001), for respectively NIM vs PN (Figure 2C). In PS-adjusted multivariable competing risks regression models (Table 4), in the overall cohort, NIM independently predicted higher CSM (HR: 3.0, p<0.001) and OCM (HR: 2.7, p<0.001) relative to PN. Similarly, NIM independently predicted higher CSM and OCM in the subgroup aged <65 years (HR: 3.1, p<0.001 and HR: 3.8, p<0.001, respectively) and in the subgroup aged ≥65 years (HR: 3.1, p<0.001 and HR: 2.0, p<0.001, respectively).
4. Discussion
We hypothesized that contemporary patient selection for LTA or NIM does not result in higher CSM than after PN, in younger and especially in elderly individuals at an elevated risk of OCM. Our population-based analysis represents the most contemporary comparison between LTA or NIM and PN, with specific subgroup analyses focusing on younger vs older patients and with specific adjustment for OCM within CRR models. Our study resulted in several noteworthy findings.
First, the rates of NIM and LTA in subgroups aged <65 years and ≥65 years were significantly different. Specifically, the proportions of NIM and LTA patients was 3-fold higher in elderly patients than in younger patients. This indicates that age has an important effect on treatment type assignment. The rates recorded in the current study were similar to those reported previously. In previous reports, LTA rates ranged from 8.8% and 18%9–11,16,17,19. However, in none of those previous reports, treatment assignment was analyzed according to age cut-off. In consequence, age-specific comparisons were not possible.
Second, regarding sociodemographic characteristics, both LTA and NIM patients were significantly older compared to PN patients, as in all previous population-based studies. Moreover, both LTA and NIM patients were more likely to be African-American. A SEER database study21 on individuals diagnosed from 1988 to 2008 showed that African-American patients were 23% more likely to undergo LTA or NLT instead of nephrectomy.
Third regarding tumor characteristics, individuals treated with either LTA or NIM exhibited a significantly higher proportion of unspecified histology and of unknown tumor grade. These observations are expected and consistent with needle-biopsy derived histological subtype and tumor grade assignment 22. However, rather unexpectedly a larger proportion (68.4% vs 64.2%) of LTA patients than PN patients harbored tumors greater than 2 cm. Indeed, according to the National Comprehensive Cancer Network guidelines, LTA is not recommended for lesions than 3 cm 2, because of increasing risk of both recurrence and cancer-specific mortality 23. However, this finding
is consistent with other reports. This finding is also consistent with other reports form SEER12 (mean size of 24.6 mm for LTA) and SEER-Medicare10 (36% of NIM measured 3 cm or more).
Fourth, regarding annual rates, LTA use increased from 11.2 to 15.6%, but not in a statistically significant fashion. Conversely, NIM rates increased marginally from 4.6 to 6.2%. This increase achieved statistical significance, but its clinical importance is limited. Previous studies on more historical SEER database24,25 have shown a significant increase in trends of both NIM and LTA starting from 2004. To the best of our knowledge, no other more contemporary studies reported on annual rates of LTA and NIM use.
Fifth, in the final part of the analysis we focused on potential CSM disadvantages that might be associated with the use of LTA or NIM, relative to PN. Since LTA and NIM patients are in general different with respect to sociodemographics and tumor characteristics from PN patients, we relied on PS-matching to maximally decrease such differences and associated selection biases. Moreover, we relied on CRR models which allow to control for OCM. This step might be particularly important in elderly patients, where an important probability of death may be attributable to non-cancer causes26.
In PS-adjusted comparisons between LTA and PN, the multivariable CRR models showed a 2-fold increase in CSM rate, when LTA was used. After stratification according to age, the CSM disadvantage disappeared in individuals <65 years, but persisted in those ≥65 years, however at a lower rate (HR 1.8). It is of note that the corresponding five-year OCM rates were respectively 8.4%, 5.7% and 9.9% for the entire cohort, the subgroup aged <65 and the subgroup aged ≥65 years. Our findings are in agreement with Whitson et al 9, who reported a 2-fold increase in CSM after LTA vs
nephrectomy (HR 1.9, p=0.02) within a more historical SEER cohort (1998-2007). Conversely, Xing et al 11 found no CSM disadvantage for LTA vs PN in a more recent SEER cohort (2002-2011). Their
models, accounted for possible differences in tumor biology and OCM that may exist between younger and older patients. Therefore, the residual difference in CSM may originate from differences in treatment efficacy between LTA and PN. However, we were unable to adjust for subsequent therapies that may have been delivered to patients with disease recurrence and/or progression, such as surgery, radiation and/or medical therapies. It is possible that elderly patients benefitted of fewer opportunities for treatment of recurrence and/or progression, relative to younger patients. In consequence, the differences in LTA and PN in young patients may have been obliterated by the differential use of these subsequent therapies that favored younger patients.
In PS-adjusted comparisons between NIM vs PN, the CRR models showed a 3-fold higher CSM for NIM, which was equally operational in younger and older patients, when subgroup analyses were performed. Our results are in agreement with previous studies 18,19, which showed a lower rates of death due to RCC for surgery compared to NIM (HR 0.4, p<0.001 and HR 0.6, p<0.01, respectively). However, both studies relied on historical SEER-Medicare database, including patients from 1991 to 2007.
Our study resulted in several important take home messages. First, the rates of NIM are the lowest and increased marginally. This observation indicates that a marginal proportion of patients are selected for NIM, in agreement with guidelines. The rates of LTA are intermediate and have not increased over time. This observation is in disagreement with guidelines, especially in younger patients, where LTA is not recommended. Moreover, an unexpectedly elevated proportion of patients with tumor size greater than 3 cm are selected for NIM. Second, regarding CSM, no disadvantage was recorded for younger patients and a modest CSM disadvantage was recorded for elderly patients selected for LTA, relative to PN, suggesting an adequate LTA selection process. Conversely, a different scenario applied to NIM. Here, a CSM disadvantage applied to younger and to older patients that were selected for NIM instead of PN. However, OCM rates that were substantially higher in NIM patients emphasized the important difference that exists between NIM and PN patients. From a clinical perspective, LTA may be considered as an alternative to surgery in T1a RCC patients, due to
a modest CSM disadvantage. Conversely, NIM is associated with an increased risk of CSM. Therefore, NIM may be reserved for patients at elevated risk for OCM, for whom the morbidity associated with surgery may be higher.
Despite its strengths, significant limitations of this study need to be acknowledged, as the retrospective nature, absence of comorbidities information, inability to assess whether NIM patients were observed with an active surveillance protocol vs watchful waiting without intent for cure, the lack of standardized specimen handling, as well as of central review regarding histological subtype, and the lack of data regarding earlier cancer control endpoints, such as local recurrence and disease free survival. Nonetheless, our analyses relied on PS matching to maximally reduce biases and on competing risks regression models adjusted for OCM.
5. Conclusion
In T1a RCC patients, NIM rates showed a modest but significant increase, while LTA and PN rates remained stable. In survival analyses, LTA exhibited higher CSM rates only for elderly patients. Conversely, NIM exhibited higher CSM rates in both younger and older patients.
References
1. Ljungberg B, Albiges L, Abu-Ghanem Y, Bensalah K, Dabestani S, Montes SF-P, et al. European Association of Urology Guidelines on Renal Cell Carcinoma: The 2019 Update. Eur Urol. 2019 Feb Available from:
https://linkinghub.elsevier.com/retrieve/pii/S0302283819301526
2. Motzer RJ, Jonasch E, Fishman M, Gallagher TH, McDonald A, Michaelson MD, et al. NCCN Guidelines Index Table of Contents Discussion. Kidney Cancer. 2018;59.
3. Zargar H, Atwell TD, Cadeddu JA, de la Rosette JJ, Janetschek G, Kaouk JH, et al.
Cryoablation for Small Renal Masses: Selection Criteria, Complications, and Functional and Oncologic Results. Eur Urol. 2016 Jan;69(1):116–28.
4. Pierorazio PM, Johnson MH, Patel HD, Sozio SM, Sharma R, Iyoha E, et al. Management of Renal Masses and Localized Renal Cancer: Systematic Review and Meta-Analysis. J Urol. 2016 Oct;196(4):989–99.
5. Joniau S, Tsivian M, Gontero P. Radiofrequency ablation for the treatment of small renal masses: safety and oncologic efficacy. Minerva Urol E Nefrol Ital J Urol Nephrol. 2011 Sep;63(3):227–36.
6. Jorns JJ, Thiel DD, Castle EP. Update on contemporary management of clinically localized renal cell carcinoma. Minerva Urol E Nefrol Ital J Urol Nephrol. 2012 Dec;64(4):261–72.
7. Rivero JR, De La Cerda J, Wang H, Liss MA, Farrell AM, Rodriguez R, et al. Partial COPYRIGHT© EDIZIONI MINERVA MEDICA
8. Choueiri TK, Schutz FAB, Hevelone ND, Nguyen PL, Lipsitz SR, Williams SB, et al. Thermal ablation vs surgery for localized kidney cancer: a Surveillance, Epidemiology, and End Results (SEER) database analysis. Urology. 2011 Jul;78(1):93–8.
9. Whitson JM, Harris CR, Meng MV. Population-based comparative effectiveness of nephron-sparing surgery vs ablation for small renal masses: COMPARATIVE EFFECTIVENESS OF NSS VS ABLATION. BJU Int. 2012 Nov;110(10):1438–43.
10. Talenfeld AD, Gennarelli RL, Elkin EB, Atoria CL, Durack JC, Huang WC, et al.
Percutaneous Ablation Versus Partial and Radical Nephrectomy for T1a Renal Cancer: A Population-Based Analysis. Ann Intern Med. 2018 Jul 17;169(2):69–77.
11. Xing M, Kokabi N, Zhang D, Ludwig JM, Kim HS. Comparative Effectiveness of Thermal Ablation, Surgical Resection, and Active Surveillance for T1a Renal Cell Carcinoma: A Surveillance, Epidemiology, and End Results (SEER)–Medicare-linked Population Study. Radiology. 2018 Jul;288(1):81–90.
12. Zhou M, Mills A, Noda C, Ramaswamy R, Akinwande O. SEER study of ablation versus partial nephrectomy in cT1A renal cell carcinoma. Future Oncol. 2018 Jul;14(17):1711–9.
13. Lane BR, Abouassaly R, Gao T, Weight CJ, Hernandez AV, Larson BT, et al. Active
treatment of localized renal tumors may not impact overall survival in patients aged 75 years or older. Cancer. 2010 May 10;116(13):3119–26.
14. Pierorazio PM, Johnson MH, Ball MW, Gorin MA, Trock BJ, Chang P, et al. Five-year Analysis of a Multi-institutional Prospective Clinical Trial of Delayed Intervention and Surveillance for Small Renal Masses: The DISSRM Registry. Eur Urol. 2015 Sep;68(3):408– 15.
15. Zini L, Perrotte P, Jeldres C, Capitanio U, Duclos A, Jolivet‐Tremblay M, et al. A population-based comparison of survival after nephrectomy vs nonsurgical management for small renal masses. BJU Int. 2009 Apr 1;103(7):899–904.
16. Sun M, Becker A, Tian Z, Roghmann F, Abdollah F, Larouche A, et al. Management of Localized Kidney Cancer: Calculating Cancer-specific Mortality and Competing Risks of Death for Surgery and Nonsurgical Management. Eur Urol. 2014 Jan;65(1):235–41.
17. Patel HD, Kates M, Pierorazio PM, Hyams ES, Gorin MA, Ball MW, et al. Survival After Diagnosis of Localized T1a Kidney Cancer: Current Population-based Practice of Surgery and Nonsurgical Management. Urology. 2014 Jan;83(1):126–33.
18. Patel HD, Kates M, Pierorazio PM, Allaf ME. Balancing cardiovascular (CV) and cancer death among patients with small renal masses: modification by CV risk: CV risk and treatment strategy among older patients with SRMs. BJU Int. 2015 Jan;115(1):58–64.
19. Larcher A, Trudeau V, Dell’Oglio P, Tian Z, Boehm K, Fossati N, et al. Prediction of Competing Mortality for Decision-making Between Surgery or Observation in Elderly Patients With T1 Kidney Cancer. Urology. 2017 Apr;102:130–7.
20. About the SEER Program [Internet]. SEER. [cited 2019 January]. Available from: https://seer.cancer.gov/about/overview.html
21. Becker A, Roghmann F, Trinh Q-D, Hansen J, Tian Z, Shariat SF, et al. Sociodemographic disparities in the treatment of small renal masses: Disparities in small renal masses. BJU Int.
23. Palumbo C, Cyr SJ, Mazzone E, Mistretta FA, Knipper S, Pecoraro A, et al. Impact of tumor size on cancer-specific mortality rate after local tumor ablation in T1a renal-cell carcinoma. J Endourol. 2019 May 17.
24. Drangsholt S, Huang WC. Current Trends in Renal Surgery and Observation for Small Renal Masses. Urol Clin North Am. 2017 May;44(2):169–78.
25. Tan H-J, Filson CP, Litwin MS. Contemporary, age-based trends in the incidence and
management of patients with early-stage kidney cancer. Urol Oncol Semin Orig Investig. 2015 Jan;33(1):21.e19-21.e26.
26. Vartolomei MD, Matei DV, Renne G, Tringali VM, Crișan N, Musi G, et al. Long-term oncologic and functional outcomes after robot-assisted partial nephrectomy in elderly patients. Minerva Urol E Nefrol Ital J Urol Nephrol. 2019 Feb;71(1):31–7.
Notes Conflict of interest None Funding None Authors’ contribution
All authors provided critical feedback and helped shape the research, analysis and manuscript. Congresses
None
Acknowledgement None
Table 1. Descriptive characteristics of 29,959 patients treated with either local tumor ablation (n = 4,524) or partial nephrectomy (n = 25,435) for non-metastatic T1a renal cell carcinoma identified within the Surveillance, Epidemiology, and End Results database from 2004 to 2015.
Variables A. Overall (n=29,959) B. Younger than 65 years (n=18,528) C. 65 years or older (11,431) Local Tumor Ablation (n=4,524; 15.1%) Partial Nephrectomy (n=25,435; 84.9%) p value Local Tumor Ablation (n=1,695; 9.1%) Partial Nephrectomy (n=16,833; 90.9%) p value Local Tumor Ablation (n=2,829; 27.4%) Partial Nephrectom y (n=8,602; 73.6%) p value
Age, years Median (IQR) 68 (60-76) 59 (50-67) <0.001 57 (51-61) 54 (46-59) <0.001 74 (69-79) 70 (67-75) <0.001 Size, n (%) <=20 1429 (31.6) 9116 (35.8) <0.001 637 (37.6) 6352 (37.7) 0.92 792 (28.0) 2764 (32.1) <0.001 >20 3095 (68.4) 16319 (64.2) 1058 (62.4) 10481 (62.3) 2037 (72.0) 5838 (67.9) Histological subtype, n (%) ccRCC 2457 (54.3) 15899 (62.5) <0.001 948 (55.9) 10848 (64.4) <0.001 1509 (53.3) 5051 (58.7) <0.001 pRCC 812 (17.9) 4401 (17.3) 311 (18.3) 2662 (15.8) 501 (17.7) 1739 (20.2) chRCC 194 (4.3) 1601 (6.3) 59 (3.5) 986 (5.9) 135 (4.8) 615 (7.1) RCC NOS 1061 (23.5) 3534 (13.9) 377 (22.2) 2337 (13.9) 684 (24.2) 1197 (13.9) Tumor grade, n (%) G1/G2 2501 (55.3) 17647 (69.4) 988 (58.3) 11946 (71) <0.001 1513 (53.5) 5701 (66.3) <0.001 G3/G4 249 (5.5) 4532 (17.8) 94 (5.5) 2796 (16.6) 155 (5.5) 1736 (20.2) Unknown 1774 (39.2) 3256 (12.8) 613 (36.2) 2091 (12.4) 1161 (41.0) 1165 (13.5) Race, n (%) White 3785 (83.7) 20861 (82) <0.001 1367 (80.6) 13712 (81.5) <0.001 2418 (85.5) 7149 (83.1) 0.001 Black 511 (11.3) 2777 (10.9) 235 (13.9) 1891 (11.2) 276 (9.8) 886 (10.3) Other 228 (5.0) 1797 (7.1) 93 (5.5) 1230 (7.3) 135 (4.8) 567 (6.6) Gender, n (%) Male 2882 (63.7) 15687 (61.7) 0.01 1071 (63.2) 10359 (61.5) 0.19 1811 (64.0) 5328 (61.9) 0.05 Female 1642 (36.3) 9748 (38.3) 624 (36.8) 6474 (38.5) 1018 (36.0) 3274 (38.1) Marital Status, n (%) Married 2780 (61.5) 16334 (64.2) <0.001 1017 (60) 10705 (63.6) <0.001 1763 (62.3) 5629 (65.4) <0.001 Never Married 554 (12.2) 3784 (14.9) 342 (20.2) 3095 (18.4) 212 (7.5) 689 (8) Previously Married 982 (21.7) 3943 (15.5) 260 (15.3) 2119 (12.6) 722 (25.5) 1824 (21.2) Unknown 208 (4.6) 1374 (5.4) 76 (4.5) 914 (5.4) 132 (4.7) 460 (5.3) Population density, n (%) Rural 1583 (35.0) 8164 (32.1) 0.001 618 (36.5) 5469 (32.5) 0.001 965 (34.1) 2695 (31.3) 0.006 Urban 2941 (65.0) 17271 (67.9) 1077 (63.5) 11364 (67.5) 1864 (65.9) 5907 (68.7) Socioeconomic status, n (%) 1 quartile 1218 (26.9) 6223 (24.5) <0.001 459 (27.1) 4177 (24.8) 0.04 759 (26.8) 2046 (23.8) 0.001 2-3-4 quartile 3306 (73.1) 19212 (75.5) 1236 (72.9) 12656 (75.2) 2070 (73.2) 6556 (76.2) Year of diagnosis, n (%) 2004-2009 1665 (36.8) 8930 (35.1) 0.03 628 (37.1) 5962 (35.4) 0.19 1037 (36.7) 2968 (34.5) 0.04 2010-2015 2859 (63.2) 16505 (64.9) 1067 (62.9) 10871 (64.6) 1792 (63.3) 5634 (65.5)
Abbreviations. IQR=interquartile range; ccRCC=clear-cell renal cell carcinoma; pRCC= papillary renal cell carcinoma; cRCC=chromophobe renal cell carcinoma; RCC NOS=renal cell carcinoma not otherwise specified
Table 2. Descriptive characteristics of 27,089 patients treated with either interventional management (n = 1,654) or partial nephrectomy (n = 25,435) for non-metastatic T1a renal cell carcinoma identified within the Surveillance, Epidemiology, and End Results database from 2004 to 2015.
Variables A. Overall (n=27,089) B. Younger than 65 years (n=18,528) C. 65 years or older (11,431)
Non Interventional Management (n=1,654; 6.2%) Partial Nephrectomy (n=25,435; 93.8%) p value Non Interventional Management (n=552; 3.0%) Partial Nephrectomy (n=16,833; 97.0%) p value Non Interventional Management (n=1,102; 9.6%) Partial Nephrectomy (n=8,602; 91.4%) p value
Age, years Median (IQR) 70 (61-78 ) 59 (50-67) <0.001 57 (50-61) 54 (46-59 ) <0.001 75 (70-81) 70 (67-75) <0.001 Size, n (%) <=20 471 (28.5) 9116 (35.8) <0.001 187 (33.9) 6352 (37.7) 0.07 284 (25.8) 2764 (32.1) <0.001 >20 1183 (71.5) 16319 (64.2) 365 (66.1) 10481 (62.3) 818 (74.2) 5838 (67.9) Histological subtype, n (%) ccRCC 794 (48.0) 15899 (62.5) <0.001 256 (46.4) 10848 (64.4) <0.001 538 (48.8) 5051 (58.7) <0.001 pRCC 261 (15.8) 4401 (17.3) 112 (20.3) 2662 (15.8) 149 (13.5) 1739 (20.2) chRCC 62 (3.7) 1583 (6.2) 20 (3.6) 986 (5.9) 42 (3.8) 615 (7.1) RCC NOS 537 (32.5) 3435 (14.0) 164 (29.7) 2337 (13.9) 373 (33.8) 1197 (13.9) Tumor grade, n (%) G1/G2 689 (41.7) 17647 (69.4) <0.001 239 (43.3) 11946 (71) <0.001 450 (40.8) 5701 (66.3) <0.001 G3/G4 92 (5.6) 4532 (17.8) 30 (5.4) 2796 (16.6) 62 (5.6) 1736 (20.2) Unknown 873 (52.8) 3256 (12.8) 283 (51.3) 2091 (12.4) 590 (53.5) 1165 (13.5) Race, n (%) White 1306 (79.0) 20861 (82.0) <0.001 401 (72.6) 13712 (81.5) <0.001 905 (82.1) 7149 (83.1) 0.22 Black 245 (14.8) 2777 (10.9) 114 (20.7) 1891 (11.2) 131 (11.9) 886 (10.3) Other 103 (6.2) 1797 (7.1) 37 (6.7) 1230 (7.3) 66 (6.0) 567 (6.6) Gender, n (%) Male 1047 (63.3) 15687 (61.7) 0.02 388 (70.3) 10359 (61.5) <0.001 659 (59.8) 5328 (61.9) 0.18 Female 607 (36.7) 9748 (38.3) 164 (29.7) 6474 (38.5) 443 (40.2) 3274 (38.1) Marital Status, n (%) Married 815 (49.3) 16334 (64.2) <0.001 255 (46.2) 10705 (63.6) <0.001 560 (50.8) 5629 (65.4) <0.001 Never Married 272 (16.4) 3784 (14.9) 156 (28.3) 3095 (18.4) 116 (10.5) 689 (8.0) Previously Married 478 (28.9) 3943 (15.5) 114 (20.7) 2119 (12.6) 364 (33.0) 1824 (21.2) Unknown 89 (5.4) 1374 (5.4) 27 (4.9) 914 (5.4) 62 (5.6) 460 (5.3) Population density, n (%) Rural 553 (33.4) 8164 (32.1) 0.27 188 (34.1) 5469 (32.5) 0.47 365 (33.1) 2695 (31.3) 0.25 Urban 1101 (66.6) 17271 (67.9) 364 (65.9) 11364 (67.5) 737 (66.9) 5907 (68.7) Socioeconomic status, n (%) 1 quartile 388 (23.5) 6223 (24.5) 0.37 133 (24.1) 4177 (24.8) 0.73 255 (23.1) 2046 (23.8) 0.66 2-3-4 quartile 1266 (76.5) 19212 (75.5) 419 (75.9) 12656 (75.2) 847 (76.9) 6556 (76.2)
Table 3. Propensity score adjusted multivariable competing risk regression models predicting cancer-specific mortality (CSM) and other-cause mortality (OCM) in T1a renal cell carcinoma treated with either local tumor ablation or partial nephrectomy.
All analyses were adjusted for age at diagnosis, gender, race, year of diagnosis, population density, marital status, socioeconomic status, tumor grade, histology and tumor size. Bold indicates p<0.05.
Abbreviations. CSM=cancer specific mortality; OCM=other-cause mortality; HR=hazard ratio; CI=95% confidence interval; PN=partial nephrectomy; LTA=local tumor ablation.
Overall Younger than 65 years 65 years and older
CSM OCM CSM OCM CSM OCM
HR (CI) p HR (CI) p HR (CI) p HR (CI) p HR (CI) p HR (CI) p PN 1.00 (Ref.) --- 1.0 (Ref.) --- 1.00 (Ref.) --- 1.0 (Ref.) --- 1.0 (Ref.) --- 1.0 (Ref.) ---
LTA 1.6 (1.2-2.2) 0.003 1.5 (1.3-1.7) <0.001 1.3 (0.6-2.6) 0.5 1.7 (1.3-2.4) <0.001 1.8 (1.2-2.7) 0.002 1.3 (1.1-1.6) 0.003
Table 4. Propensity score adjusted multivariable competing risks regression models predicting cancer-specific mortality (CSM) and other-cause mortality (OCM) in T1a renal cell carcinoma treated with either non-interventional management or partial nephrectomy.
All analyses were adjusted for age at diagnosis, gender, race, year of diagnosis, population density, marital status, socioeconomic status, tumor grade, histology and tumor size. Bold indicates p<0.05.
Abbreviations. CSM=cancer specific mortality; OCM=other-cause mortality; HR=hazard ratio; CI=95% confidence interval; PN=partial nephrectomy; NIM=non-interventional management.
Overall Younger than 65 years 65 years and older
CSM OCM CSM OCM CSM OCM
HR (CI) p HR (CI) p HR (CI) p HR (CI) p HR (CI) p HR (CI) p PN 1.00 (Ref.) --- 1.0 (Ref.) --- 1.00 (Ref.) --- 1.0 (Ref.) --- 1.0 (Ref.) --- 1.0 (Ref.) ---
NIM 3.3 (1.9-5.6) <0.001 2.7 (2.1-3.4) <0.001 5.1 (1.9-13.6) 0.001 4.5 (2.6-7.8) <0.001 2.9 (1.6-5.1) <0.001 2.1 (1.6-2.7) <0.001
Figure legends
Figure 1. Cumulative incidence plots depicting cancer-specific mortality (CSM) and other-cause mortality (OCM) rates in T1a renal cell carcinoma patients treated with either local tumor ablation or partial nephrectomy, in the overall cohort (A), subgroup of patients younger than 65 years (B) and subgroup of patients aged 65 years or older (C).
Figure 2. Cumulative incidence plots depicting cancer-specific mortality (CSM) and other-cause mortality (OCM) rates in T1a renal cell carcinoma patients treated with either non-interventional management or partial nephrectomy, in the overall cohort (A), subgroup of patients younger than 65 years (B) and subgroup of patients aged 65 years or older (C).