Alma Mater Studiorum – Università di Bologna
DOTTORATO DI RICERCA IN
INGEGNERIA BIOMEDICA, ELETTRICA E DEI SISTEMI
Ciclo XXX
Settore Concorsuale: 09/G2
Settore Scientifico Disciplinare: ING-INF/06
Computational modeling of human sinoatrial node:
what simulations tell us about pacemaking
Presentata da:
Alan FabbriCoordinatore Dottorato
Supervisore
Prof. Daniele Vigo
Stefano Severi, PhD
Alla mia famiglia,
che mi ha sempre sostenuto
Al nonno Lino
A Paola
…e a chi, seppure in sei ore,
le maratone le finisce
KEYWORDS
Cardiomyocytes
Computational models
Human sinoatrial node
Pacemaking modulation
Table of contents
GENERAL ABSTRACT 2 INTRODUCTION 5 PHD THESIS OUTLINE 8 REFERENCES 9 CHAPTER 1 DEVELOPMENT OF THE SINGLE CELL HUMAN SINOATRIAL NODE ACTION POTENTIAL MODEL 10 ABSTRACT 11 1.1 INTRODUCTION 12 1.2 METHODS 15 1.2.1 MODEL DEVELOPMENT 15 1.2.2 AUTOMATIC OPTIMIZATION PROCEDURE 16 1.2.3 CELL CAPACITANCE AND DIMENSIONS 17 1.2.4 MEMBRANE CURRENTS 17 1.2.4.1 FUNNY CURRENT (IF) 19 1.2.4.2 RAPID DELAYED RECTIFIER K+ CURRENT (IKR) 19 1.2.4.3 SLOW DELAYED RECTIFIER K+ CURRENT (IKS) 20 1.2.4.4 ULTRARAPID DELAYED RECTIFIER K+ CURRENT (IKUR) 20 1.2.4.5 TRANSIENT OUTWARD K+ CURRENT (ITO) 20 1.2.4.6 SODIUM/POTASSIUM PUMP CURRENT (INAK) 21 1.2.4.7 SODIUM CURRENT (INA) 21 1.2.4.8 T-TYPE CA2+ CURRENT (ICAT) 21 1.2.4.9 L-TYPE CA2+ CURRENT (ICAL) 21 1.2.4.10 SODIUM/CALCIUM EXCHANGE CURRENT (INACA) 22 1.2.5 CALCIUM HANDLING 22 1.2.5.1 SR CA2+ UPTAKE (JUP) 22 1.2.5.2 SR CA2+ RELEASE (JREL) 23 1.2.5.3 CA2+ DIFFUSION AND CA2+ BUFFERS 23 1.2.6 ION CONCENTRATIONS 23 1.2.7 SENSITIVITY ANALYSIS 24 1.2.8 CALIBRATION OF THE POPULATION OF MODELS 24 1.2.9 HARDWARE AND SOFTWARE 251.3 RESULTS 26
HUMAN SAN MODEL BEHAVIOUR IN BASAL CONDITIONS 26
1.3.1 SIMULATED AP AND CALCIUM TRANSIENT 26 1.3.2 IONIC CURRENTS DURING THE DD PHASE 30 1.3.3 SENSITIVITY ANALYSIS 31 1.3.4 CALIBRATION OF THE POPULATION OF MODELS 35 1.4 DISCUSSION 36 1.4.1 CONSTRUCTION OF THE MODEL 37 1.4.2 SENSITIVITY ANALYSIS AND CALIBRATION OF THE POPULATION OF MODELS 38 1.5 LIMITATIONS AND FUTURE DEVELOPMENTS 39 REFERENCES 40 CHAPTER 2
MODEL BASED ANALYSIS: EFFECTS OF If, Ca2+ HANDLING AND AUTONOMIC
SYSTEM MODULATION OF PACEMAKING 45
ABSTRACT 46
2.1 INTRODUCTION 48
2.2 METHODS 51
2.2.1 BLOCKADE OF FUNNY CURRENT (IF) AND NA+/CA2+ EXCHANGER CURRENT (INACA) 51
2.2.2 AUTONOMIC MODULATION 51 2.3 RESULTS 52 2.3.1 CONTRIBUTION OF IF TO PACEMAKING 52 2.3.2 CONTRIBUTION OF INACA TO PACEMAKING AND SPONTANEOUS CALCIUM OSCILLATIONS 54 2.3.3 AUTONOMIC MODULATION OF PACEMAKING 56 2.4 DISCUSSION 60 REFERENCES 63 CHAPTER 3 68 MODEL VALIDATION THROUGH THE SIMULATION OF ION CHANNEL MUTATIONS 68 ABSTRACT 69 3.1 INTRODUCTION 70 3.2 METHODS 72 3.2.1 FUNCTIONAL EFFECTS OF MUTATIONS 72 3.2.2 HCN4 MUTATIONS AND AUTONOMIC MODULATION 73
3.3 RESULTS 78 3.3.1 MODEL VALIDATION THROUGH THE SIMULATION OF ION CHANNEL MUTATIONS 78 3.3.2 EFFECTS OF IF MUTATIONS 80 3.3.3 HCN4 MUTATIONS AND AUTONOMIC MODULATION 81 3.3.4 EFFECTS OF INA MUTATIONS 83 3.3.5 EFFECTS OF IKS MUTATIONS 85 3.4 DISCUSSION 86 3.4.1 HCN4 MUTATIONS 86 3.4.2 SCN5A MUTATIONS 87 3.4.3 KCNQ1 MUTATIONS 88 3.4.4 GENERAL REMARKS 88 REFERENCES 89 CHAPTER 4 93 EFFECTS OF THE SMALL AND LARGE CONDUCTANCE CALCIUM-ACTIVATED POTASSIUM CURRENTS (ISK AND IBK) IN HUMAN SINOATRIAL NODE 93
ABSTRACT 94 4.1 INTRODUCTION 95 4.2 METHODS 97 4.2.1 MATHEMATICAL DESCRIPTION OF ISK 97 4.2.2 MATHEMATICAL DESCRIPTION OF IBK 99 4.2.3 OPTIMIZATION OF THE MODEL WHEN INCLUDING ISK 101 4.3 RESULTS 102
4.3.1 EFFECTS OF ISK ON AP AND CALCIUM TRANSIENT IN THE HUMAN SAN 102
4.3.2 EFFECTS OF ISK ON AP AND CALCIUM TRANSIENT IN THE RABBIT SAN 104
4.3.3 EFFECTS OF IBK ON AP AND CALCIUM TRANSIENT IN THE HUMAN SAN 106 4.3.4 EFFECTS OF IBK ON AP AND CALCIUM TRANSIENT IN THE RABBIT SAN 107
4.3.5 COMBINING ISK AND IBK IN THE HUMAN AND IN THE RABBIT SAN 110
4.3.6 FEATURES AND PARAMETERS OF THE MODELS AFTER THE OPTIMIZATION PROCEDURE
113
4.4 DISCUSSION 118
4.4.1 EFFECTS OF THE INCLUSION OF ISK IN HUMAN AND RABBIT SAN MODELS 118
4.2 EFFECTS OF THE INCLUSION OF IBK IN HUMAN AND RABBIT SAN MODELS 120
4.3 COMBINING ISK AND IBK IN THE SAN MODELS 122
4.4 OPTIMIZED MODELS 122
4.5 FINAL REMARKS 122
REFERENCES 123
CHAPTER 5 PACE-AND-DRIVE OF THE HUMAN SINOATRIAL NODE A PRELIMINARY COMPUTATIONAL INVESTIGATION 126 ABSTRACT 127 5.1 INTRODUCTION 128 5.2. METHODS 129 5.2.1 COUPLING OF DISCRETE SINOATRIAL NODE AND ATRIAL REGIONS 129 5.2.2 1D TISSUE STRAND 130 5.3 RESULTS 132 5.3.1 COUPLING OF DISCRETE SINOATRIAL NODE AND ATRIAL REGIONS 132 5.3.2 1D TISSUE STRAND 133 5.4 DISCUSSION 137 REFERENCES 139 GENERAL CONCLUSION 141 REFERENCES 145
APPENDIX 1: MODEL PARAMETERS AND EQUATIONS 146
MODEL PARAMETERS 146 CELL COMPARTMENTS 146 FIXED ION CONCENTRATIONS, MM 146 VARIABLE ION CONCENTRATIONS, MM 147 IONIC VALUES 147 SARCOLEMMAL ION CURRENTS AND THEIR CONDUCTANCES 147 MODULATION OF SARCOLEMMAL ION CURRENTS BY IONS 148 NA+/CA2+ EXCHANGER (NACA) FUNCTION 148 CA2+ DIFFUSION 148 SERCA PUMP 149 RYR FUNCTION 149 CA2+ AND MG2+ BUFFERING 149 MODEL EQUATIONS 150 MEMBRANE POTENTIAL 150 ION CURRENTS 150
HYPERPOLARIZATION-ACTIVATED, “FUNNY CURRENT” (IF) 150
L-TYPE CA2+ CURRENT (ICAL) 151
T-TYPE CA2+ CURRENT (ICAT) 152
RAPIDLY ACTIVATING DELAYED RECTIFIER K+ CURRENT (IKR) 153
SLOWLY ACTIVATING DELAYED RECTIFIER K+ CURRENT (IKS) 154
ACH-ACTIVATED K+ CURRENT (IK,ACH) 154
TRANSIENT OUTWARD K+ CURRENT (ITO) 155
NA+ CURRENT (INA) 156
NA+/CA2+ EXCHANGER CURRENT (INACA) 157
ULTRA-RAPID ACTIVATING DELAYED RECTIFIER K+ CURRENT (IKUR) 158
CA2+ RELEASE FLUX (JREL) FROM SR VIA RYRS 159
INTRACELLULAR CA2+ FLUXES 160
CA2+ BUFFERING 160
DYNAMICS OF CA2+ CONCENTRATIONS IN CELL COMPARTMENTS 161
RATE MODULATION EXPERIMENTS 162
APPENDIX 2: AUTOMATIC OPTIMIZATION PROCEDURE 163 PARAMETERS SELECTED FOR AUTOMATIC OPTIMIZATION 163 ACTION POTENTIAL FEATURES USED TO CONSTRAIN MODEL PARAMETERS 163 CALCIUM TRANSIENT FEATURES USED TO CONSTRAIN MODEL PARAMETERS 163 COST FUNCTION 164 SEARCH METHOD AND STOP CRITERION 165 PARAMETER CONSTRAINING 165 RINGRAZIAMENTI 167 ACKNOWLEDGMENTS 170
General Abstract
This PhD dissertation deals with the mathematical modeling of the electrophysiology of cardiac cells, in particular the human sinoatrial node (SAN).
The SAN is the primary pacemaker in physiological conditions. To carry out this function, SAN tissue is characterized by auto-ryhthmicity, i.e. it does not need external stimuli to initiate the electrical signal that must be spread out through the whole heart. At the single cell level, the auto-rhythmic behavior is due to the spontaneous slow depolarization during the diastolic phase. Understanding the biophysical mechanisms at the base of diastolic depolarization (DD) is crucial to modulate the heart rate (HR). In turn, HR modulation is fundamental to treat cardiac arrhythmias, so that atria and ventricles can fill properly and pump the blood into the cardiovascular system.
The overall aim of this PhD thesis is the investigation of the underlying mechanisms that are responsible for the pacemaking in human. To this end, a human computational model of the action potential (AP) of the SAN was developed.
The faced fields of interest concerned:
• Pacemaking modulation at single cell level
• Effects of ion channel mutations on the beating rate
• Propagation of the electrical trigger from SAN to atrial tissue
The human single cell SAN model was developed starting from the state-of-art rabbit SAN by Severi et al.; the parent model was updated with experimental data and automatic optimization in order to match the AP features reported in literature. A sensitivity analysis was then performed in order to identify the most influencing parameters.
The investigation of pacemaking modulation was carried out through the simulation of current blockade and mimicking the stimulation of the autonomic nervous system.
The model was validated comparing the simulated electrophysiological effects due to ion channel mutations on beating rate with clinical data of symptomatic subjects carriers of the mutation.
More insights on pacemaking mechanisms were obtained thanks to the inclusion of calcium-activated potassium currents, which link changes in the intracellular calcium to the membrane.
Finally, the propagation of the action potential from the SAN to the atrial tissue and the source-sink interplay was investigated employing a mono-dimensional strand composed by SAN and atrial computational model.
The human SAN model developed in this dissertation showed the main AP features in agreement with the experimental data reported in literature and allowed to provide insights about the modulation of the beating rate, and thus, the macroscopic heart rate. The human SAN model developed in this dissertation showed the main AP features in agreement with the experimental data reported in literature and allowed to provide insights about the modulation of the beating rate, and thus, the macroscopic heart rate.
The effects of ion channels mutations affecting the “funny current”, the sodium current, and the slowly delayed rectifier potassium current simulated by the SAN model were consistent with the variations of heart rate observed in clinical studies. The validation, therefore, stated that the model provides a reliable description of SAN activity and represents an useful tool for scientific community.
The investigation of underlying mechanisms of pacemaking highlighted the capability of If to finely control the diastolic depolarization; furthermore it
contributed to autonomic modulation with IK,ACh and ICaL for the vagal and
adrenergic stimulation respectively.
The inclusion of ISK showed the capability of that current to affect diastolic
the contrary, the contribution of IBK in beating rate modulation was almost
negligible.
The carried out study about electrical conduction highlighted the capability of human SAN model of successfully driving the atrial tissue for a wide range of coupling. The extent of that range was dependent by the number of SAN cells that compose the electrical source. The presence of an electrical load, due to the atrial tissue, revealed that the model can show, with the same set of parameters, “central cell” and “peripherical cell” morphology thanks to the activity of INa
Several results here proposed have to be meant as predictions since human specific experimental data are still scarce. In this way the human computational AP model can be used as useful tool to gain knowledge about pacemaking phenomena, through the interaction between experiments and modeling.
Introduction
The sinoatrial node (SAN) is the primary pacemaker, responsible for the heart rate in physiological conditions. In other words, it is what keeps the heart ticking.
Galen (129-200 A.D.) first, and twelve centuries later Leonardo da Vinci (Noble, 1966; Opthof, 1988) described the auto-rhythmicity of the heart. However only in 1907 the SAN was anatomically identified as “a small condensed area of
tissue, just where the cava sank into the auricle” by Sir Arthur Keith and Martin
Flack (Keith & Flack, 1907); four years later, in 1911, SAN was indicated as the point of the initial cardiac stimulation(Monfredi et al., 2010) .
SAN cells are electrical specialized myocytes, i.e. they carry out the task of generating and spreading out the electrical impulse to the whole heart. This particular function makes the action potential (AP) waveform of SAN, its “electrical signature”, profoundly different from the one of working myocytes, as atrial and ventricular cells. When they are not stimulated, working myocytes show stable negative resting potential, whereas SAN cells are characterized by a unstable diastolic phase, that makes the membrane potential to slowly move to less negative (depolarized) values. This characteristic phase of pacemaker cells is called spontaneous diastolic depolarization (DD).
The main characteristic of SAN cells is their auto-oscillating nature, i.e. they do not need any external stimulus to trigger the AP. The spontaneous DD is driven by a small inward current, result of a sophisticated balance of several inward and outward currents. The “Funny current” (If), the transient, long lasting
calcium currents (ICaT and ICaL) and the sodium-calcium (Na+-Ca2+) exchanger
(INaCa) contribute to the depolarization, carrying sodium (Na+) and calcium (Ca2+)
into the cell, whereas outward potassium (K+) currents, as the rapid (IKr) and the
slow delayed rectifier (IKs) participate to the repolarization. A stronger
contribution of inward currents shortens the duration of DD thus allowing a faster rate of the spontaneous APs. On the other hand, a stronger outward current causes a DD prolongation, which leads to a slower rate.
The pharmacological modulation of the heart rate is used in clinical practice to treat cardiac arrhythmias. Current blockers are chemical species able to reduce the activity of ion channels: by targeting the currents involved during DD it is possible to control its steepness, and thus its duration. Electrophysiological studies and clinical trials showed the capability of ivabradine, a If blocker, to slowdown
the heart beat without any side-effect thanks to its high selectivity (see the BEAUTIfUL study).
The experimental quantification of current contributions during DD is often a challenging task: ion channel blockers can often affect more than one target and several unpredictable interactions can occur. Mathematical and computational modeling, thanks to simplification and abstraction, can help to disclose and to describe quantitatively the mechanisms in biophysical systems.
The first mathematical description of the rhythmicity of the heart was formulated by van der Pol and van der Mark (1928). Such model was able to reproduce the key properties of nerves and heart cells as excitable elements, i.e. the stimulus threshold, the membrane excitability and refractoriness. The main conceptual limit is the absence of a link between the electrical activity and the underlying biophysical phenomena.
The investigation on the squid giant axon carried out by Hodgkin & Huxley (1952) represents a milestone in electrophysiology and AP modeling. They represented the behavior of the cellular membrane and ion channels as the behavior of an electrical circuit composed by a capacitance in parallel to a variable conductance; the variation of the membrane voltage is proportional to the sum of the inward and outward currents. The time- and voltage-dependent conductance of ion channels was achieved through the activation and inactivation of gating variables, described by differential equations. In this way, Hodgkin & Huxley (1952) were the firsts who linked the flux of Na+ and K+ through the membrane to the electrical activity of the cell.
The Hodgkin-Huxley paradigm was then extended to cardiac excitable cells. The Purkinje fibers model by Noble (1960, 1962) was the first cardiac computational model. Several years after, Yanagihara & Irisawa (1980) published the first computational model based on rabbit SAN electrophysiological data.
The refinement of electrophysiological measurements and cell preparation techniques (e.g. the capability of measuring single currents, to obtain isolated cells) allowed investigating more in details the mechanisms of pacemaking and formulating more comprehensive models, by introducing new current formulations and ionic concentration dynamics.
In spite of the abundance of in vitro data, the principal mechanism responsible for the initiation and modulation of the heartbeat is still debated.
The “Membrane clock” theory is the most consolidated one with strong experimental evidences that support it. Recenly, the “Ca2+ clock” theory was proposed. On one hand, the “Membrane clock” theory confers the primary role in membrane automaticity and pacemaking modulation to ion channels, especially to If. Indeed, the biophysical properties of If (e.g. activation at potentials compatible
with DD, inward contribution, enhancement in β-adrenergic stimulation), make it a strong candidate to the spontaneous DD initiation and modulation. On the other hand, the “Calcium clock” theory is based on the spontaneous release of Ca2+ from the sarcoplasmic reticulum. Ca2+ cycling is able to change the membrane voltage through the ignition of the Na+-Ca2+ exchanger. The experimental and computational work by Himeno et al., (2011) highlighted that the chelation of cytosolic Ca2+, and thus an impairment of Ca2+ clock did not affect the heart rate in guinea pig SAN, suggesting a predominant role of “membrane clock”.
The state-of-the-art models (Maltsev & Lakatta, 2009; Himeno et al., 2011; Severi et al., 2012) are based on plethora of animal experimental data (in particular rabbit and guinea pig) and they allow to describe relevant phenomena; unfortunately, way less data are available on human SAN cells. Such shortage of human data is because, usually failing explanted hearts do not contain the SAN, since it remains inside the chest of the receiver of the new functional heart during transplantation. The unique electrophysiological work on adult human SAN was carried out by Verkerk et al. (2007), whereas Chandler et al. (2009) characterized the human SAN through gene expression, quantifying the mRNA in SAN cells. In this way, the limited availability of human specific data hampered the development of a computational model of human SAN.
Mathematical modeling provides a simplification and abstraction to the description of biophysical phenomena, and can be exploited as a white box to observe the mechanisms that are responsible for the emergent behavior. Cardiac cells are strongly non-linear dynamical systems and often it is challenging to predict or explain the effects consequent to drug administration or blockade of currents.
The lack of human electrophysiological data for SAN is a critical obstacle to the formulation of a comprehensive human specific model. Luckily, optimization techniques represent useful tools to fill this gap of knowledge, using the available experimental data as a tight constrains.
The development of a human SAN model, based on the human-specific available current formulations could allow to “dissect” the net current in all its components, providing an estimation of the contribution to pacemaking of each current.
The knowledge about the mix of currents during DD can therefore help to identify pharmacological targets to modulate the heart rate, the macroscopic marker used in clinical practice.
The overall aim of this PhD dissertation is the investigation of the underlying pacemaking mechanisms involved in the human SAN.
To this end, a computational human SAN single cell model able to reproduce (i) the experimental data in physiological conditions, (ii) the effects of administration of drugs, and (iii) the changes in beating rate, due to ion channel mutations, was developed.
PhD Thesis Outline
The first step to investigate the mechanisms at the base of human pacemaking was the development of the mathematical AP model of human SAN at the single cell level (Chapter 1) .The rabbit SAN model by Severi et al. (2012), was
adopted as parent model. It was updated using (i) electrophysiological human specific data, (ii) gene expression mRNA quantities to scale ion channel conductance; (iii) an automatic optimization procedure was performed to tune parameters on which no experimental data were available. The simulated waveform and the extracted features were compared to experimental data. A sensitivity analysis was then carried out in order to identify the parameters that mostly influence the behavior of the AP model.
In Chapter 2 the impact on heart rate due to the modulation of the two main actors of “membrane clock” and “calcium clock” theories, namely If and
INaCa was investigated. Moreover, the effects of autonomic stimulation were
assessed simulating the effects due to the administration of acetylcholine (vagal stimulation) and isoprenaline (to mimic the adrenergic stimulation).
The validation of the model was performed reproducing the effects on beating rate of ion channel mutations (Chapter 3). To this end, the electrophysiological characterization of a selection of mutation affecting If, the
fast Na+ current (INa) and IKs were implemented in the SAN model. Furthermore
the effects of three mutations affecting If (G480R, A485V and 695X) were
assessed at low, basal and high rates.
In Chapter 4 the impact of the inclusion of new currents was investigated. The small (ISK) and large conductance (IBK) K+ Ca2+-dependent currents were
added to the original model and a preliminary sensitivity analysis was performed Finally, the focus was moved on how the SAN impulse spread out, investigating how a small tissue as SAN can drive a larger one as atrial tissue
(Chapter 5). A mono-dimensional strand composed by SAN and atrial cells was
built and a study of the propagation of the electrical stimulus was carried out varying the strength of electrical coupling and the number of SAN and atrial cell mix.
References
Himeno Y, Toyoda F, Satoh H, Amano A, Cha CY, Matsuura H & Noma A (2011). Minor contribution of cytosolic Ca2+ transients to the pacemaker rhythm in guinea pig sinoatrial node cells. Am J Physiol -
Hodgkin AL & Huxley AF (1952). A quantitative description of membrane current and its application to conduction and excitation in nerve. J
Physiol 117, 500–544.
Keith A & Flack M (1907). The Form and Nature of the Muscular Connections between the Primary Divisions of the Vertebrate Heart. J Anat Physiol 41, 172–189.
Maltsev VA & Lakatta EG (2009). Synergism of coupled subsarcolemmal Ca2+ clocks and sarcolemmal voltage clocks confers robust and flexible pacemaker function in a novel pacemaker cell model. Am J Physiol -
Heart Circ Physiol 296, H594–H615.
Monfredi O, Dobrzynski H, Mondal T, Boyett MR & Morris GM (2010). The Anatomy and Physiology of the Sinoatrial Node—A Contemporary Review. Pacing Clin Electrophysiol 33, 1392–1406.
Noble D (1960). Cardiac Action and Pacemaker Potentials based on the Hodgkin-Huxley Equations. Nature 188, 495.
Noble D (1962). A modification of the Hodgkin—Huxley equations applicable to Purkinje fibre action and pacemaker potentials. J Physiol 160, 317– 352.
Noble D (1966). The initiation of the heart beat. Adv Sci 23, 412–418.
Opthof T (1988). The mammalian sinoatrial node. Cardiovasc Drugs Ther 1, 573–597. Pol van der B & Mark van der J (1928). LXXII. The heartbeat considered as a relaxation oscillation, and an electrical model of the heart. Lond Edinb Dublin Philos Mag J Sci 6, 763–775.
Severi S, Fantini M, Charawi LA & DiFrancesco D (2012). An updated computational model of rabbit sinoatrial action potential to investigate the mechanisms of heart rate modulation. J Physiol 590, 4483–4499.
Verkerk AO, Wilders R, Borren MMGJ van, Peters RJG, Broekhuis E, Lam K, Coronel R, Bakker JMT de & Tan HL (2007). Pacemaker current (If) in the human sinoatrial node. Eur Heart J 28, 2472–2478.
Yanagihara K & Irisawa H (1980). Potassium current during the pacemaker depolarization in rabbit sinoatrial node cell. Pflüg Arch Eur J Physiol 388, 255–260.
Chapter 1
Development of the single cell human
sinoatrial node action potential model
The content of this chapter is published in:
“Computational analysis of the human sinus node action potential: model development and effects of mutations”
Alan Fabbri1, Matteo Fantini1, Ronald Wilders2 and Stefano Severi1 1
Computational Physiopatology Unit, Department of Electrical, Electronic and Information Engineering “ Guglielmo Marconi”, University of Bologna, Cesena, Italy
2
Department of Anatomy, Embriology and Physiology, Academic Medical Center, University of Amsterdam, Amsterdam, The Netherlands
Abstract
The sinoatrial node (SAN) is the normal pacemaker of the mammalian heart. Over several decades, a large amount of data on the ionic mechanisms underlying the spontaneous electrical activity of SAN pacemaker cells has been obtained, mostly in experiments on single cells isolated from rabbit SAN. This wealth of data has allowed the development of detailed mathematical models of the electrical activity of rabbit SAN pacemaker cells.
The present study aimed to construct a comprehensive model of the electrical activity of a human SAN pacemaker cell using recently obtained electrophysiological data from human SAN pacemaker cells.
We based our model on the recent Severi–DiFrancesco model of a rabbit SAN pacemaker cell; updates of formulation concerning currents, pump and exchangers were implemented including electrophysiological and gene expression data collected from human SAN cells present in literature. The tuning of parameters of which no experimental data were available was carried out through an automatic optimization procedure. A sensitivity analysis was performed in order to identify the most influencing parameters on AP features.
The model showed AP features in accordance with experimental data (CL = 814 vs 828 ± 21 ms, APD90 = 161.5 vs 143.5 ± 49.3 ms, DDR100 = 48.1 vs 48.9 ±
25.4 mV/s) and qualitative reproduction of the experimentally observed calcium transient time course.
Sensitivity analysis highlighted a remarkable influence of ICaL and IKr on AP
1.1 Introduction
There is no need to explain the important role of the sinoatrial node (SAN) in cardiac function. Many studies have focused on this small but crucial piece of cardiac tissue and provided detailed knowledge of the physiological processes governing its function. Yet we still have an incomplete understanding of the cellular basis of the pacemaker activity of the SAN and, specifically, the degree of contribution of the different mechanisms involved is still debated (Lakatta & DiFrancesco, 2009;DiFrancesco, 2010; Lakatta, 2010; Maltsev & Lakatta, 2010; Noble et al., 2010; Verkerk & Wilders, 2010; Himeno et al., 2011; DiFrancesco & Noble, 2012; Lakatta & Maltsev, 2012; Rosen et al., 2012; Monfredi et al., 2013; Yaniv et al., 2013, 2015).
To date, almost all experiments on SAN electrophysiology have been carried out on animals, particularly rabbits. These experiments have shed light on several aspects, such as characteristics of membrane currents, effects of ion channel blockers, calcium handling and beating rate modulation. This considerable amount of data has allowed the development of increasingly comprehensive and detailed action potential (AP) models (Wilders, 2007) subsequent to the first mathematical models reproducing pacemaker activity being created (McAllister et
al., 1975; Yanagihara et al., 1980; Noble & Noble, 1984; DiFrancesco & Noble,
1985).
Recently, novel SAN AP models have been proposed, incorporating detailed calcium-handling dynamics and providing in-depth descriptions of the underlying events at the cellular level in guinea-pig, mouse and rabbit (Himeno et al., 2008; Maltsev & Lakatta, 2009; Kharche et al., 2011; Severi et al., 2012).
However, the translation of animal data/models to humans is not straightforward (probably even less so for SAN pacemaker cells than working myocardial cells), given the big difference in their main ‘output’ (i.e. pacing rate) between human and laboratory animals.
Very few measurements are available for human SAN cells because failing explanted hearts, as obtained during heart transplantation, usually do not contain
the SAN region, which remains inside the receiver’s chest. Drouin (1997) was the first to record human adult APs from SAN tissue, obtained from four subjects affected by left ventricle infarction. Ten years later Verkerk et al. (2007b) investigated the electrophysiological properties of three isolated SAN cells from a woman who underwent SAN excision because of a paroxysmal non-treatable tachycardia. They recorded APs and characterized the funny current using whole-cell patch clamp in current clamp and voltage clamp mode. In a subsequent study (Verkerk et al., 2013), the same group reported further data from the same patient, regarding the calcium transient (CaT) measured by indo-1 fluorescent dye.
Some proof-of-concept attempts have been made to model spontaneous activity in human cardiac pacemaker cells. Seemann et al. (2006) presented the first human SAN AP model as part of a wider 3D model of human atria. Their model started from the model of Courtemanche et al. (1998) of the human atrial AP and achieved automaticity by including rabbit SAN currents (e.g. If, ICaT, etc.),
formulated in accordance with Zhang et al. (2000). Unfortunately, no reliable experimental comparisons could be made with the model of Seemann et al. (2006). Chandler et al. (2009) described the ‘molecular architecture’ of adult human SAN tissue obtained from healthy hearts, comparing it to the non-specialized tissue of the right atrium. They developed a SAN model, again starting from the model of Courtemanche et al. (1998); by scaling the maximal conductances based on mRNA data, they provided a proof of concept that automaticity can be the result of the specific gene expression pattern of human SAN tissue. However, some mechanisms were not included, and no quantitative AP features were computed or compared with the human data available at that time. Accordingly, as Chandler et al. (2009) themselves affirmed, ‘the resulting model cannot be considered definitive and is a guide only’.
Recently, Verkerk & Wilders (2015) computationally investigated mutations affecting hyperpolarization-activated cyclic nucleotide-gated cation channel 4 (HCN4) channels, but they ‘… preferred to study If in simulated action potential
clamp experiments, thus ensuring that the action potential followed the course of that of a human SAN pacemaker cell’ because a human SAN AP model was not formulated yet. Thus, they highlighted the need for such a model.
Much more recent is the human SAN AP model formulated by Pohl et al. (2016). In their model, to investigate the cardiac neuromodulation (as exerted by vagal stimulation) that aims to reduce heart rate, they focused their attention on the effects that acetylcholine has on the rate. Starting from the rabbit SAN model reported by Dokos et al. (1996) they updated current formulations, integrating data from human SAN cells (Verkerk et al. 2007b) and human ion channels expressed in heterologous systems (HEK or tsA-201 cells, Xenopus oocytes, etc.). The simulated cycle length (CL) was in accordance with the experimental recordings of human SAN cell APs by Verkerk et al. (2007b) but, unfortunately, the AP morphology, both during the diastolic depolarization (DD) phase and AP, was very unlike that obtained experimentally.
The main aim of the present study is the formulation of a human SAN AP model strictly based on and constrained by the available electrophysiological data. We started from the recent rabbit SAN model by Severi et al. (2012), which integrates the two principal mechanisms that determine the beating rate: the ‘membrane clock’ and ‘calcium clock’ (Maltsev & Lakatta, 2009; Lakatta et al., 2010). Several current formulations were updated based on available measurements. A set of parameters, for which no specific data were available, were tuned to reproduce the measured AP and calcium transient data. We then used the model to assess the effects of several mutations affecting heart rate and investigated the rate modulation in some relevant conditions (see Chapter 2 and 3).
1.2 Methods
1.2.1 Model development
The starting point of our work was the rabbit SAN cell model by Severi et al. (2012). Several currents, pumps and exchangers were reviewed, based on electrophysiological data from human SAN cells (Verkerk et al., 2007b), self-beating embryonic human cardiomyocytes (Danielsson et al., 2013), as selected for their automaticity, and data on gene expression patterns in SAN vs. atrial human cells (Chandler et al. 2009). Specifically, the model was constrained by: AP parameters obtained from three isolated human SAN pacemaker cells by Verkerk et al. (2007b); the voltage clamp data on If in the same three cells
(Verkerk et al., 2007b); the effect of 2 mM Cs+, as an If blocker, on the AP of a
single isolated human SAN pacemaker cell (Verkerk et al. 2007b); and the Ca2+ transient data of a single isolated human SAN pacemaker cell (Verkerk et al., 2013). For a small set of parameters for which no specific experimental data were available, values were obtained via an automatic optimization procedure (see below).
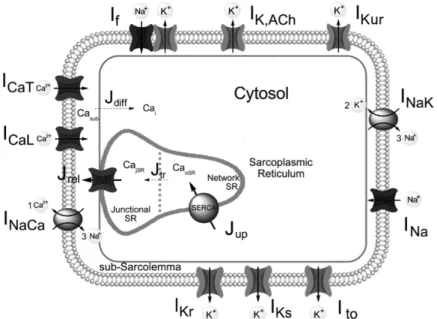
Figure 1.1 shows a schematic diagram of the human SAN AP model. The compartmentalization, essential for the calcium handling description, is inherited from the parent model, as were the sarcolemmal ionic currents, pumps and exchangers. The ultra-rapid delayed rectifier K+ current (IKur) was developed
independently. Table 1.1 reports the changes with respect to the rabbit SAN model and the rationale for each. All model equations and parameter values are provided in Appendix 1.
1.2.2 Automatic optimization procedure
An automatic optimization was performed to tune the parameters for which human experimental data were not available to fit the recorded AP and cytosolic calcium transient traces (Verkerk et al. 2007b, 2013).
The cost function of the optimization procedure was based on quantitative data on AP features [action potential amplitude (APA), maximum diastolic potential (MDP), cycle length (CL), maximum rate of rise of membrane potential [(dV/dt)max], action potential duration (APD20, APD50, APD90), diastolic
depolarization rate (DDR100)], intracellular calcium transients [diastolic [Ca2+]i,
systolic [Ca2+]i, intracellular CaT duration (TD20, TD50, TD90)] and the effect of
the administration of 2 mM Cs+, a funny current blocker, on CL (Verkerk et al. 2007b, 2013). The most critical features (CL, MDP and CL prolongation in
Figure 1.1: Schematic diagram of the human SAN cell model. The cell is divided in three compartments: sarcolemma, cytosol, and sarcoplasmic reticulum (SR), which is sub-divided in junctional and network SR. Ca2+ handling is described by: two diffusion fluxes (Jdiff
from the subsarcolemmal space to the cytosol and Jtr from the network SR to the junctional
SR), the Ca2+ uptake from the cytosol into the network SR by the SERCA pump (Jup), and the
Ca2+ release (Jrel) from the junctional SR into the subsarcolemmal space by the ryanodine
receptors (RyRs). Sodium, calcium, and potassium ions pass the sarcolemmal membrane through 11 different ionic channels, pumps and exchangers, as indicated.
response to Cs+) were weighted more heavily. After each simulation, the set of
quantitative descriptors was extracted and compared with the experimental data. If a particular observed feature fell out of the experimental mean ± SEM range, the contribution of this feature to the overall cost was increased in a linear way; otherwise, no handicap was added. The search for the optimal solution was conducted using the Nelder–Mead simplex method (Lagarias et al., 1998).
The obtained parameters are shown in Table 1.1. Further details on the
optimization procedure are reported in Appendix 2.
1.2.3 Cell capacitance and dimensions
We assumed a membrane capacitance (Cm) of 57 pF, and a cylindrical cell
shape with a length of 67 µm and a diameter of 7.8 µm, in accordance with the experimental data of Verkerk et al. (2007b), who reported values of 56.6 ± 8.7 pF, 66.7 ± 6.3 µm and 7.8 ± 0.4 µm (mean ± SEM, n = 4), respectively. The dimensions of the intracellular compartments, expressed as a percentage of cell volume, were adopted from the parent model.
1.2.4 Membrane currents
Here, we specify each of the sarcolemmal currents flowing through the ionic channels, pumps and exchangers shown in Fig. 1.1. The outward acetylcholine-activated potassium current IK,ACh, will be described in Chapter 2, in the section
related to the autonomic modulation. All membrane currents were scaled up by the new value of the cell capacitance, aiming to maintain the conductance densities adopted from the parent model. Changes to the conductance densities, as a result of parameter tuning, are reported in the corresponding current subsections.
Table 1.1 - Changes with respect to the parent model.
Updates Rationale
Cell Capacitance and dimensions
Cm=57 pF, Lcell=67 µm, Rcell =3.9 µm
Human SAN data (Verkerk et al., 2007b)
If New formulation Human SAN data
(Verkerk et al., 2007b)
IKr New steady-state activation,
gKr= +10%
Embryonic human data (Danielsson et al., 2013)
IKs
New steady-state activation, gKs= -78%
Embryonic human data (Danielsson et al., 2013)
IKur
Added, gKur = 6% of atrial Formulation from Maleckar et al. (2009) atrial cell model
Gene expression data (Chandler et al., 2009) and automatic optimization
(APD)
Ito
gto = -1.5% Automatic optimization (OS)
IK,ACh
gK,ACh = -77.5% Fitting of ACh effects in
rabbit
INaK
gNaK = -28% Automatic optimization
(CL) ICaL V½,dL= -16.45 mV, kdL= 4.32 mV (dL gate) PCaL= +28.5% Automatic optimization (CL) ICaT
PCaT = +15% Automatic optimization
(Early DD)
INaCa KNaCa= -53% Automatic optimization
(diastolic [Ca2+]
i)
SR uptake (Jup)
Sigmoidal formulation Fitting of diastolic [Ca2+] i SR release (Jrel) ks =1.48 · 108s-1 kom= 660 s-1 Automatic optimization (Cai range)
Calmodulin kfCM = 1.64 · 106 (mM s)-1 Automatic optimization (Cai range)
Calsequestrin kfCQ = 175 (mM s)-1 Automatic optimization
(Cai range)
Calcium diffusion τdifCa = 5.47 · 10-5 s Automatic optimization (Cai range)
Intracellular Na Fixed at 5 mM As used in human SAN
experiments (Verkerk et al., 2007b) Cm, membrane capacitance; Lcell, Rcell, length and radius of the cell; gi, maximal conductance for the i type channel; PCaT, PCaL, permeability for the T and L-type calcium currents; V½,dL, kdL, half-activation potential and slope factor for voltage dependent dL gate; KNaCa, maximal current of NCX; ks, maximal rate of calcium release from RyR channels; kom, transition rate from open (O) to resting (R) state of RyR channels; kfCM, kfCQ, association constant for calmodulin and calsequestrin. The reported features in brackets (APD, CL, Cai range, DD, OS) are those on which each parameter had a larger impact during the automatic optimization procedure.
1.2.4.1 Funny current (If)
From their experiments on human SAN cells, Verkerk et al. (2007b) reported a maximal If conductance of 75.2 ± 3.8 pS/pF (mean ± SEM, n = 3). Consequently,
we assumed a maximal If conductance (gf) of 4.3 nS, given our Cm of 57 pF. The
funny current was implemented by splitting it into Na+ and K+ components, with a
!!"#
!"# conductance ratio of 0.5927, thus arriving at an If reversal potential (Ef) of –
22 mV, in accordance with the experimentally determined value of –22.1 ± 2.4 mV (mean ± SEM, n = 3) (Verkerk et al. 2007b). A first-order Hodgkin and Huxley-type kinetic scheme was assumed for If activation, as described by the
formulations presented by Verkerk et al. (2007a) and Verkerk & Wilders (2010). The activation time constant τy was formulated in accordance with Verkerk et al.
(2007a), who used a Dokos et al. (1996)-type equation to fit the experimental data obtained from three human adult SAN cells by Verkerk et al. (2007b).
1.2.4.2 Rapid delayed rectifier K+ current (IKr)
The steady-state activation curve of IKr (pa gate) was fitted to data from
embryonic human cardiomyocytes by Danielsson et al. (2013). The measured tail current density following activation pulses from −70 to +50 mV was normalized with respect to the maximal measured value and then fitted with a Boltzmann equation. The conductance gKr was set to 4.2 nS (+10% compared to parent
model) to hyperpolarize the maximum diastolic potential (MDP) and obtain the value experimentally observed in human SAN (Drouin, 1997; Verkerk et al., 2007b).
1.2.4.3 Slow delayed rectifier K+ current (IKs)
The steady-state activation curve for IKs (n gate) was updated in accordance
with the experimental data of Danielsson et al. (2013). The reported current density vs. voltage data were normalized to the maximal measured value and subjected to square-root, in line with the second-order Hodgkin and Huxley-type kinetic scheme. Data were then fitted with a Boltzmann equation. The conductance gKs was set to 0.65 nS (11.4 pS/pF), −78% with respect to the parent
model, as a result of the automatic optimization procedure. On one hand, Chandler et al. (2009) reported an mRNA expression level in the human SAN equal to 69% of that in non-specialized atrium cells. On the other hand, very discordant values have been reported for gKs in human atrial cells up to now,
ranging from 3.5 pS/pF (Grandi et al., 2011) to 20 pS/pF (Nygren et al., 1998), whereas gKs was adjusted to 129 pS/pF in the model of Courtemanche et al.
(1998) simply to match AP duration.
1.2.4.4 Ultrarapid delayed rectifier K+ current (IKur)
Chandler et al. (2009) reported the expression of KV1.5 channels, responsible
for IKur, in human SAN tissue. Because IKur was not present in the parent model,
we added this current, formulating it as in the human atrial cell model of Maleckar
et al. (2009). The IKur conductance was set to 0.1539 nS, 6% of the corresponding
atrial value, based on the automatic optimization procedure.
1.2.4.5 Transient outward K+ current (Ito)
We maintained the parent model formulation, which, in turn, was adopted from the model of Maltsev & Lakatta (2009). The Ito conductance was set to 3.5 nS,
1.2.4.6 Sodium/potassium pump current (INaK)
For INaK, the formulation by Severi et al. (2012), which was in turn derived
from that of Kurata et al. (2002), was adopted. The maximal activity of the Na+/K+ pump was reduced by 28% (I
NaK,max = 0.08105 nA) through automatic
optimization.
1.2.4.7 Sodium current (INa)
The presence of fast Na+ current (INa) in human SAN cells has been reported
by Verkerk et al. (2009b). The steady-state activation and inactivation curves (gates m and h) of the parent model have been simply rewritten in a sigmoidal formulation (see Appendix 1) to facilitate the implementation of mutations related to Nav1.5 channels.
1.2.4.8 T-type Ca2+ current (ICaT)
The mathematical formulation of ICaT was inherited from the parent model and
thus based on the constant field equation by Sarai et al. (2003). The Ca2+ permeability PCaT was set to 0.04132 nA mM−1 (+15%), as obtained by automatic
optimization.
1.2.4.9 L-type Ca2+ current (ICaL)
Changes in ICaL kinetics were limited to the voltage-dependent steady-state
activation curve dL. The half-maximal activation voltage (V½,dL) was slightly
shifted towards less negative potentials (from −20.3 to −16.45 mV) and the slope factor kdL was slightly increased (from 4.2 to 4.337 mV). The Ca2+ permeability
was increased by 28% (PCaL = 0.4578 nA mM−1). All of these parameters were
updated using automatic optimization.
1.2.4.10 Sodium/calcium exchange current (INaCa)
The set of equations describing the Na+/Ca2+ exchanger activity was adopted from the parent model and thus originally derived by Kurata et al. (2002). The maximal current provided by the exchanger was set to 3.343 nA, reduced by 53% as a result of the automatic optimization procedure.
1.2.5 Calcium handling
As in the parent model, the mathematical formulation of Ca2+ handling was based on Maltsev & Lakatta (2009), who provided an advanced description of SR behaviour. The parameter updates, which play an important role in Ca2+ handling, were achieved by automatic optimization.
1.2.5.1 SR Ca2+ uptake (Jup)
The Ca2+ uptake flux was formulated by a sigmoidal curve, instead of the Michaelis–Menten equation of the parent model. The sigmoidal formulation permitted a higher control of Ca2+ uptake, in particular during the diastolic phase.
1.2.5.2 SR Ca2+ release (Jrel)
The Ca2+ diffusion rate ks, and the ryanodine receptors (RyRs) Ca-dependent
activation rate, kom, were set to 148 x 106 s−1 and 660 s−1, respectively, through
automatic optimization.
1.2.5.3 Ca2+ diffusion and Ca2+ buffers
The time constant for Ca2+ diffusion from the subsarcolemma to the cytosol
(τdifCa) was set to 5.469 x 10⁻⁵ s. The Ca2+ association constants for calmodulin
(kfCM) and calsequestrin (kfCQ) were set to 1.642 x 10⁶ and 175.4 (mM s)−1,
respectively.
Calmodulin is involved in Ca2+ buffering in the cytosolic compartment, whereas calsequestrin binds Ca2+ in the junctional SR (jSR).
1.2.6 Ion concentrations
Ca2+ dynamics for the four compartments were described by the mass balance equations. Intracellular Na+ was fixed at 5 mM, the Na+ concentration in the pipette solution used in the whole cell configuration by Verkerk et al. (2007b). In such a configuration, intracellular Na+ is expected to equilibrate with the pipette solution.
1.2.7 Sensitivity analysis
The sensitivity analysis was performed according to the approach proposed by Sobie (2009). The randomization procedure involved the parameters that underwent automatic optimization and the remaining maximal conductances, for a total of 18 parameters. The conductances were randomized through scaling factors chosen from a log-normal distribution with a median value of one and an SD σ = 0.1873; thus, an increase of 20% represents 1 SD away from the control value.
Shifts of the steady-state gating variables and the sarco-endoplasmic reticulum Ca2+-ATPase (SERCA) pump calcium dependence were extracted from a normal distribution centered on zero, with SDs of σ = 2 mV and σ = 50 nM, respectively. The randomization was run for a population of 500 models. All of them were simulated and the corresponding AP and CaT features were computed.
Parameters and their corresponding features were collected in the X (n x p) and Y (p x m) matrices, respectively, where n corresponds to the number of simulations showing an auto-oscillating behaviour (< 500), p is the number of parameters and m is the number of computed features. Next, the matrix B (p x m) containing the sensitivity coefficients was computed using the formula:
B = (X! × X)-! × X! × Y
1.2.8 Calibration of the population of models
The randomization of the parameters performed during the sensitivity analysis procedure led to a population of 500 models. First, the models that didn’t show automaticity were discarded; then, the population was calibrated selecting the cell models that showed MDP, CL, APD90 and DDR100 within the experimental range
1.2.9 Hardware and software
The human SAN model was built in Simulink (The Mathworks, Inc., Natick, MA, USA). Simulations ran on an OS X Mavericks (version 10.9.5) Apple computer (Apple, Cupertino, CA, USA) equipped with an Intel i7 dual core processor (Intel, Santa Clara, CA, USA). Numerical integration was performed by ode15s, a variable order solver based on numerical differentiation formulas, provided by MatLab (The Mathworks, Inc.). Simulations were run until steady-state was reached, which occurred after 50 s, based on the observation of calcium concentrations in each compartment. The automatic optimization and feature extraction were performed by custom code in MatLab 2013a. Model code is available at: http://www.mcbeng.it/en/downloads/software/hap-san.html and also in the CellML Model Repository (http://models.cellml.org/).
1.3 Results
Human SAN model behaviour in basal conditions 1.3.1 Simulated AP and calcium transient
The simulated AP waveform reproduces the available experimental traces well (Fig. 1.2A). Indeed, most of the quantitative parameters that describe AP morphology (i.e. CL, MDP, APD90 and DDR100) are within the mean ± SD range
of the experimental ones (Verkerk et al., 2007b) (Table 1.2). In particular, the AP generated by the model is characterized by a CL of 814 ms, corresponding to a beating rate of 74 beats min–1. However, the model presents a higher (dV/dt)max
and overshoot (OS) and a longer APD20 (predicted features beyond the
experimental mean ± SD range).
The simulated Ca2+ transient qualitatively reproduces the single experimental trace acquired by Verkerk et al. (2013), showing a smaller transient amplitude and longer duration compared to rabbit data. Even if the model predicts slightly lower values for both diastolic and systolic [Ca2+]i, the CaT amplitude (intracellular CaT
amplitude; TA) is close to the experimental data (Fig. 1.2B and Table1.3).
Figure 1.2 Action potential and intracellular Ca2+ transient of a single human SAN cell. (A) Simulated action potential of a single human SAN cell (black thick line) and experimentally recorded action potentials of three different isolated human SAN cells (grey traces). Experimental data from Verkerk et al. (2009a; 2010). (B) Simulated (black thick line) and experimentally recorded (grey line) Ca2+ transient. Experimental data from Verkerk et al.
(2013). 0 200 400 600 800 1000 1200 1400 1600 Time (ms) -70 -60 -50 -40 -30 -20 -10 0 10 20 30 Vm (mV) A 0 200 400 600 800 1000 1200 1400 1600 Time (ms) 50 100 150 200 250 [Ca 2+ ]i (nM) B
Table 1.2: Action potential features.
Comparison between experimental (mean ± SD, n = 3) (Verkerk et al., 2007b) and simulation data
Table 1.3: Calcium transient features.
Comparison between experimental (Verkerk et al., 2013) and simulation data.
AP feature Unit Experimental
Value Present Model MDP mV -61.7 ± 6.1 -58.9 CL ms 828 ± 21 814 (dV/dt)max V/s 4.6 ± 1.7 7.4 APD20 ms 64.9 ± 23.9 98.5 APD50 ms 101.5 ± 38.2 136.0 APD90 ms 143.5 ± 49.3 161.5 OS mV 16.4 ± 0.9 26.4 DDR100 mV/s 48.9 ± 25.5 48.1 Calcium
Transient Unit ExperimentalValue PresentModel
Cai range nM 105 - 220 85 - 190
TA nM 115 105
TD20 ms 138.9 136.7
TD50 ms 217.4 206.3
The time courses of the underlying currents, Ca2+ fluxes and Ca2+ concentrations in the four intracellular compartments are shown in Fig. 1.3. The main inward (depolarizing) and outward (repolarizing) membrane currents are ICaL and IKr, respectively (Fig. 3C). However, the peak amplitude of Itot (Fig.
1.3B), and therefore the maximum AP upstroke velocity, is determined not only by ICaL, but also by INaCa (Fig. 1.3E). Other currents are much smaller in amplitude
than ICaL and IKr. Yet, several are important determinants of the net ionic current
during DD, and thus of CL (see below). Of note, as set out in Chapter 3, sinus node dysfunction can result from mutations in If, INa and IKs, which are among the
smallest currents (Fig. 3D).
The calcium-induced calcium release from the jSR upon calcium entry through the ICaL channels is reflected by the rapid increase in Jrel (Fig. 3G) and the
accompanying rapid drop in CajSR (Fig. 3K). The resulting increase in Casub (Fig.
Figure 1.3: Time courses of simulated AP (A) and associated currents (B-F), fluxes (G and H) and calcium concentrations (I-K) in control steady-state conditions. Not shown is IK,ACh,
which is zero under control conditions. Note differences in ordinate scale. 0 500 1000 1500 -60 -40 -20 0 20 Vm (mV) A 0 500 1000 1500 -8 -6 -4 -2 0 2 Itot (pA/pF) B 0 500 1000 1500 -8 -6 -4 -2 0 2 (pA/pF) C 0 500 1000 1500 -60 -40 -20 0 20 Vm (mV) 0 500 1000 1500 0 100 200 300 Jrel (mM/s) G 0 500 1000 1500 0 0.2 0.4 0.6 0.8 Jup (mM/s) H ICa L IKr
1.3.2 Ionic currents during the DD phase
Figure 1.4 shows the time course of individual currents that play a relevant role during DD. The main inward currents during DD are ICaT, If, INaCa and ICaL.
ICaT activates before the membrane potential reaches MDP and reaches its
maximal current density in the first 100 ms of DD (early DD), thus contributing to DDR100, and then slowly decreases. If is considerably smaller than INaCa but its
amplitude during DD is comparable with that of the net inward current (Fig. 1.4B, dash-dotted line). Similar to ICaT, If starts activating when the membrane is still
repolarizing and it provides its maximal contribution in the first half of diastole. INaCa is a high-density inward current; it slowly diminishes during diastole,
whereas it rapidly increases at the end of DD, providing an important contribution to the AP upstroke. A small amount of INa window current is active during DD. It
is smaller than If, yet it is not negligible; it is able to modulate beating rate, as
demonstrated by our simulations of mutations in the sodium voltage-gated channel α subunit 5 (SCN5A) gene (see Chapter 3). ICaL follows a progressive
increase during DD and becomes the major contributor to the net inward current at the end of DD; it has a relevant role during both DD and AP.
INaK, IKr and IKs are the main outward currents. INaK slowly increases during DD
and reaches its maximal current density during AP, contributing to repolarization. IKr is the major driver in the repolarization process. It contributes to DD through
its progressive decrease during this phase. The contribution of IKs to DD is almost
negligible under control conditions, although gain-of function mutations can lead to a remarkable slowdown of pacemaking (see Chapter 3).
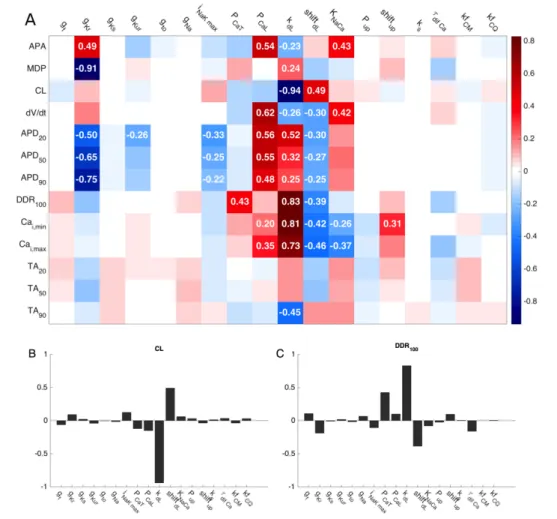
1.3.3 Sensitivity analysis
Among the randomly generated population of 500 models, more than 300 showed an auto-oscillating behaviour. The results of the sensitivity analysis are reported in Fig. 1.5A, which shows the coefficients of the sensitivity matrix B, coded in a colour map. Each value in the matrix shows how a change in the parameter P displayed at the top is capable of affecting the feature F displayed on the left, and the coefficients <−0.2 and >0.2 are reported in the corresponding pixel. The obtained map highlights that nine out of the starting 18 parameters
Figure 1.4: Membrane currents underlying diastolic depolarization. (A) Membrane potential and (B) associated net membrane current (Itot, dash-dotted trace)
during diastolic depolarization and contributing inward and outward currents. tMDP and
tTOP indicate the time at which Vm reaches MDP and take-off potential, respectively.
600 700 800 900 1000 1100 1200 -60 -50 -40 -30 V m ( m V ) t MDP tMDP+100 ms tTOP A 600 700 800 900 1000 1100 1200 Time (ms) -0.15 -0.1 -0.05 0 0.05 0.1 0.15 0.2 (pA/pF) I tot I CaT B I NaCa ICaL I Na I Kr I NaK IKs I f
show coefficients lower or higher than the selected thresholds of −0.2 and 0.2, respectively.
As illustrated in Fig. 1.5A, changes in the permeabilityof ICaL (PCaL) and its
activation kinetics (slope factor kdL and shift in half-activation voltage shiftdL)
have a large impact on upstroke velocity (dV/dt), AP duration (APD20,50,90) and
calcium transient. Furthermore, the kinetics of the ICaL activation gate dL strongly
affects CL and DDR100. Similarly, a change of the maximal conductance of IKr
(gKr) has a high impact on APA, MDP and APD, whereas the maximal activity of
NCX (KNaCa) strongly influences APA, dV/dt and calcium transient. Finally, a
shift in the working point of the SERCA pump (shiftup) clearly affects the
diastolic calcium concentration (Cai,min). Figure 1.5B shows that CL is largely
determined by the ICaL activation kinetics (through its parameters kdL and shiftdL).
Figure 1.5C shows that DDR100 is also largely determined by the activation
kinetics of ICaL but in the opposite way. In addition, it reveals that the permeability
of ICaT (PCaT) is also an important determinant of DDR100.
The parameter randomization, the first step of the linear regression approach, allowed us to explore a neighbourhood, in the parameter space, of the parameter set obtained as a result of the automatic optimization procedure. Only a few parameter sets (out of 500 tested) led to comparable values of the cost function. In particular, only four led to values of MDP, CL, APD90 and DDR100 within the
target range (i.e. mean ± SEM of experimental values) and only one parameter set led to a slightly lower value of the cost function than the one obtained from the ‘optimized’ set of parameters. To compare these two models, the effects on the pacemaking rate of mutations affecting If and INa (more details are provided in
Chapter 3) were compared for the two parameter sets. The ‘alternative’ set of parameters produced effects in close agreement with the ‘optimized’ set: the difference in mutation-induced changes in the pacemaking rate was always lower than 2.7%
The presence of multiple parameter sets compatible with experimental ranges allowed us to compute estimation intervals for the parameters that underwent the optimization procedure (Sarkar & Sobie, 2010). Nominal values and ranges for the optimized parameters are reported in Table A1 in Appendix 2. To confirm that
parameter values outside the estimated confidence interval lead to non-physiological (or at least non-basal) conditions, we tested the effect of changing PCaT by 50% more or 50% less with respect to the parent rabbit model (instead of
+15% as in the ‘optimized’ model). In accordance with the above observation that PCaT is an important determinant of DDR100, a large increase in PCaT led to a
notably higher beating rate (+17%; from 74 to 86 beats min–1), whereas a large decrease in permeability resulted in a slower beating rate (−18.9%; from 74 to 60 beats min–1). These results indicate that ICaT could play a substantial role in
pacemaking and underscore that the proposed value for PCaT is quite well
Figure 1.5 : Sensitivity Analysis
(A) Color coded map of sensitivity matrix B. Columns show how a specific parameter p affects AP and CaT features; rows show how each feature is affected by different parameters. Red, blue and white pixels represent positive, negative and no substantial correlation between parameters and features, respectively. Coefficients <-0.2 or >0.2 are considered substantial.
(B) and (C) Bar graphs describe how changes in each of the parameters affect CL and DDR100. The two panels display in a different way the information reported in rows 3 and 8
1.3.4 Calibration of the population of models
Figure 1.6 reports the auto-oscillating (black traces) the calibrated (red traces), the reference models (ciano trace), and compare them with experimental data (blue traces). The randomly generated population showed 318 out of 500 self-oscillating models. The calibration perfomed using MDP, CL, APD90 and
DDR100, as features to be satisfied, reduced the number of models to only 4. The
calibrated models showed a MDP = -62.2, -61.8, -60.8 and -59.3 mV, respectively; slightly hyperpolarized with respect to the reference model. The CL was slighltly higher (CL = 819, 827, 828 and 834 ms vs 814 ms) in all the four cases. APD90 was 146, 162, 145 and 149 ms, respectively; two models showed
Figure 1.6: Calibration of the population of models
Comparison between autoscillating (black traces), calibrated (red traces), reference model (ciano trace) and experimental data (blue traces). Among the 500 randomly generated cell models, 318 mantained the automaticity. Four cell models showed MDP, CL, APD90 and
DDR100 falling within the mean±SEM rexperimental range and then were compared with the
DDR100 lower (DDR100 = 39.5, 37.0 mV/s) and two higher (DDR100 = 52.3, 56.1
mV/s) than the reference model (DDR100 = 48.1 mV/s).
The diastolic (Cai,min) and systolic (Cai,max) Ca2+ values were close to the
reference model in two cases out of four (Cai,min = 95 and 88 nM vs 84 nM and
Cai,max= 192 and 194 nM vs 189 nM). The other models showed lower levels both
for diastolic (Cai,min = 65 and 57 nM) and systolic Ca2+ (Cai,max = 153 and 137
nM).
1.4 Discussion
In the present study, we formulated a comprehensive human SAN AP model, starting from a state-of-the-art model of rabbit cardiac pacemaker cells, and converting it into a species-specific description using human experimental data as far as possible. A novel aspect is the adoption of an automatic optimization procedure, tightly bounded by the AP features, to identify the parameters for which experimental data are presently unavailable.
Previously, Chandler et al. (2009) showed that scaling ion current densities, according to the gene expression pattern they found in human SAN vs. atrial tissue, gives rise to automaticity in the human atrial cell model of Courtemanche
et al. (1998). However, the values of the descriptive parameters of AP, in
particular MDP, APA and APD, were far from the experimentally observed ones. As will be further detailed in Chapter 2 and 3, our model is able to reproduce the main experimentally observed electrophysiological features (AP waveform, calcium transient) and the simulated changes in pacemaking rate as a result of mutations affecting ionic channels are in line with clinical data. Furthermore, it allows the investigation of relevant conditions such as If block, NCX block and