Chapter 5 – DISCUSSION OF ACHIEVED RESULTS
5.1 PROCEDURE AND LIST OF PERFORMED CALCULATIONS
For all the simulations performed, the following procedure was executed:
In RELAP-PARCS coupling, the analyses have been carried out with the following steps: • Steady-state calculation using RELAP5/3.3 in a stand-alone mode, with 0-D neutron kinetic
calculation, in order to verify the correctness of the TH nodalization;
• Null transient calculation using RELAP5/3.3 in a stand-alone, with a duration of 100 seconds. This serves to verify if there is any perturbation or problems in the input deck; • Steady-state calculation with coupled codes RELAP-PARCS, using the restart file obtained
by RELAP5/3.3;
• Transient calculation with PARCS alone, in order to have indication of power excursion and reactivity trend, before TH coupling;
• Transient calculation with coupled codes RELAP-PARCS, using their both restart files generated in the previous steady-state calculation; and
• General data processing, using Fortran programs and commercial software.
In RELAP5/3D-NESTLE coupling, the analyses have been carried out with the following steps: • Steady-state calculation launching RELAP5/3D in order to verify the correctness of the
nodalization;
• Transient calculation launching RELAP5/3D, using restart file generated in the previous steady-state calculation; and
• General data processing, using Fortran programs and commercial software.
Calculation were performed in order to obtain the following results:
• Reactivity and power excursion during the control rod ejection accident; • Spatial power distribution (axially and radially) during transient;
• Energy released to the fuel during REA;
• Time trend of the clad and fuel centerline temperatures for the FA most affected by the transient; and
In order to perform analyses in different power conditions of the reactor, with a wide range of reactivity insertion, three reference cases were idealized, in which a rod ejection accident was postulated, as indicated in Table 5.1.
REF. N° REFERENCE CASE CONTROL ROD
CONFIGURATION
1 HFP_40% Bank 1-7 ARO
CA# 8 is 40% withdrawn
2 HZP_1rod Bank 1 - 7 ARI
CA# 8 is 100% inserted
3 HZP_2rods
Bank 1 & 3 ARI Bank 2, 4 & 5-7 ARO Bank 8 is 100% inserted
5.2 STEADY-STATE CALCULATION
Before transient implementation, calculation methods are adjusted based on a series of stationary configurations. Three steady-state calculations were performed, according to the reference cases presented in Table 5.2.
Regarding the HFP condition, a synthesis of the main relevant parameters calculated by coupled codes and reference values are presented in Table 5.2.
PARAMETER DESIGN VALUE RELAP5/3.3-PARCS RELAP5/3D- NESTLE
Total core power output (MWt) 2772.0 2772.0 2772.0
RCS cold leg temperature (°C) 291.0 290.2 290.8
RCS hot leg temperature (°C) 318.0 339.8 320.5
RCS pressure (MPa) 14.96 14.99 14.95
Lower plenum pressure (MPa) 15.36 15.31 15.31
Upper plenum pressure (MPa) 15.17 15.13 15.13
Core pressure drop (kPa) 200.0 192 190
Reactor coolant system pressure drop (kPa) 738.0 450 439
Total RCS flow rate (kg/s) 17602.2 17100.6 16917.7
Core flow rate (kg/s) 16052.0 16383.9 16375.42
PRZ level (cm) 558.8 558.7 558.53
Feedwater flow per OTSG 761.59 761.59 761.59
OTSG inlet temperature (°C) 299.5 292.5 295.8
OTSG outlet pressure (MPa) 6.41 6.41 6.41
Feedwater temperature (°C) 237.8 237.7 237.7
The most important parameter in steady-state calculation is the spatial power distribution. Axial power distribution is presented in Fig. 5.1; a confrontation with the reference data provided by the benchmark is also presented. As it can be seen, stationary study results confirm the consistency between the codes and reference data.
Radial power distribution is showed in Fig. 5.2 and 5.3, where a three-dimensional view of reactor core is provided. As can be observed from the figures, there is an homogeneous power distribution inside the reactor core.
Radial assembly wise fuel centreline and moderator temperature distributions are presented in Fig. 5.4 and 5.5, respectively. An uniform distribution of this parameters can be observed inside reactor core in steady-state regime.
Axial Power Distribution - HFP
0 0.2 0.4 0.6 0.8 1 1.2 1.4 0 1 2 3 4 5 6 7 8 9 10 11 12 13 14 15 16 17 18 19 20 21 22 23 24 25 26
Axial plane number
R e la ti v e p o w e r Relap 3D Relap-Parcs Reference
X 5 10 15 Y 5 10 15 Re la ti v e A s s e mb ly P o w e r 0 0.5 1 1.3 1.2 1.1 1 0.9 0.8 0.7 0.6 0.5 0.4 0.3 0.2 0.1 Frame 001 26 Nov 2005 Radial Power Distribution - HFP
Figure 5.2 – Radial power distribution (HFP)
X Y 5 10 15 5 10 15 1.3 1.2 1.1 1 0.9 0.8 0.7 0.6 0.5 0.4 0.3 0.2 0.1 Frame 001 26 Nov 2005 Radial Power Distribution - HFP
X 5 10 15 Y 5 10 15 T e m p e ra tu re 0 200 400 600 800 1000 1200 Temperature 1200 1100 1000 900 800 700 600 500 400 300 200 100 Frame 001 28 Nov 2005 Assemblywise Averaged Fuel Centerline Temp.Distribution - HFP
Figure 5.4 – Fuel centerline temperature distribution (HFP)
X 5 10 15 Y 5 10 15 T e m p e ra tu re 0 50 100 150 200 250 300 Temperature 300 280 260 240 220 200 180 160 140 120 100 80 60 40 20 Frame 001 28 Nov 2005 Assemblywise Moderator Temp. Distribution - HFP
Concerning the HZP condition, a synthesis of the main relevant parameters are presented below:
• Core power is equal to 0.1% PN (2772 kWt);
• Full flow and operating pressure; • 5 ppm boron concentration; • Moderator temperature of 551°K; • Moderator density of 766 kg/m3
; • All control rods inserted; and
• Xe distribution fixed at HFP conditions;
Axial power distribution is presented in Fig. 5.6. Plane numbering starts from bottom and extends to the top of the reactor core; as it can be seen, stationary study results confirm the consistency between the adopted codes.
Radial power distribution is showed in Fig. 5.7 and 5.8, where a three-dimensional view of reactor core is provided. As can be observed from the figures, there is an homogeneous power distribution inside the reactor core.
Radial assembly wise fuel centreline and moderator temperature distributions are presented in Fig. 5.9 and 5.10, respectively. An uniform distribution of this parameters can be observed inside reactor core in steady-state regime.
Axial power distribution in HZP
0 0.5 1 1.5 2 2.5 3 1 2 3 4 5 6 7 8 9 10 11 12 13 14 15 16 17 18 19 20 21 22 23 24 25 26
Axial plane number
R e la ti v e p o w e r Parcs-Relap Relap3D
X 5 10 15 Y 5 10 15 R e la ti v e A s s e m b ly P o w e r 0 1 1.5 1.4 1.3 1.2 1.1 1 0.9 0.8 0.7 0.6 0.5 0.4 0.3 0.2 0.1
Frame 001 15 Dec 2005 Radial Power Distribution - HZP
Figure 5.7 – Radial power distribution (HZP)
X Y 5 10 15 5 10 15 1.5 1.4 1.3 1.2 1.1 1 0.9 0.8 0.7 0.6 0.5 0.4 0.3 0.2 0.1
Frame 001 15 Dec 2005 Radial Power Distribution - HZP
X 5 10 15 Y 5 10 15 T e m p e ra tu re 0 100 200 300 400 500 Temperature 500 450 400 350 300 250 200 150 100 50 Frame 001 28 Nov 2005 Assemblywise Averaged Fuel Centerline Temp.Distribution - HZP
Figure 5.9 – Fuel centerline temperature distribution (HZP)
X 5 10 15 Y 5 10 15 T e m p e ra tu re 0 50 100 150 200 250 Temperature 260 240 220 200 180 160 140 120 100 80 60 40 20 Frame 001 26 Nov 2005 Assemblywise Moderator Temp. Distribution - HZP
5.3 TRANSIENT CALCULATION
Transient calculations were performed for each reference case listed in Table 5.1. In this section, all relevant results will be presented, by means of figures and graphics representing the main parameters governing the transient, such as the power and reactivity excursion, clad temperature, pressure evolution in PRZ, LP, UP, OTSG, fuel temperature at different elevations, PZR level, coolant mass flow rate in HL and CL, and finally the core inlet temperature evolution.
The basic scenario envisaged is supposed to be originated by a fast ejection of one control assembly, while the reactor is operating at EOC. The fraction of delayed neutrons being 521 pcm. The fuel up rates of the various assemblies differ from 23 to 58 GWd/t, an average radial burn-up rate being considered for each assembly.
Transient duration of 8 seconds was established for all reference cases. The CA ejection duration is 100 ms, and it takes place at tejection = 1sec, after transient starts.
Regarding processing time and computational resources used, it should be noted that each transient implied a running time of roughly 30 minutes on a notebook equipped with a 1.6 GHz Intel™ processor and a Windows™ XP™ operating system.
Scram set-point for 114% of Nominal Power was delayed in 0.3 seconds; Scram duration was 2.3 seconds.
During the present work, the concept of control rod (CR) and control assembly (CA) are used interchangeably,as a reference to the cluster containing many neutron absorbing rods, applied to a fuel assembly in order to control local reactivity.
The ejection of the CR has local effects, but it also influences the total reactor power. A power peak is caused in the first instants of the transient and without any action the reactor tends to find a new stationary condition. Locally the temperature of the channel where the CR moves rises, and the fuel temperature in the upper part rises too.
5.3.1 HZP – 1 CONTROL ROD EJECTION
In this first reference case, accident is initiated from a critical core at HZP and is characterized by the ejection of the CA n° 8, which has the highest worth value ($0.80), as calculated in the previous chapter. Fig. 5.11corresponds to the control bank configuration used for this transient. The rods of the regulation banks (5, 6 and 7) and safety banks (1, 2, 3 and 4) are fully inserted in the core.
1 6 1 3 5 5 3 7 7 8 3 5 4 4 5 3 1 6 2 6 1 5 4 2 2 4 5 6 7 2 7 2 7 6 5 4 2 2 4 5 1 6 2 6 1 3 5 4 4 5 3 7 7 7 3 5 5 3 1 6 1
Figure 5.11 – Control rod configuration for HZP CA#8 ejection
Initially, the core power is 0.1 % PN (with PN = 2772 MW), the pressure is 151.68 bars, the
average moderator temperature is 551 °K, the water density is 0.7695 g/cc, the fuel temperature is 551 K, and the boron mass concentration is 5 ppm.
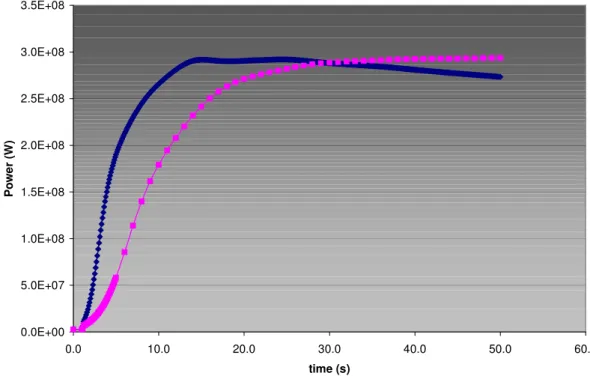
The transient is characterised by a prompt increase in the total reactivity in the core, as seen in Fig. 5.12. The power excursion follows the trend of the reactivity inserted, resulting in a prompt increase of approximately 4 times the initial power; then, power continues to increase till the new power condition (11 % of PN) be reached (Fig. 5.14 and 5.15).
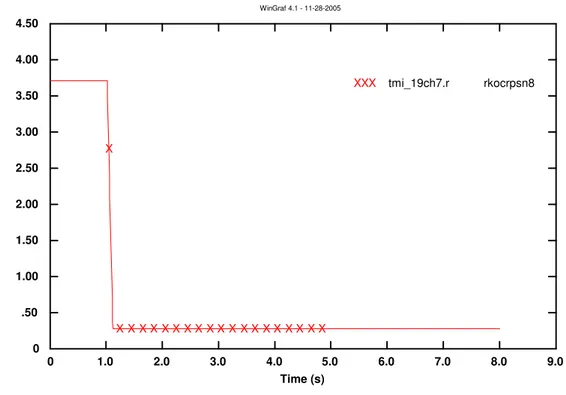
The time trend of CA n° 8 ejection from reactor core, plotted as a function of the tip of the rod distance from top reflector, calculated with RELAP5/3D is presented in Fig 5.13.
This behaviour confirms that the reactor in object, in the history condition evaluated (set of cross sections used at EOC), at HZP, reacts very well to the ejection of the most reactive CA. Increase in fuel or clad temperatures do not present any risk concerning reactor safety.
Calculations performed with coupled codes RELAP-PARCS and RELAP5/3D-Nestle are presented in Fig. 5.15. They show a good agreement, despite power increase in the latter occurs more slowly. However, both tend asymptotically to same new power condition, after feedback reactivity compensation.
The different contributions to the reactivity versus time obtained by PARCS during the transient are plotted in Fig. 5.12. The global reactivity, which grows for 100 ms until reaching the inserted reactivity ($0.8), start falling at around 2 s, when the Doppler feedback becomes significant. This decrease is accelerated in the following seconds by the moderator effect. Moreover, it should be noted that all the reactivity feedback occurs after the complete central rod ejection.
Fig. 5.16 presents power excursion in different zones of channel 179, where CA ejection occurred, on different axial planes, as provided by the nodalization implemented with RELAP5/3D.
Reactivity excursion - HZP rod ejection
-0.4 -0.2 0 0.2 0.4 0.6 0.8 1 0 1 2 3 4 5 6 7 8 9 Time (s) R e a c ti v it y ( $ ) sumrho tfrho dmrho crrho
Figure 5.12 – Different contributes in reactivity excursion calculated with PARCS during REA in HZP
0 1.0 2.0 3.0 4.0 5.0 6.0 7.0 8.0 9.0 Time (s) 0 .50 1.00 1.50 2.00 2.50 3.00 3.50 4.00 4.50 ro d i n s e rt io n f ro m t o p c o re ( m ) WinGraf 4.1 - 11-28-2005 XXX tmi_19ch7.r rkocrpsn8 X X X X X X X X X X X X X X X X X X X X
Figure 5.13 – CA n° 8 ejection from the core calculated with RELAP5/3D during REA in HZP
Power excursion - HZP rod ejection
0.0% 0.1% 0.2% 0.3% 0.4% 0.5% 1 1.05 1.1 1.15 1.2 1.25 1.3 Time (s) P o w e r (% ) Power Level
Figure 5.14 – Power excursion calculated with RELAP5 during REA in HZP
Power excursion - HZP rod ejection 0.0E+00 5.0E+07 1.0E+08 1.5E+08 2.0E+08 2.5E+08 3.0E+08 3.5E+08 0.0 10.0 20.0 30.0 40.0 50.0 60.0 time (s) P o w e r (W ) Relap 3D Relap-Parcs
Figure 5.15 – Power excursion calculated with coupled codes during REA in HZP 0 1.0 2.0 3.0 4.0 5.0 6.0 Time (s) 0 .2 .4 .6 .8 1 1.2 1.4 1.6 x 10 5 P o w e r (W ) WinGraf 4.1 - 11-28-2005 XXX tmi_19ch7.r rkozntpw523 X X X X X X X X X X X X X X X X X X X X
YYY tmi_19ch7.r rkozntpw520
Y Y Y Y Y Y Y Y Y Y Y Y Y Y Y Y Y Y Y Y ZZZ tmi_19ch7.r rkozntpw515 Z Z Z Z Z Z Z Z Z Z Z Z Z Z Z Z Z Z Z Z VVV tmi_19ch7.r rkozntpw510 V V V V V V V V V V V V V V V V V V V V JJJ tmi_19ch7.r rkozntpw501 J J J J J J J J J J J J J J J J J J J
Figure 5.16 – Power excursion in thermal-hydraulic zones of TH channel 19 calculated with RELAP5/3D during REA in HZP
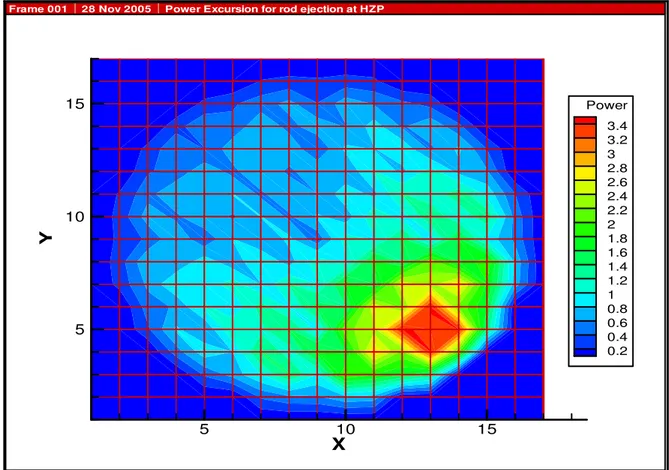
The averaged radial assembly power distributions are illustrated in Table 5.3 and Fig. 5.18, at the time of maximum power. The maximum power, after the rod ejection, is reached in the assembly (12,5), adjacent to the one which contains the ejected rod (13,5). This can also be seen in Fig. 5.19, where a view from the top of the 3D surface generated is presented.
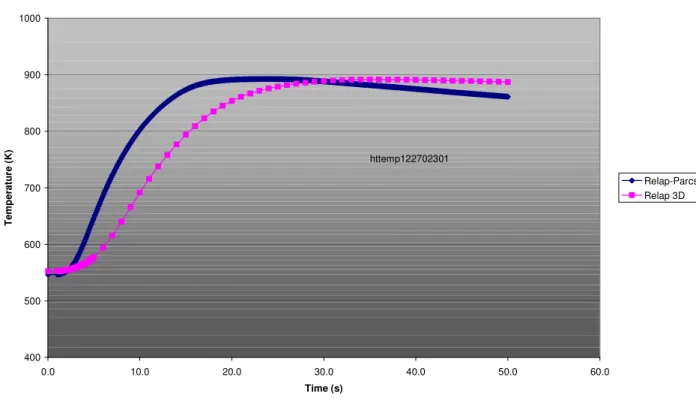
Fuel centreline temperature variation is presented in Fig. 5.17, whereas the calculated energy released to the fuel during transient is showed in Fig. 5.20 and 5.21.
In the remaining figures in this section (Fig. 5.22 to 5.26), HL temperature, PRZ pressure, UP and LP pressure variation are plotted. It can be noted that no relevant variation was inflicted to main plant operational parameters regarding safety aspects.
Fuel CL Temperature Variation - HZP rod ejection
400 500 600 700 800 900 1000 0.0 10.0 20.0 30.0 40.0 50.0 60.0 Time (s) T e m p e ra tu re ( K ) Relap-Parcs Relap 3D httemp122702301
Figure 5.17 – Fuel CL Temperature variation calculated with coupled codes during REA in HZP
2 3 4 5 6 7 8 9 10 11 12 13 14 15 16 2 0.431 0.561 0.570 0.763 0.719 3 0.431 0.679 1.004 1.424 0.986 1.996 1.804 1.627 1.349 4 0.503 0.927 0.798 1.431 1.099 1.691 1.590 2.770 2.147 3.411 2.014 5 0.363 0.837 0.605 1.199 1.145 1.448 0.908 2.152 2.311 3.457 3.305 3.405 1.344 6 0.502 0.631 1.043 0.809 1.297 0.958 1.503 1.389 2.549 2.125 3.447 2.135 1.615 7 0.263 0.645 0.983 0.863 1.103 0.793 1.215 0.991 1.686 1.456 2.536 2.292 2.740 1.781 0.708 8 0.303 0.790 0.639 0.916 0.673 0.987 0.713 1.118 0.955 1.671 1.370 2.117 1.561 1.955 0.746 9 0.249 0.437 0.769 0.438 0.811 0.621 0.849 0.466 1.096 0.966 1.454 0.876 1.635 0.952 0.548 10 0.271 0.700 0.558 0.782 0.565 0.809 0.560 0.832 0.686 1.159 0.908 1.368 1.037 1.342 0.530 11 0.221 0.529 0.784 0.665 0.814 0.555 0.796 0.598 0.934 0.744 1.210 1.066 1.331 0.934 0.403 12 0.382 0.465 0.737 0.537 0.804 0.549 0.774 0.628 1.020 0.745 1.103 0.734 0.626 13 0.258 0.572 0.393 0.728 0.649 0.753 0.414 0.846 0.791 0.952 0.551 0.844 0.394 14 0.325 0.567 0.456 0.758 0.532 0.717 0.586 0.894 0.572 0.757 0.456 15 0.254 0.372 0.508 0.664 0.406 0.722 0.584 0.454 0.328 16 0.212 0.257 0.232 0.277 0.239
Table 5.3 – Averaged radial assembly power distribution at t = 1.51 s, during REA at HFP X 5 10 15 Y 5 10 15 P o w e r 0 1 2 3 Power 3.4 3.2 3 2.8 2.6 2.4 2.2 2 1.8 1.6 1.4 1.2 1 0.8 0.6 0.4 0.2 Frame 001 28 Nov 2005 Power Excursion for rod ejection at HZP
Figure 5.18 – Radial power distribution at t = 1.51 s during REA (HZP) – Top view
X Y 5 10 15 5 10 15 Power 3.4 3.2 3 2.8 2.6 2.4 2.2 2 1.8 1.6 1.4 1.2 1 0.8 0.6 0.4 0.2 Frame 001 28 Nov 2005 Power Excursion for rod ejection at HZP
Figure 5.19 – Radial power distribution at t = 1.51 s during REA (HZP) – Top view
Energy Released to Fuel during REA
0.0 10.0 20.0 30.0 40.0 50.0 60.0 0 1 2 3 4 5 6 7 8 9 Time (s) E n e rg y ( K J /k g ) Plane 01 Plane 05 Plane 10 Plane 15 Plane 18
Figure 5.20 – Energy released to fuel, on axial planes 1, 5, 10, 15 & 18 inside channel S, during REA at HZP
Energy Released to Fuel during REA 0.0 10.0 20.0 30.0 40.0 50.0 60.0 70.0 80.0 90.0 0 1 2 3 4 5 6 7 8 9 Time (s) E n e rg y ( K J /k g ) Plane 20 Plane 21 Plane 22 Plane 23 Plane 24
Figure 5.21 – Energy released to fuel, on axial planes 20, 21, 22, 23 & 24 inside channel S, during REA at HZP 0 1.0 2.0 3.0 4.0 5.0 6.0 7.0 8.0 9.0 Time (s) 550.00 550.50 551.00 551.50 552.00 552.50 553.00 553.50 554.00 554.50 T e m p ( K ) WinGraf 4.1 - 11-28-2005 XXX tmi_19ch7.r tempf200010000 X X X X X X X X XX X X X X X X X X X X
Figure 5.22 – Hot leg temperature (Vol. n° 200) calculated with RELAP5/3D during REA in HZP
0 2.0 4.0 6.0 8.0 10.0 12.0 Time (s) 1.48 1.48 1.48 1.49 1.49 1.49 1.49 1.5 1.5 1.5 x 10 7 P re s s u re ( P a ) WinGraf 4.1 - 11-28-2005 XXX tmi_19ch7.r p200010000 XXXXXXXXXXXXXXXXXXXX
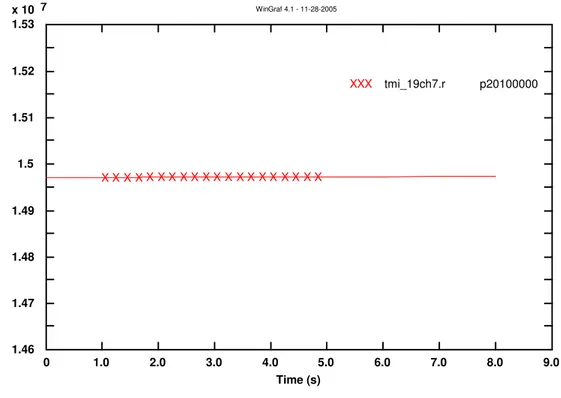
Figure 5.23 – Hot leg pressure (Vol. n° 200) calculated with RELAP5/3D during REA in HZP 0 1.0 2.0 3.0 4.0 5.0 6.0 7.0 8.0 9.0 Time (s) 1.46 1.47 1.48 1.49 1.5 1.51 1.52 1.53 x 10 7 P re s s u re ( P a ) WinGraf 4.1 - 11-28-2005 XXX tmi_19ch7.r p20100000 X X X X X X X X X X X X X X X X X X X X
Figure 5.24 – Pressurizer pressure calculated with RELAP5/3D during collapsed REA in HZP
0 1.0 2.0 3.0 4.0 5.0 6.0 7.0 8.0 9.0 Time (s) 1.5 1.5 1.5 1.51 1.51 1.51 1.51 1.52 1.52 1.52 x 10 7 P re s s u re ( P a ) WinGraf 4.1 - 11-28-2005 XXX tmi_19ch7.r p180010000 X XX X X X X X X X X X X X X X X X X X
Figure 5.25 – Upper plenum pressure trend calculated with RELAP5/3D during REA in HZP 0 1.0 2.0 3.0 4.0 5.0 6.0 7.0 8.0 9.0 Time (s) 1.52 1.53 1.53 1.53 1.53 1.53 1.54 x 10 7 P re s s u re ( P a ) WinGraf 4.1 - 11-28-2005 XXX tmi_19ch7.r p100010000 XX XX X XX X X X XX X X X X X X X X
Figure 5.26 – Lower plenum pressure trend calculated with RELAP5/3D during REA in HZP
5.3.2 HZP – COLLAPSED CONTROL ROD EJECTION
This reference case was created to idealize an accident with reactivity insertion beyond prompt critical, in order to verify core behaviour and evaluate parameters related to safety, although it is known that the probability of ejection of two different adjacent control assemblies is negligible for safety analysis. This was done because, in HZP condition, the ejection of the control assembly with the higher rod worth value do not have a large impact on core behaviour and could not cause the reactor to go beyond prompt critical. So, the concept was to consider an ejection of two adjacent control assemblies collapsed and inserted in the same thermal-hydraulic channel.
New nodalizations had to be provided – in 3D neutronic and thermal-hydraulic codes - in order to cope with this transient.
Basically, the accident is initiated from a critical core at HZP and is characterized by the ejection of a collapsed control assembly, indicated as CA n° 8 in Fig. 5.27. In the TH nodalization, these two FA belong to the same TH channel. The rods of the regulation banks (5, 6 and 7) and safety banks (2 and 4) are fully inserted in the core. The transient is completed in 8 seconds and simulations were performed with reactor trip not activated.
1 6 1 3 5 5 3 7 7 8 3 5 4 4 8 3 1 6 2 6 1 5 4 2 2 4 5 6 7 2 7 2 7 6 5 4 2 2 4 5 1 6 2 6 1 3 5 4 4 5 3 7 7 7 3 5 5 3 1 6 1
Core behaviour during this transient was the typical one encountered in REA with high reactivity insertion [7]; a power spike turned around by Doppler effect, followed by a period of low power decay. In this calculation, reactor trip was delayed to simplify the comparison between methodologies used to simulate the problem. Normally, the shutdown banks would enter the core and their effect would be felt at around 2 seconds after transient starts.
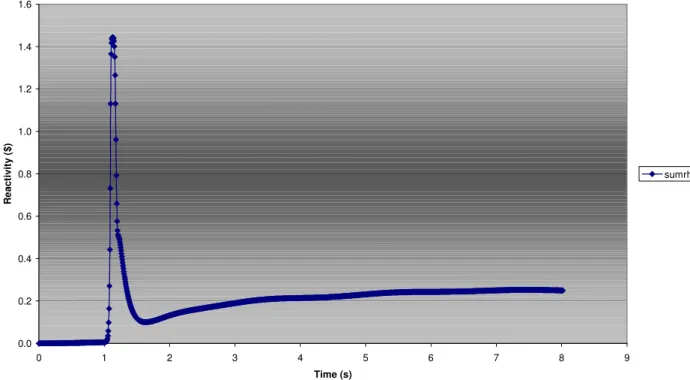
Different contributions to the reactivity versus time obtained by PARCS during this transient are plotted in Fig. 5.29. The global reactivity grows rapidly and at t = 1.13 s reaches the total inserted reactivity (1.44 $), and starts to fall promptly because of the Doppler feedback. As can be drawn from this figure, the moderator feedback is as strong in magnitude as the Doppler feedback, but it starts being felt with some delay.
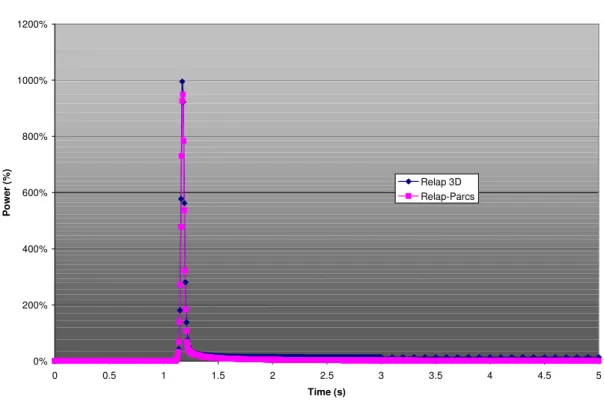
This magnitude of reactivity insertion caused a sharp power spike, as can be seen in Fig. 5.30 and 5.31. A power peak of more than 900% PN was predicted by both coupled codes; PARCS
code in a stand-alone mode (meaning that limited TH feedback was used) calculated a peak of 500% PN. Table 5.4 presents information about the main important transient parameters.
PARAMETER PARCS ALONE RELAP5/3.3-PARCS RELAP5/3D- NESTLE
Control rod worth ($) 1.44 1.44 1.44
Peak power (% nominal) 530.8 949.2 994.8
Time of peak (s) 1.185 1.178 1.175
Pulse width (ms) 42 30 29
Table 5.4 – Power pulse data and transient parameters
More detailed information on the power pulse, namely the pulse width and time of the peak, can be derived from Fig. 5.32, in which the power spikes calculated by adopted methodologies are confronted. The agreement between calculations is very good.
Figures 5.41 to 5.45 present FA power excursion in different zones of the core, on different axial planes, as provided in the nodalization implemented with RELAP5/3D (Fig. 5.40). These information, owing to the way input deck is inserted in the nodalization adopted by RELAP5/3D can be readily derived from restart file generated.
Fuel Centerline and clad temperature variation during transient, on different axial planes of the channel where rod ejection occurred, calculated with RELAP5/3D during collapsed rod ejection, are presented in Figures 5.46 and 5.47.
Total reactivity excursion - HZP collapsed rod ejection 0.0 0.2 0.4 0.6 0.8 1.0 1.2 1.4 1.6 0 1 2 3 4 5 6 7 8 9 Time (s) R e a c ti v it y ( $ ) sumrho
Figure 5.28 – Total reactivity excursion calculated by PARCS during collapsed REA in HZP
Reactivity excursion - HZP collapsed rod ejection
-1.0 -0.5 0.0 0.5 1.0 1.5 2.0 0 1 2 3 4 5 6 7 8 9 Time (s) R e a c ti v it y ( $ ) sumrho tfrho dmrho crrho
Figure 5.29 – Different contributes in reactivity excursion calculated with coupled RELAP-PARCS during collapsed REA in HZP
Power Excursion - HZP collapsed rod ejection 0% 100% 200% 300% 400% 500% 600% 0 0.5 1 1.5 2 2.5 3 3.5 4 4.5 5 Time (s) P o w e r (% ) Parcs Alone
Figure 5.30 – Reactivity excursion calculated with PARCS during Collapsed REA in HZP
Power Excursion - HZP collpsed rod ejection
0% 200% 400% 600% 800% 1000% 1200% 0 0.5 1 1.5 2 2.5 3 3.5 4 4.5 5 Time (s) P o w e r (% ) Relap 3D Relap-Parcs
Figure 5.31 – Power excursion calculated with coupled codes during Collapsed REA in HZP
Power Excursion - HZP 2 rods 0% 200% 400% 600% 800% 1000% 1200% 1 1.05 1.1 1.15 1.2 1.25 1.3 1.35 1.4 1.45 1.5 time(s) P o w e r (% P N ) Relap/Parcs Relap3D Parcs Alone
Figure 5.32 – Reactivity excursion calculated with coupled RELAP-PARCS during Collapsed REA in HZP
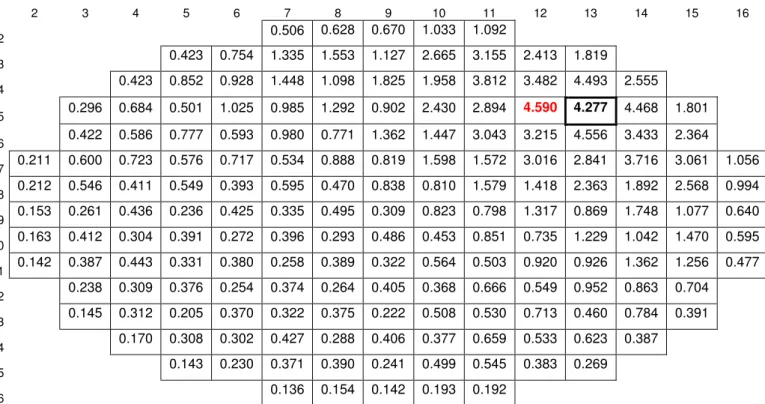
The averaged radial assembly power distributions are illustrated in Table 5.5 and Fig. 5.33, at the time of maximum power. The maximum power, after the rod ejection, is reached in the closest less irradiated assembly (12,5) to the one which contains the ejected rod (13,5). This can also be seen in Fig. 5.34, where a view from the top of the 3D surface generated is presented.
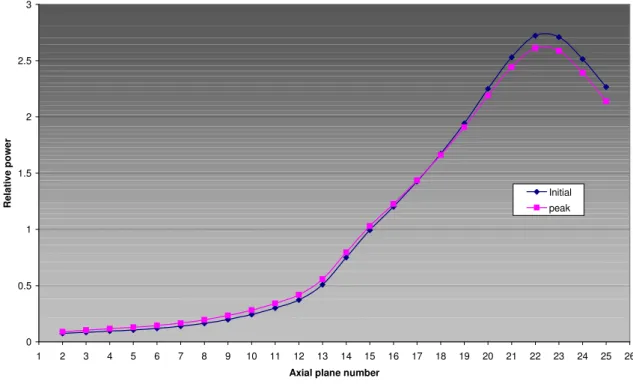
On the other hand, axial power distribution, during rod ejection, remains practically uninfluenced, as showed in Fig. 5.35. It can be noticed a modest decrease in the relative power in the core upper zones, where most of producing power is concentrated.
Energy released to the fuel during transient is presented in Fig. 5.36 and 5.37.
In the remaining figures in this section (Fig. 5.48 to 5.51), HL temperature, PRZ pressure, UP and LP pressure variation are plotted. It can be noted that no relevant variation was inflicted to main plant operational parameters regarding safety aspects. It was also verified the time trend of the void fraction at the outlet of the hottest channel and no change was observed.
2 3 4 5 6 7 8 9 10 11 12 13 14 15 16 2 0.506 0.628 0.670 1.033 1.092 3 0.423 0.754 1.335 1.553 1.127 2.665 3.155 2.413 1.819 4 0.423 0.852 0.928 1.448 1.098 1.825 1.958 3.812 3.482 4.493 2.555 5 0.296 0.684 0.501 1.025 0.985 1.292 0.902 2.430 2.894 4.590 4.277 4.468 1.801 6 0.422 0.586 0.777 0.593 0.980 0.771 1.362 1.447 3.043 3.215 4.556 3.433 2.364 7 0.211 0.600 0.723 0.576 0.717 0.534 0.888 0.819 1.598 1.572 3.016 2.841 3.716 3.061 1.056 8 0.212 0.546 0.411 0.549 0.393 0.595 0.470 0.838 0.810 1.579 1.418 2.363 1.892 2.568 0.994 9 0.153 0.261 0.436 0.236 0.425 0.335 0.495 0.309 0.823 0.798 1.317 0.869 1.748 1.077 0.640 10 0.163 0.412 0.304 0.391 0.272 0.396 0.293 0.486 0.453 0.851 0.735 1.229 1.042 1.470 0.595 11 0.142 0.387 0.443 0.331 0.380 0.258 0.389 0.322 0.564 0.503 0.920 0.926 1.362 1.256 0.477 12 0.238 0.309 0.376 0.254 0.374 0.264 0.405 0.368 0.666 0.549 0.952 0.863 0.704 13 0.145 0.312 0.205 0.370 0.322 0.375 0.222 0.508 0.530 0.713 0.460 0.784 0.391 14 0.170 0.308 0.302 0.427 0.288 0.406 0.377 0.659 0.533 0.623 0.387 15 0.143 0.230 0.371 0.390 0.241 0.499 0.545 0.383 0.269 16 0.136 0.154 0.142 0.193 0.192
Table 5.5 – Averaged radial assembly power distribution at t = 1.178 s, corresponding to peak power 949,25 % during collapsed REA in HZP
X 5 10 15 Y 5 10 15 P o w e r 0 1 2 3 4 Power 4.2 4 3.8 3.6 3.4 3.2 3 2.8 2.6 2.4 2.2 2 1.8 1.6 1.4 1.2 1 0.8 0.6 0.4 0.2 Frame 001 27 Nov 2005 Power Excursion
X Y 5 10 15 5 10 15 Power 4.2 4 3.8 3.6 3.4 3.2 3 2.8 2.6 2.4 2.2 2 1.8 1.6 1.4 1.2 1 0.8 0.6 0.4 0.2
Frame 001 27 Nov 2005 Power Excursion
Figure 5.34 – Radial power distribution at t = 1.178 s during collapsed REA (HZP) – Top view
Axial power distribution during transient
0 0.5 1 1.5 2 2.5 3 1 2 3 4 5 6 7 8 9 10 11 12 13 14 15 16 17 18 19 20 21 22 23 24 25 26
Axial plane number
R e la ti v e p o w e r Initial peak
Figure 5.35 – Axial power distribution at t=0 and t = 1.178 s, corresponding to peak power during collapsed REA in HZP
Energy Released to Fuel during REA 0.0 20.0 40.0 60.0 80.0 100.0 120.0 140.0 160.0 180.0 0 1 2 3 4 5 6 7 8 9 Time (s) E n e rg y ( K J /k g ) plane 01 plane 05 plane 10 plane 15 plane 18
Figure 5.36 – Energy released to fuel, on axial planes 1, 5, 10, 15 & 18 inside channel S, during collapsed REA in HZP
Energy Released to Fuel during REA
0.0 20.0 40.0 60.0 80.0 100.0 120.0 140.0 160.0 180.0 200.0 0 1 2 3 4 5 6 7 8 9 Time (s) E n e rg y ( K J /k g ) Plane 20 Plane 21 Plane 22 Plane 23 Plane 24
Figure 5.37 – Energy released to fuel, on axial planes 20, 21, 22, 23 & 24 inside channel S, during collapsed REA in HZP
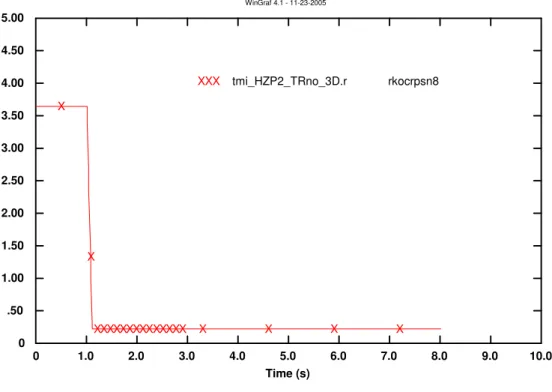
0 1.0 2.0 3.0 4.0 5.0 6.0 7.0 8.0 9.0 Time (s) -.5 0 .5 1 1.5 2 2.5 3 3.5 x 10 10 P o w e r (P a ) WinGraf 4.1 - 11-23-2005 XXX tmi_HZP2_TRno_3D.r rkotpow0 X X X XXXXXXXXXXXXX X X X X
Figure 5.38 – Reactor power excursion calculated with RELAP5/3D during collapsed REA in HZP 0 1.0 2.0 3.0 4.0 5.0 6.0 7.0 8.0 9.0 10.0 Time (s) 0 .50 1.00 1.50 2.00 2.50 3.00 3.50 4.00 4.50 5.00 D is ta n c e f ro m t o p c o re ( m ) WinGraf 4.1 - 11-23-2005 XXX tmi_HZP2_TRno_3D.r rkocrpsn8 X X XXXXXXXXXXXXXX X X X X
Figure 5.39 – CA n° 8 ejection from the core calculated with RELAP5/3D during collapsed REA in HZP
Figure 5.40 – TH zones used in RELAP5/3D neutronic nodalization for collapsed REA in HZP .40 .60 .80 1.00 1.20 1.40 1.60 1.80 2.00 2.20 Time (s) -.2 0 .2 .4 .6 .8 1 1.2 1.4 1.6 x 10 8 P o w e r (P a ) WinGraf 4.1 - 11-23-2005 XXX tmi_HZP2_TRno_3D.r rkozntpw522 X X X X X X X X X X X X X X X X X X X X X
YYY tmi_HZP2_TRno_3D.r rkozntpw515
Y Y Y Y Y Y Y Y Y Y Y Y Y Y Y Y Y Y Y Y ZZZ tmi_HZP2_TRno_3D.r rkozntpw510 Z Z Z Z Z Z Z Z Z Z Z Z Z Z Z Z Z Z Z VVV tmi_HZP2_TRno_3D.r rkozntpw505 V V V V V V V V V V V V V V V V V V
Figure 5.41 – Power excursion in thermal-hydraulic zones of TH channel 19 calculated with RELAP5/3D during collapsed REA in HZP
.40 .60 .80 1.00 1.20 1.40 1.60 1.80 2.00 2.20 Time (s) -1 0 1 2 3 4 5 6 7 8 x 10 7 P o w e r (P a ) WinGraf 4.1 - 11-23-2005 XXX tmi_HZP2_TRno_3D.r rkozntpw271 X X X X X X X X X X X X X X X X X X X X X
YYY tmi_HZP2_TRno_3D.r rkozntpw265
Y Y Y Y Y Y Y Y Y Y Y Y Y Y Y Y Y Y Y Y ZZZ tmi_HZP2_TRno_3D.r rkozntpw259 Z Z Z Z Z Z Z Z Z Z Z Z Z Z Z Z Z Z Z VVV tmi_HZP2_TRno_3D.r rkozntpw253 V V V V V V V V V V V V V V V V V V
Figure 5.42 – Power excursion in thermal-hydraulic zones of TH channel 9 (away from channel 19) calculated with RELAP5/3D during collapsed REA in HZP
.40 .60 .80 1.00 1.20 1.40 1.60 1.80 2.00 2.20 Time (s) -.5 0 .5 1 1.5 2 2.5 3 3.5 4 4.5 x 10 8 P o w e r (P a ) WinGraf 4.1 - 11-23-2005 XXX tmi_HZP2_TRno_3D.r rkozntpw368 X X X X X X X X X X X X X X X X X X X X X
YYY tmi_HZP2_TRno_3D.r rkozntpw359
Y Y Y Y Y Y Y Y Y Y Y Y Y Y Y Y Y Y Y Y ZZZ tmi_HZP2_TRno_3D.r rkozntpw355 Z Z Z Z Z Z Z Z Z Z Z Z Z Z Z Z Z Z Z VVV tmi_HZP2_TRno_3D.r rkozntpw345 V V V V V V V V V V V V V V V V V V
Figure 5.43 – Power excursion in thermal-hydraulic zones of TH channel 13 (adjacent to channel 19) calculated with RELAP5/3D during collapsed REA in HZP
.40 .60 .80 1.00 1.20 1.40 1.60 1.80 2.00 2.20 Time (s) -.2 0 .2 .4 .6 .8 1 1.2 x 10 8 P o w e r (P a ) WinGraf 4.1 - 11-23-2005 XXX tmi_HZP2_TRno_3D.r rkozntpw103 X X X X X X X X X X X X X X X X X X X X X
YYY tmi_HZP2_TRno_3D.r rkozntpw97
Y Y Y Y Y Y Y Y Y Y Y Y Y Y Y Y Y Y Y Y ZZZ tmi_HZP2_TRno_3D.r rkozntpw91 Z Z Z Z Z Z Z Z Z Z Z Z Z Z Z Z Z Z Z VVV tmi_HZP2_TRno_3D.r rkozntpw85 V V V V V V V V V V V V V V V V V V
Figure 5.44 – Power excursion in thermal-hydraulic zones of TH channel 2 (central channel) calculated with RELAP5/3D during collapsed REA in HZP
.40 .60 .80 1.00 1.20 1.40 1.60 1.80 2.00 2.20 Time (s) -1 0 1 2 3 4 5 6 x 10 8 P o w e r (P a ) WinGraf 4.1 - 11-23-2005 XXX tmi_HZP2_TRno_3D.r rkozntpw222 X X X X X X X X X X X X X X X X X X X X X
YYY tmi_HZP2_TRno_3D.r rkozntpw215
Y Y Y Y Y Y Y Y Y Y Y Y Y Y Y Y Y Y Y Y ZZZ tmi_HZP2_TRno_3D.r rkozntpw209 Z Z Z Z Z Z Z Z Z Z Z Z Z Z Z Z Z Z Z VVV tmi_HZP2_TRno_3D.r rkozntpw205 V V V V V V V V V V V V V V V V V V
Figure 5.45 – Power excursion in thermal-hydraulic zones of TH channel 7 (adjacent to channel 19) calculated with RELAP5/3D during collapsed REA in HZP
0 1.0 2.0 3.0 4.0 5.0 6.0 7.0 8.0 9.0 Time (s) 500 600 700 800 900 1000 1100 1200 1300 T e m p ( K ) WinGraf 4.1 - 11-23-2005 XXX tmi_HZP2_TRno_3D.r httemp122702301 X X X XX XXXX XXXX XXX X X X X
YYY tmi_HZP2_TRno_3D.r httemp122702001
YY YY YYY YYYY YYYYY YZZZ tmi_HZP2_TRno_3D.rY Y httemp122701501Y Z Z ZZZZ ZZZZZZ ZZZZ Z Z Z VVV tmi_HZP2_TRno_3D.r httemp122701001 V VVVVVVVVVV VVVV V V V V JJJ tmi_HZP2_TRno_3D.r httemp122700501 JJ J J J J J J J J J J J J J J J J J
Figure 5.46 – Fuel Centerline Temperature trend inside channel S on axial planes 5, 10,15, 20 & 23 calculated with RELAP5/3D during collapsed REA in HZP
0 1.0 2.0 3.0 4.0 5.0 6.0 7.0 8.0 9.0 Time (s) 540.0 550.0 560.0 570.0 580.0 590.0 600.0 T e m p ( K ) WinGraf 4.1 - 11-23-2005 XXX tmi_HZP2_TRno_3D.r httemp122702310 X X X XX X X X X XX XXXXX X X X X
YYY tmi_HZP2_TRno_3D.r httemp122702010
YY Y Y Y Y Y Y YY YYYYYY Y Y Y Y ZZZ tmi_HZP2_TRno_3D.r httemp122701510 ZZ ZZ ZZ ZZZZZZZZZZ Z Z Z VVV tmi_HZP2_TRno_3D.r httemp122701010 V VVVVVVVVVVVVVV V V V V JJJ tmi_HZP2_TRno_3D.r httemp122700510 JJ J J J J J J J J J J J J J J J J J
Figure 5.47 – Clad Temperature trend inside channel S on axial planes 5, 10,15, 20 & 23 calculated with RELAP5/3D during collapsed REA in HZP
0 1.0 2.0 3.0 4.0 5.0 6.0 7.0 8.0 9.0 Time (s) 552.00 552.50 553.00 553.50 554.00 554.50 555.00 555.50 556.00 T e m p ( K ) WinGraf 4.1 - 11-23-2005 XXX tmi_HZP2_TRno_3D.r tempf200010000 X XX X X X X XXXXXX X XX X X X X
Figure 5.48 – Hot leg temperature (Vol. n° 200) calculated with RELAP5/3D during collapsed REA in HZP 0 1.0 2.0 3.0 4.0 5.0 6.0 7.0 8.0 9.0 Time (s) 1.44 1.46 1.48 1.5 1.52 1.54 1.56 x 10 7 P re s s u re ( P a ) WinGraf 4.1 - 11-23-2005 XXX tmi_HZP2_TRno_3D.r p20100000 X XXXXXXXXXXXXXXX X X X X
0 1.0 2.0 3.0 4.0 5.0 6.0 7.0 8.0 9.0 Time (s) 1.46 1.48 1.5 1.52 1.54 1.56 1.58 x 10 7 P re s s u re ( P a ) WinGraf 4.1 - 11-23-2005 XXX tmi_HZP2_TRno_3D.r p180010000 X X X X XXX X X X X XXXXX X X X X
Figure 5.50 – Upper plenum pressure trend calculated with RELAP5/3D during collapsed REA in HZP 0 1.0 2.0 3.0 4.0 5.0 6.0 7.0 8.0 9.0 Time (s) 1.44 1.46 1.48 1.5 1.52 1.54 1.56 1.58 1.6 x 10 7 P re s s u re ( P a ) WinGraf 4.1 - 11-23-2005 XXX tmi_HZP2_TRno_3D.r p100010000 X X X XXXXX X X X XXXXX X X X X
Figure 5.51 – Lower plenum pressure trend calculated with RELAP5/3D during collapsed REA in HZP
5.3.3 HFP – CONTROL ROD 40% EJECTION
In this reference case, accident is initiated from a critical core at full power (HFP) and is characterized by the ejection of the CA n° 8, as indicated in the previous Fig. 5.10. CA n° 8 is initially 40 % withdrawn (2.016 m inserted from the top of the core). Control rod regulating banks (5, 6 and 7) and safety banks (1, 2, 3 and 4) are fully withdrawn.
The transient is completed in 8 seconds. Simulations activating reactor trip at 114% and without it were performed, as shown in Fig. 5.29 and 5.30. If reactor trip were not to act, power would have reached 115% of PN, still not presenting problems to reactor safety, as accurately
predicted by both coupled codes
Different contributions to the reactivity versus time obtained with PARCS code during this transient are plotted from Fig. 5.41 to 5.43. The total reactivity grows rapidly and at t = 1.10 s reaches the total inserted reactivity (0.11 $), and starts to fall because of the Doppler and moderator feedbacks.
Power excursion with reactor trip - Rod ejection HFP
0 0.2 0.4 0.6 0.8 1 1.2 1.4 0 1 2 3 4 5 6 7 8 Time (s) R e la ti v e P o w e r Relap-Parcs Relap 3D
Power excursion with no reactor trip - Rod ejection HFP 0 0.2 0.4 0.6 0.8 1 1.2 1.4 0 0.5 1 1.5 2 2.5 3 Time (s) R e la ti v e P o w e r Relap 3D Relap-Parcs
Figure 5.53 – Power excursion during REA in HFP without reactor trip
Power excursion with no reactor trip - Rod ejection HFP
0.8 0.85 0.9 0.95 1 1.05 1.1 1.15 1.2 1.25 1.3 0 0.5 1 1.5 2 2.5 3 Time (s) R e la ti v e P o w e r Relap 3D Relap-Parcs
Reactivity excursion with reactor trip- rod ejection in HFP -0.3 -0.2 -0.1 0 0.1 0.2 0.5 0.6 0.7 0.8 0.9 1 1.1 1.2 1.3 1.4 1.5 Time (s) R e a c ti v it y ( $ ) sumrho tfrho dmrho crrho
Figure 5.55 – Reactivity excursion during REA in HFP with reactor trip
Global reactivity excursion with reactor trip - HFP
-8.00E+00 -7.00E+00 -6.00E+00 -5.00E+00 -4.00E+00 -3.00E+00 -2.00E+00 -1.00E+00 0.00E+00 1.00E+00 2.00E+00 0 1 2 3 4 5 6 7 8 9 Time (s) R e a c ti v it y ( $ ) sumrho tfrho dmrho crrho
Reactivity excursion (no reactor trip) - rod ejection in HFP -0.08 -0.06 -0.04 -0.02 0 0.02 0.04 0.06 0.08 0.1 0.12 0.14 0 1 2 3 4 5 6 7 8 9 Time (s) R e a c ti v it y e x c u rs io n ( $ ) sumrho tfrho dmrho crrho
Figure 5.57 – Reactivity excursion during REA in HFP without reactor trip
The averaged radial assembly power distributions are illustrated in Table 5.6 and Fig. 5.46, at the time step of maximum power. The maximum power, after the rod ejection, is reached in the assembly (13,8), close to the one where the rod ejection occurred. This can also be seen in Fig. 5.47, where a view from the top of the 3D surface generated is presented.
On the other hand, axial power distribution, during rod ejection, remains practically uninfluenced, as showed in Fig. 5.45. It can be noticed a modest increase in the relative power in the core upper zones, where most of producing power is concentrated.
Energy released to the fuel during transient is presented in Fig. 5.61 and 5.62.
The overall reaction of the system to the transient was generally good and fuel centerline and clad temperatures are not of safety concern.
In the remaining figures in this section, HL temperature, PRZ pressure, UP and LP pressure variation are plotted. It can be noted that no relevant variation was inflicted to main plant operational parameters regarding safety aspects.
2 3 4 5 6 7 8 9 10 11 12 13 14 15 16 2 0.403 0.464 0.407 0.469 0.412 3 0.460 0.700 1.115 1.227 0.855 1.243 1.143 0.730 0.491 4 0.602 1.096 0.949 1.314 1.108 1.340 1.124 1.355 1.004 1.177 0.654 5 0.451 1.084 1.080 1.299 1.053 1.349 1.100 1.373 1.094 1.385 1.157 1.187 0.50 6 0.670 0.923 1.281 1.049 1.310 1.075 1.335 1.098 1.376 1.129 1.400 1.024 0.75 7 0.378 1.050 1.257 1.020 1.289 1.032 1.279 1.065 1.311 1.089 1.390 1.125 1.406 1.18 0.426 8 0.431 1.143 1.045 1.286 1.037 1.253 0.997 1.250 1.028 1.323 1.118 1.417 1.169 1.29 0.485 9 0.375 0.789 1.251 1.032 1.258 1.019 1.213 0.899 1.246 1.073 1.344 1.122 1.384 0.88 0.415 10 0.429 1.137 1.037 1.271 1.015 1.220 0.968 1.212 0.991 1.273 1.076 1.365 1.125 1.24 0.467 11 0.375 1.039 1.238 0.998 1.244 0.989 1.221 1.013 1.243 1.026 1.309 1.061 1.327 1.12 0.404 12 0.659 0.903 1.244 1.008 1.242 1.013 1.253 1.028 1.281 1.054 1.312 0.959 0.70 13 0.440 1.054 1.043 1.241 0.991 1.260 1.023 1.275 1.016 1.290 1.093 1.112 0.47 14 0.583 1.053 0.901 1.229 1.029 1.241 1.040 1.255 0.931 1.098 0.612 15 0.440 0.659 1.038 1.137 0.790 1.149 1.057 0.677 0.456 16 0.375 0.430 0.376 0.434 0.381
Table 5.6 – Averaged radial assembly power distribution at t = 1.10 s, corresponding to peak power 115% during REA in HFP
Axial power distribution during transient
0 0.2 0.4 0.6 0.8 1 1.2 1.4 1 2 3 4 5 6 7 8 9 10 11 12 13 14 15 16 17 18 19 20 21 22 23 24 25 26
Axial plane number
R e la ti v e p o w e r initial peak
Figure 5.58 – Axial power distribution at t=0 and t = 1.10 s corresponding to peak power during ejection at HFP
X 5 10 15 Y 5 10 15 P o w e r 0 0.5 1 Power 1.3 1.2 1.1 1 0.9 0.8 0.7 0.6 0.5 0.4 0.3 0.2 0.1
Frame 001 28 Nov 2005 Power Excursion for rod ejection at HFP
Figure 5.59 – Radial power distribution at t = 1.10 s during REA (HFP)
X Y 5 10 15 5 10 15 Power 1.3 1.2 1.1 1 0.9 0.8 0.7 0.6 0.5 0.4 0.3 0.2 0.1
Frame 001 28 Nov 2005 Power Excursion for rod ejection at HFP
Energy Released to Fuel during REA 0.0 20.0 40.0 60.0 80.0 100.0 120.0 0 1 2 3 4 5 6 7 8 9 Time (s) E n e rg y ( K J /k g ) Plane 1 Plane 5 Plane 10 Plane 15 Plane 18
Figure 5.61 – Energy released to fuel, on axial planes 1, 5, 10, 15 & 18 inside channel S, during REA at HFP
Energy Released to Fuel during REA
0.0 20.0 40.0 60.0 80.0 100.0 120.0 140.0 0 1 2 3 4 5 6 7 8 9 Time (s) E n e rg y ( K J /k g ) Plane 20 Plane 21 Plane 22 Plane 23 Plane 24
Figure 5.62 – Energy released to fuel, on axial planes 20, 21, 22, 23 & 24 inside channel S, during REA at HFP
0 1.0 2.0 3.0 4.0 5.0 6.0 7.0 8.0 9.0 Time (s) .2 .4 .6 .8 1 1.2 1.4 x 10 6 P o w e r (W ) WinGraf 4.1 - 11-28-2005 XXX tmi_HFP_TRno_3D.r rkozntpw522 X XX XXXXXXX XXXXX XXX X X X
YYY tmi_HFP_TRno_3D.r rkozntpw520
Y Y Y YYYYYY YY YY YYYYY Y Y ZZZ tmi_HFP_TRno_3D.r rkozntpw518 Z Z ZZZZZZZZZ ZZZZZZ Z Z VVV tmi_HFP_TRno_3D.r rkozntpw515 V VVVVVVVVVVVV VVV V V V JJJ tmi_HFP_TRno_3D.r rkozntpw510 JJJJJJJJJJJJJJJ J J J
Figure 5.63 – Power excursion in thermal-hydraulic zones of TH channel 19 calculated with RELAP5/3D during REA at HFP
0 1.0 2.0 3.0 4.0 5.0 6.0 7.0 8.0 9.0 Time (s) 0 .2 .4 .6 .8 1 1.2 1.4 x 10 7 P o w e r (W ) WinGraf 4.1 - 11-28-2005 XXX tmi_HFP_TRno_3D.r rkozntpw223 X XXXXXXXXXXXXXXXXX X X X
YYY tmi_HFP_TRno_3D.r rkozntpw220
Y Y Y YYYYYYY YYYYYYY Y Y Y ZZZ tmi_HFP_TRno_3D.r rkozntpw215 Z Z ZZZZZZZZZZZZZZZ Z Z VVV tmi_HFP_TRno_3D.r rkozntpw209 VVVVVVVVVVVVVVVV V V V JJJ tmi_HFP_TRno_3D.r rkozntpw205 JJJJJJJJJJJJJJJ J J J HHH tmi_HFP_TRno_3D.r rkozntpw201 HHHHHHHHHHHHHHH H H
Figure 5.64 – Power excursion in thermal-hydraulic zones of TH channel 7 calculated with RELAP5/3D during REA at HFP
0 1.0 2.0 3.0 4.0 5.0 6.0 7.0 8.0 9.0 Time (s) 700 800 900 1000 1100 1200 1300 1400 T e m p ( K ) WinGraf 4.1 - 11-28-2005 XXX tmi_HFP_TRno_3D.r httemp122702301 X XXXXXXX XXXXXX XXXX X X X
YYY tmi_HFP_TRno_3D.r httemp122702201
Y YYYYYYY YYYYY YYYYY Y Y ZZZ tmi_HFP_TRno_3D.r httemp122702001 ZZZZZZ ZZZZZZ ZZZZZ Z Z VVV tmi_HFP_TRno_3D.r httemp122701501 VVVVVV VVVVVV VVVV V V V JJJ tmi_HFP_TRno_3D.r httemp122701001 JJJJJJJJJJ JJJJJ J J J
Figure 5.65 – Fuel Centerline Temperature trend inside channel S on axial planes 10,15, 20 22 & 23 calculated with RELAP5/3D during REA at HFP
0 1.0 2.0 3.0 4.0 5.0 6.0 7.0 8.0 9.0 Time (s) 575.0 580.0 585.0 590.0 595.0 600.0 605.0 610.0 615.0 T e m p ( K ) WinGraf 4.1 - 11-28-2005 XXX tmi_HFP_TRno_3D.r httemp122702310 X XXXXXX XXXX XXXX XXX X X X
YYY tmi_HFP_TRno_3D.r httemp122702210
Y YYYY YYY YYYY YYYY YY Y Y ZZZ tmi_HFP_TRno_3D.r httemp122702010 ZZZZ ZZZZ ZZZZ ZZZZ Z Z Z VVV tmi_HFP_TRno_3D.r httemp122701510 VVVV VVVV VVVVV VVV V V V JJJ tmi_HFP_TRno_3D.r httemp122701010 JJJJJ JJJJJJJ JJJJ J J HHH tmi_HFP_TRno_3D.r httemp122700410 HHHHHHHHHHHHHHH H H
Figure 5.66 – Fuel Centerline Temperature trend inside channel S on axial planes 4, 10,15, 20 22 & 23 calculated with RELAP5/3D during REA at HFP
0 1.0 2.0 3.0 4.0 5.0 6.0 7.0 8.0 9.0 Time (s) 593.60 593.70 593.80 593.90 594.00 594.10 594.20 594.30 T e m p ( K ) WinGraf 4.1 - 11-28-2005 XXX tmi_HFP_TRno_3D.r tempf200010000 X XXXXXXX XX X X X X X X X X X X X
Figure 5.67 – Hot leg temperature (Vol. n° 200) calculated with RELAP5/3D during REA at HFP 0 1.0 2.0 3.0 4.0 5.0 6.0 7.0 8.0 9.0 Time (s) 1.44 1.46 1.48 1.5 1.52 1.54 1.56 x 10 7 P re s s u re (P a ) WinGraf 4.1 - 11-28-2005 XXX tmi_HFP_TRno_3D.r p20100000 X XXXXXXXXXXXXXXXXX X X X
0 1.0 2.0 3.0 4.0 5.0 6.0 7.0 8.0 9.0 Time (s) 1.45 1.46 1.47 1.48 1.49 1.5 1.51 1.52 1.53 1.54 1.55 x 10 7 P re s s u re (P a ) WinGraf 4.1 - 11-28-2005 XXX tmi_HFP_TRno_3D.r p180010000 X XXXXXXXXXXXXXXXXX X X X
Figure 5.69 – Upper plenum pressure trend calculated with RELAP5/3D during during REA at HFP 0 1.0 2.0 3.0 4.0 5.0 6.0 7.0 8.0 9.0 Time (s) 1.48 1.49 1.5 1.51 1.52 1.53 1.54 1.55 1.56 1.57 x 10 7 P re s s u re ( P a ) WinGraf 4.1 - 11-28-2005 XXX tmi_HFP_TRno_3D.r p100010000 X XXXXXXXXX XXXXXXXX X X X
Figure 5.70 – Lower plenum pressure trend calculated with RELAP5/3D during during REA at HFP