63
6. POWER LINE IN SHIPS: MODELLING AND EXPERIMENTS
The future electric ship presents a complex challenge, particularly for high technology. On the component level, the economics of ships places a premium on making each component as small, light, and energy efficient as possible. On the system level, advances in computing and power electronics are providing an expanding set of options to make the power system more reliable and versatile. The electric ship presents an opportunity and a challenge for shipbuilders. The constant increase of on-board electronic equipment, together with the intrinsic complexity of communication systems, leads to a constantly increasing volume and weight of dedicated cables. In addition, tourists and business travelers require services as infotainment and communications which also goes to the direction of increasing cable harness. Current ships use fiber, Ethernet, and wireless technologies for their Local Area Networks (LAN). The LANs are used for interior communication and automation system networks on the ship. The fiber and Ethernet networks are made up of hundreds of kilometers of cabling that add considerable weight and increase overall cost of the ship. Conversely, ship wireless LAN coverage is limited by the ship hull, which is made of thick metal sheets. An alternative communications technology currently being considered for implementation in ships is Broadband over Power Lines (BPL). BPL is a process of using power lines for high-speed data transmission. Electric power signals operate at low frequencies of 50 or 60Hz, and at 400Hz in certain systems of some ships. The low frequencies leave ample space in the higher frequency spectrum of the power lines for transmitting data streams. In BPL, Radio Frequency (RF) signals at high frequencies are superimposed onto power lines. Regular cruise ships may have thousands of cabins connected by hundreds of kilometers of data cabling. For this reason, the possibility of creating an integrated system which uses the power grid as a communication channel is obviously appealing, and would lead to a cost, weight and volume reduction, which is fundamental especially for maritime applications. Wireless communication share with PLC the weight reduction issue, but have problems in certain environments in which thick and/or metal walls (present on a ship) reduce its efficiency. Besides the typical issues of building PLC, extensively addressed in the literature , the main difficulties of this new use is the presence of noise due to the numerous electric and electronic equipment which are of course present in such a complex power distribution network. In addition, the power system of a ship (regardless its nature: cruise, cargo, military etc.) has his own peculiarities which make it different from the ground power system: it is a standalone system, which includes power generators, transmission lines, transformers and several different loads (i.e. pumps, mechanical loads, emergency systems, kitchens, lighting system, standard and luxury cabin electrical equipment etc). These characteristics present in a standalone power system, often with very few voltage levels and with a grounding system different from the most commonly used in residential or industrial environments make it a unique environment for the
64
PLC technology. Very little work has been done in this area so far and it has been mainly focused on the identification of the critical issues typical of such special environment. In particular are dedicated to measurements of the channel for a possible PLC implementation over different kinds of ships. In this thesis we perform a thorough measurement campaign on board a cruise ship. In particular, besides simulating the channel transfer functions and comparing the simulations results with the measurements, a set of statistically significant data transmission simulations have been performed in order to draw some meaningful conclusions about the possible use of the ship’s power grid as a data transmission system.
6.1 Marine Electrical Power Distribution
65
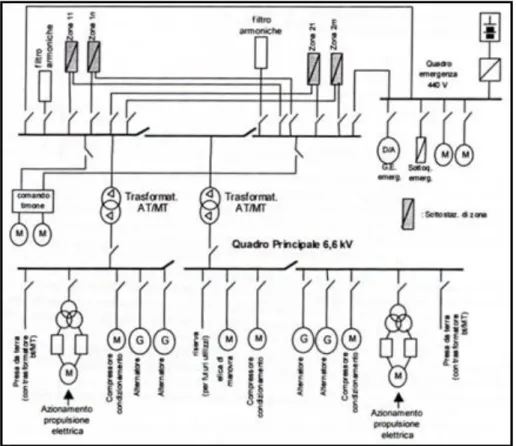
A ship can be considered as a mobile power plant. Most of the machinery is driven electrically, which thus makes for a huge electrical power demand. This makes a shipboard electrical power distribution system very important. Electricity has to be distributed with minimal losses after generation. A generic layout of a shipboard distribution system is represented in fig.1. The shipboard power system can be divided into generation, transmission, and distribution networks. Power system will consist of a number of generating sets feeding a bus bar of one or more sections. This may become complex as the size of the vessel and amount of machinery increase in number. It can be physically separated for greater survivability because they are equipped with their own tie circuit breakers and gets its supply from the main generators located in the engine room. The distribution system can be divided into Feeder side and the Load side. The feeders are the generators and the loads are various ship board auxiliary machineries. The Load side is further divided into Essential and Non-Essential services. Essential services are very critical auxiliaries which are directly affecting the safety of personnel, ship in terms of navigation and propulsion. They include supply to navigational aids like radars, communication equipment, navigational lights, and steering gear motors. These essential services may be supplied directly from the main switch board or via sectional boards or distribution boards. Non-essential services are those that do not affect the safety of ship and personnel for example, air conditioning compressors and fans. If the main power generation is blacked out, the emergency generator is started in order to restore the main power plant. If the number of generators on each main bus is greater than one, the emergency generator may become redundant. The main switchboard is the main power distribution center of the ship. Thus the main bus bars are contained within the switchboard feeding various ship board auxiliaries. A ship may contain two or more generators connected to the main bus bar via the circuit breaker. Various protection for the generators like overload, reverse power, etc. are connected to circuit breaker such that the faulty generator is electrically isolated from the main bus bar. The supply 440 volts, 60 Hertz, however higher voltages of 6.6kV are possible on LNG tankers, special purpose ships, and passenger vessels having electrical propulsion. The main bus bar has three heavy, thick bars of conductor (usually copper), running horizontally throughout the length of the main switch board. Each of the conductors is insulated between each other and wherever it is supported or clamped to the switchboard. The bus bar lies at the bottom most portion of the switchboard such that it can be easily supported and insulated. The emergency switch boards is located above the load water line or the upper most continuous deck, where as the main generators and main switchboards are located below the weather deck or the load water line. Thus this ensures that the emergency supply is maintained when the vessel is flooded with water to the weather deck. When the main generators fail, the main switch board loses its supply and this causes the emergency generator to start automatically, which will supply the emergency switchboard that is connected to various ship board auxiliaries. Thus critical equipment and machinery (essential services) are supplied always to maintain the safety of the ship and personnel. The system voltage selection should be performed by a system designer and will correspond to the power level, with consideration of cable size and protection. Nominal voltages for ac and low-voltage dc are well established in active IEEE standards. Nominal voltages for medium-voltage dc are being developed by the IEEE P1709 Working
66
Group. The electrical equipment supplied from the main or emergency systems are to be capable of being operated satisfactorily under normally occurring variations in voltage and frequency. Unless otherwise specified in national or international standards.
6.2 ON BOARD MEASUREMENT
In order to determine transmission characteristics and properties of the PLT channel, extensive measurements were carried out in cruise ship. An on-board measurement campaign has been conducted on a portion of the power grid of a cruise ship which is undergoing a major revamping (available for the courtesy of the owner).
Important measurement parameters are:
1. Attenuation 2. Noise 3. Impedance 4. Loss
It is envisioned that the role of experimental measurement in the design of future shipboard power systems will be significantly increased [23]-[26]. However, a number of challenges are presented by the task of experimenting such systems in a transient environment and fully utilizing these experiments for design purposes. The system itself is not prohibitively large, but the large number of fast switching power electronic components adds considerable computational burden [17].
Channel estimation is carried out by
measurement of the channel frequency response and byperiodically transmitting an OFDM training symbol. The
frequency at which training symbols are sent can be programmatically changed in
the software and depends on the expected variation of the channel. We are
currently avoiding carrier synchronization issues by directly wiring the clocks of
the transmitter and receiver together. Software synchronization is under
development and is not included in this thesis.
67
6.3 PROTOTYPING PLATFORM
6.3.1 Set-up Description
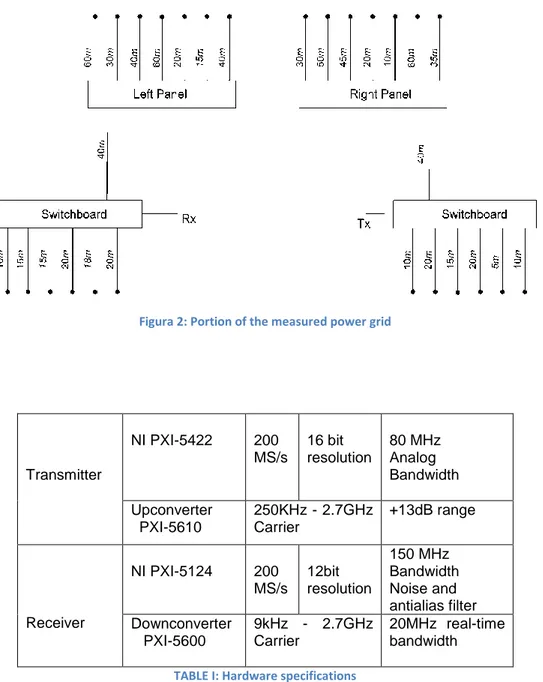
In this section we reported the performed experimental measurement of the channel response of the power-line communication channel of a typical cruise ship. The portion of the analyzed power grid is shown in Fig. 2; the transmitter and receiver have been set directly on two different switchboards on the same deck, which are connected to the main panel (divided into two subpanels, Left and Right,
always connected together) located on a different deck. Is possible to see from Fig. 2 also the cables departing from the main panel and
the switchboards. In particular the cables departing from the panel go to other switchboards, whereas
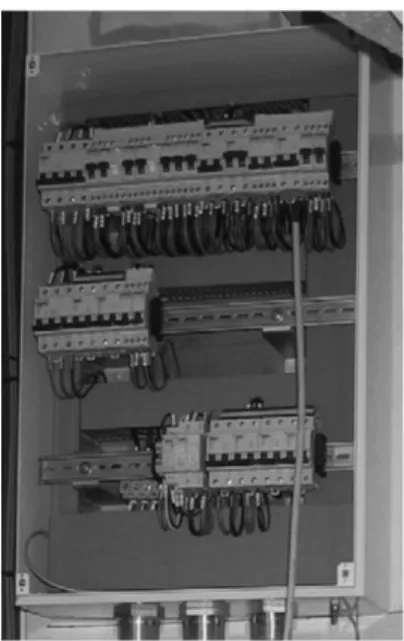
the cables departing from the switchboards go to different loads. In addition, the cable length is shown in Fig. 2. All the cables are three phase + neutral, and we have randomly chosen one among the available couples phase neutral as PLC channel. The whole set of cables have been disconnected at their far end (open circuit): in this way the worst channel characteristics in terms of attenuation and frequency selectivity, due to maximum reflections at the open ends, is analyzed. As for the near end connection of the cables (the switches located on the switchboards), different configurations have been considered as described in section II-B. The nominal voltage of the system is 400V, and all the cables are commercial cables of type LKM-HF; in particular the cables present in this portion of the circuit are: 4x6mm2, 4x2.5mm2, 4x1.5mm2, 4x10mm2. The measurements setup at the receiver point represented in Fig. 3a while Fig. 3b shows a picture of one of the two switchboards, which are standard commercial items. The same holds for the panels. The results obtained (and shown in the following sections) give an indication of the behavior of the whole power grid of the ship as PLC channel.
68
Figura 2: Portion of the measured power gridTransmitter NI PXI-5422 200 MS/s 16 bit resolution 80 MHz Analog Bandwidth Upconverter PXI-5610 250KHz - 2.7GHz Carrier +13dB range Receiver NI PXI-5124 200 MS/s 12bit resolution 150 MHz Bandwidth Noise and antialias filter Downconverter PXI-5600 9kHz - 2.7GHz Carrier 20MHz real-time bandwidth
TABLE I: Hardware specifications
69
Figura 3: Measurement setup at the receiver Figura 4: Switchboard
6.3.2 Hardware Description
70
The
foundation of our prototype
is the
National Instruments’ RF hardware.
Measurements have been performed by the use of portable PCs connected to National Instruments acquisition data cards (digitizer).
The hardware comes in the
PCI extensions for instrumentation (PXI) form factor (which is similar to PCI except
designed for industrial applications). Each pair of transmitters and receivers is
housed in separate PXI chassis. Each PXI chassis is connected to a PC through a PCI
bridge which connects the PXI hardware to the PCI bus.
Each transmit unit is called a RF signal generator and it consists of two parts
whose characteristics are reported in table I.
The first is the arbitrary waveform
generator (ARB). The ARB ,
NI PXI-5422,acts as the digital to analog converter
(DAC) and it operates at a maximum of 200M samples/sec with a 16-bit
resolution. The ARB has a 256MB buffer, although the hardware is enabled to
cycle through the buffer to provide for continuous transmission. When
transmitting complex data, the ARB itself upconverts the signal to an intermediate
frequency (IF) of 25MHz (this IF can be programmatically changed) before the
signal is sent to the RF upconverter. The upconverter can modulate a signal up to
a carrier frequency of 2.7GHz with bandwidths up to 20MHz and is capable of a
maximum of 13dBm of power. The ARB has a trigger line available for timing
synchronization, while the upconverter has an input available for clock
synchronization. The receiver also consists of two units: a digitizer,
NI PXI-5124,and a RF downconverter. The downconverter takes the RF signal from the
antenna and downconverts it to an IF frequency of 15MHz before sending it to the
digitizer (A/D). Like the upconverter, the downconverter can process signals up to
2.7GHz. The downconverter can process 20MHz bandwidth blocks of data at a
time. The digitizer runs at a maximum sampling rate of 64Msamples/sec and it has
a 14-bit resolution. It is equipped with a 64MB buffer. The digitizer samples the IF
waveform and sends it to the PC where IF demodulation happens in software. This
software demodulation along with the limited speed of the PCI bus prevents
continuous operation at maximum bandwidth. Using a duty cycle (transmitting a
only a fraction of every cycle) allows us to transmit using large bandwidths while
decreasing the bandwidth below 1.25MHz (where onboard digital demodulation is
supported) allows us to support continuous streaming.
71
6.3.3 Software Description
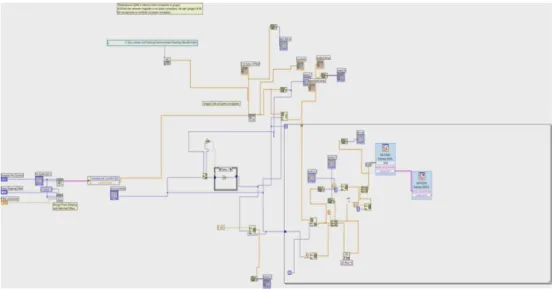
The RF Hardware of our prototype is designed to be easily configured and
programmed through National Instruments’ LabVIEW programming environment.
LabVIEW is a data flow based graphical programming language. The hardware can
be programmed in other languages, however, LabVIEW provides the user with
simple programming and rapid prototyping capabilities. We began the
prototyping process by creating a simulation of the OFDM system in LabVIEW
including the building blocks to simulate various OFDM schemes as well as the
functions which are necessary to simulate the system completely from baseband
up to the modulation and decoders. After completing simulations, the next stage
in our prototyping process was to actually program the hardware. With the
LabVIEW simulations already completed, the transition to hardware programming
was very simple as the code written for the system simulation could then be
72
applied with the hardware. Many of the low level hardware issues were avoided
by using the LabVIEW hardware device drivers.
6.4 Test performed
In order to analyze the potential communication capability of the shipboard for use as a communication channel it is necessary to understand the communication characteristics of the channel with different configurations of the switchboard and panel switches. Other factors such as ship reconfiguration, inherent noise in the ship power system and electromagnetic interference issues also need to be considered later. The tests performed show that above 12.5 MHz the attenuation becomes too high, for this reason all the results are reported here for frequency bands whose upper limit is 12.5 MHz.
Two different tasks have been performed:
Measurement of the channel frequency response with different configurations of the switchboard and panel switches;
Transmission test of different OFDM frames for a selected channel configuration.
6.4.1 Frequency Response of the Different Channel
Configuration Measurements
In this section, simulation case studies, assuming different scenarios, performed to investigate the channel response characteristics of the shipboard distribution lines was presented. The case studies presented were designed to investigate the effect of distribution line length, distribution line discontinuities, signal transmit power level and number of Sub-channels. Along with the system implementation, we are using the prototype to conduct channel measurements.
Due to the fact that a total number of 26 branches are connected to the two switchboards and that the two panels, measuring the channel performance for each configuration, would be cumbersome and redundant, only a subset of the
73
total number of configurations has been measured; based on the experience, this subset can simply be chosen, setting all the switches of a single panel (or switchboard) to the Open or Closed position. In addition, we have verified that the position of the switches at the transmitting switchboard in this particular configuration is practically not influent on the channels’ behavior. A practical explanation of this fact can be obtained by considering the Thevenin’s equivalent of the transmitting device, which is a voltage generator series connected to an impedance. When this impedance is zero (theoretical limit), the switchboard voltage is set by the generator. In our case, the Thevenin’s impedance is not zero but can be neglected, because the voltage drop is negligible. Furthermore, the reflections coming from the open cables at the transmission switchboard are far from the receiver and are strongly attenuated. Of course, this is not a general conclusion but holds in this case and lets us reduce the number of measurements
to be performed.
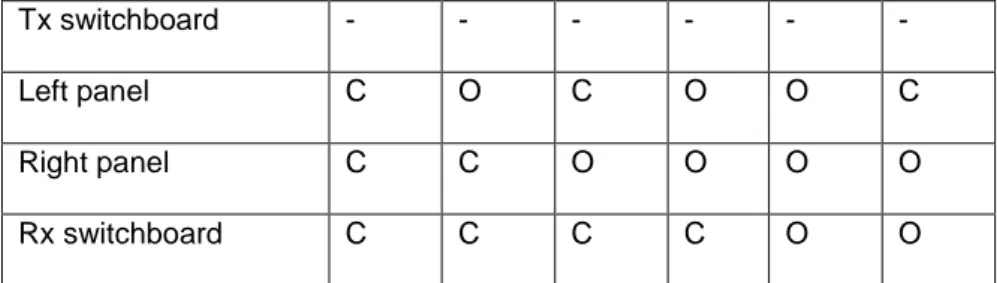
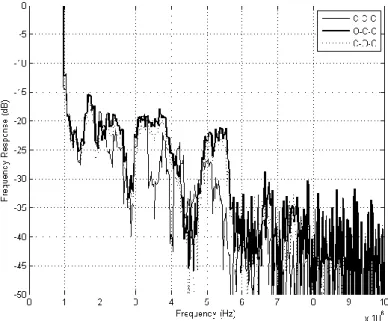
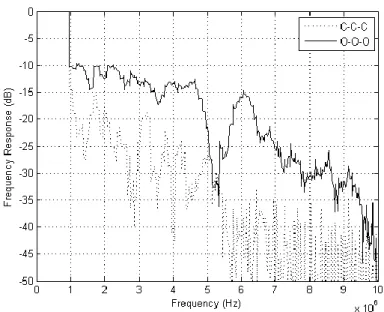
Table I shows the configurations that are reported in this chapter, in which the letter “O” means that all the switches of a panel (or switchboard) are kept in “Open” position, whereas letter “C” means that all the switches of a panel (or switchboard) are all kept in the “Closed” position. The frequency responses of the channel in the six different configurations reported in Table I is represented in Figs. 3 and 4 . As a first result of this analysis, we can verify that the channel’s performance degrades when one or more sets of switches are closed, due to the reflections at the open ends of the cables. For this reason, the best channel configuration is O–O–O, whereas the worst one is C–C–C. For the sake of clarity, these two configurations alone are shown in Fig. 5, in which the maximum attenuation difference between the two is approximately equal to 20 dB. The other configurations lie in between the best and worst; however, in all cases, the attenuation becomes drastic above 12 MHz. As a final step, the background noise power at the receiver was measured with the average power spectral density (PSD) of −95 dBm/Hz, as shown in Fig. 6.
Tx switchboard - - - -
Left panel C O C O O C
Right panel C C O O O O
Rx switchboard C C C C O O
74
Figura 6: Frequency response amplitude of three configurations75
Figura 8: Best and worst configurations of the channel
76
6.4.2 Transmission of OFDM frames.
One of the objectives of hardware implementation was to test various candidate coding and receiver strategies for the OFDM physical layer, which is currently under development.
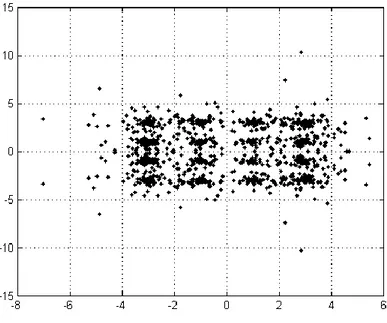
Due to our current hardware limitations, each acquisition requires approximately 4 seconds of processing before a new acquisition can occur. Thus the overall throughput we achieve is about 2 Mbits when operated using this duty cycle. Future hardware upgrades will allow real time system implementations. The last step of the measurement campaign, we have performed some transmission tests on the channel labeled C–O–O (whose frequency response is reported in Fig. 4). In particular, a set of OFDM frames relative to a 16-state quadratic aperture modulation (16-QAM) modulation scheme (1010 symbols) has been transmitted at different levels of injected PSD (IPSD) in a frequency band of [1–12.5] MHz. The symbol error rate of the transmission as a function of the IPSD is shown in Table II whereas Fig. 7 shows the constellation after equalization (performed offline), with the frequency response previously measured relative to the case of IPSD = −45
dBm/Hz. As a final comment after the measurement campaign, it is possible to say that the channel is characterized by a high attenuation above 8 MHz. Beyond this level, the transmission quality becomes less satisfactory. This is confirmed by the transmission tests, in which (as shown in Table III) the symbol error rates over the frequency band [1–12.5 MHz] are relatively high for the considered injected power levels. Power (dbm/Hz) -44 -42 -36 Symbol error rate 0.51 0.42 0.31 TABLE III
77
Figura 10: QAM constellation of the equalized signal
6.5 Consideration
In this chapter we have investigated the possibility of using the power network of a ship as a PLC channel. The measurement campaign results have shown the behavior of different channels as a function of the power grid topology, together with the performance during some transmission tests. A model of the power network, is then obtained.
The platform frees the user from low-level hardware implementation issues and allows more intensive study of algorithm and system design issues. We illustrated applications of this approach to system implementation and channel measurements. It is important to underline that in this thesis we do not take into account the presence of the power system voltages and currents, and no additional attenuation due to the couplers (which are not present in our experiments) is introduced. These are the preliminary results in a vast study in which we evaluate the performance of the power network as a possible PLC channel.