F
ACOLTÀ DI
S
CIENZE
M
ATEMATICHE
,
F
ISICHE E
N
ATURALI
Dipartimento di Chimica e Chimica Industriale
Graduate School “Galileo Galilei” Ph.D. in CHEMICAL SCIENCES
S
TRUCTURE AND
P
ROPERTIES OF
S
IMPLE AND
A
GGREGATE
S
YSTEMS BY
C
IRCULAR
D
ICHROISM
S
PECTROSCOPY
SSDCHIM/06 Daniele Padula XXV Cycle, 2010-2012
F
ACOLTÀ DI
S
CIENZE
M
ATEMATICHE
,
F
ISICHE E
N
ATURALI
Dipartimento di Chimica e Chimica Industriale
Graduate School “Galileo Galilei” Ph.D. in CHEMICAL SCIENCES
S
TRUCTURE AND
P
ROPERTIES OF
S
IMPLE AND
A
GGREGATE
S
YSTEMS BY
C
IRCULAR
D
ICHROISM
S
PECTROSCOPY
Candidate:
Daniele Padula
Supervisor:
Prof. Lorenzo Di Bari
External Supervisor:
Acknowledgements ... I Abstract ... II
1 Introduction ... 1
2 Conformational Problem in ECD Simulation ... 4
2.1 Introduction ... 4
2.2 Methods for ECD Spectra Interpretation ... 5
2.2.1 Empirical Methods... 5
2.2.2 Semi-empirical Methods ... 6
2.2.3 Exciton Coupled Circular Dichroism (ECCD) ... 8
2.2.4 Quantum-chemical Methods ... 10
2.3 How to Overcome the Conformational Problem ... 12
2.3.1 Chemical Derivatization Approach ... 13
2.3.2 Solid-state Approach ... 13
3 Vibronic Simulation of Spectra ... 18
3.1 Introduction ... 18
3.2 Born-Oppenheimer (BO) Approximation ... 19
3.3 Quantities Needed for the Calculations ... 20
3.4 Transition Moment Approximations: Franck-Condon (FC) and Herzberg-Teller (HT) Formulations... 21
3.5 Potential Energy Surfaces Approximations ... 23
3.5.1 Adiabatic and Vertical Approaches ... 24
3.6 Prescreening of Vibronic Transitions. ... 29
3.7 Quality Improvement by Inclusion of Vibronic Effects ... 30
4 PUBLISHED RESULTS ... 32
5 UNPUBLISHED RESULTS ... 93
I
ACKNOWLEDGEMENTS
The work described in this Thesis is the result of collaborations with many researchers active in the field of chiroptical spectroscopy. I am very grateful to researchers that provided interesting samples on which we performed spectroscopic and theoretical studies leading to fruitful collaborations, they are so many that mentioning them all would take too much time and space.
Special thanks for helpful discussions, advice and support are dedicated to the following people:
Prof. Lorenzo Di Bari, first of all for accepting me as a PhD student, giving me the opportunity to pursue my research passion in this field, for his constant support, help and suggestions in this long period of study;
dr. Rino Pescitelli, who taught me a lot about dealing with experimental measures both in solution and solid-state, who helped me in a better knowledge of the computational tools helpful for our research, whose help, advice and ideas have been fundamental in the development of the research work that has been carried out in these years;
dr. Fabrizio Santoro, which I cannot thank enough for his patience and help in the development of the work during my long stay at CNR, for great advices about conferences to attend and projects to present there, for involving me in many interesting projects, for teaching me the theoretical concepts on which vibronic simulations are based and, more importantly, for his friendship.
I am very grateful to these people for sharing their deep knowledge of science with me.
I would like to thank my colleagues who shared at least a part of this long journey with me:
dr. Samuele Lo Piano, Sebastiano Di Pietro, Claudio Resta at DCCI for many interesting discussions about the chemistry involved in our projects and about many other topics; many other people for the hilarious lunch and coffee breaks that we shared. Michele Visciarelli, Alberto Coduti and David Picconi at CNR, respectively for interesting discussions, especially about music, for great logistic help with computers, and for help in the development of a part of the work.
Finally, a great thank goes to my entire family, which supported me during these three years, which was always interested in news and developments about my professional life and which was always ready to make me feel loved.
II
ABSTRACT
This thesis deals with the investigation of structural properties of many different systems via Electronic Circular Dichroism (ECD). The interpretation of experimental data has been carried out mainly with quantum-chemistry methods, such as Density Functional Theory (DFT), on both solution and solid-state systems.
The analysis of solution systems is oriented towards applications on biologically active compounds, both natural or synthetic, and its objective is to underline the key role of these approaches in the determination of the absolute configuration and the difficulties that may be encountered in case of flexible molecules. Solid-state measurements represent an attractive alternative to these cases where a lot of conformations are present, but difficulties in the interpretation of the signals due to solid-state interactions which are not observable in solution may be faced.
For a better understanding of spectral lineshapes, more detailed analyses have been performed taking into account vibronic effects, which may also assist in the determination of the conformational situation of the investigated substrate. The limitations of the vibronic treatment for coupled electronic states have been considered, leading to a general all-coordinate approach which allows simulating the electronic spectrum of “dimeric” molecules with weakly coupled electronic states through a time-dependent approach.
Daniele Padula Page 1
1 Introduction
Electronic Circular Dichroism (ECD) is a powerful tool in the analysis of the structure of chiral molecules and aggregates.
The classical applications like absolute configuration assignment have become more and more simple, rapid and reliable thanks to the development of sophisticated interpretation techniques like ab initio calculations of chiroptical properties.1,2 The application of this spectroscopy extended thanks to the use of chiral molecules in many fields of chemistry, like nanoparticles stabilization3 or optical devices.4
In the case of absolute configuration assignment via ab initio calculations, many applications to natural products are present in the literature.5 Conformational distribution constitutes a crucial problem in this field: electronic circular dichroism, like all spectroscopic properties, is a sum of the contributions from all populated conformations. If more than one populated conformer exists, calculation must be performed on each conformer and a weighted average above populations has to be considered. If we want to calculate circular dichroism spectra, we must perform a conformational analysis step, which can be very computationally demanding and prone to inaccuracy, especially in the relative energy prediction or in the possibility of missing some conformers. Then, computational analysis results should be checked against experimental data, notably from NMR, and when a reliable set of input structure is available, the ECD calculation must be run on each structure. It is evident that flexible molecules represent a very difficult case to handle. A further critical point may be represented by solvent-solute interactions, because a solvation model6,7 has to be included in calculations, increasing the computational effort.
ECD is also a widespread technique in the field of biomolecules, were its main task is probably to help in the determination of the conformational structure of peptides. However, it’s largely employed also in the field of nucleic acids, where the origin of the signals is due to exciton coupling mechanisms among the aromatic rings of the nucleotides.8 In cases like biomolecules, the size of the molecule of investigation does not allow the employment of the most powerful techniques that have become so popular in the last years, DFT calculations of the spectra. In these cases other hybrid techniques are viable, such as matrix methods, which were optimized in order to allow the prediction of spectra in which coupling among chromophores is responsible for the signals.
This method is marked as hybrid because the calculation consists of two parts: the analysis of the transition dipoles on each single chromophore, which can be faced through ab initio methods, and the interaction between the previously defined dipoles,
Daniele Padula Page 2 which is faced with classical physics. The accuracy of this method mainly depends on two factors: the ability to describe the interacting dipoles with a set of parameters (transition energy, dipolar strength, orientation of the dipole and so on) and the lack of other mechanisms that give rise to ECD signals in the system.
In the last years another aspect is acquiring increasing importance in the interpretation of ECD signals, and this is the vibronic structure. The interpretation of vibronic contributions to the spectrum results in a more detailed analysis which can achieve useful information about the portions of the molecule responsible for the observed vibronic signals9 and the mechanisms which originate such phenomena (for example Herzberg-Teller effects),10 or can help in a better understanding of the conformational distribution of a particular system.11 Apart from the interpretative applications of this technique, it is really interesting to analyze the theory which allows dealing with vibronic contributions to the spectra,12 which will be developed in a dedicated section.
This Thesis is organized as follows:
a. a general tutorial part which treats the problems and the theory needed for the comprehension of the research carried out in this field, and particularly in this Thesis. This first part of the Thesis is divided in 2 Chapters:
1) Chapter 2 analyzes in detail the problem of conformational flexibility in the investigated substrate and relates it with the approaches that have been used through years for the interpretation of spectroscopic data, with particular emphasis on the most recent ones, which are also the principal approaches adopted in this Thesis (DFT). The conclusive section is dedicated to the recent advances that allow reducing the conformational flexibility issue.
2) Chapter 3 gives a deep overview on the theory that allows including the vibronic effects in the simulation of an electronic spectrum, which is one of the most recent advances in this field.
b. a section dedicated to achieved results during the development of this Thesis. This section is divided in 2 parts:
1) the Published Results section consists of the research papers published on peer reviewed journals, reporting the results obtained and already published;†
2) the Unpublished Results section contains the drafts of papers that have been accepted, submitted or are in preparation for publication in peer reviewed journals.
†All the papers are reprinted with permission from their respective publisher. Copyright 2011-2013
Daniele Padula Page 3
References
(1) Crawford, T. D. Theor. Chem. Acc. 2005, 115, 227–245.
(2) Bringmann, G.; Bruhn, T.; Maksimenka, K.; Hemberger, Y. Eur. J. Org. Chem.
2009, 2717–2727.
(3) Tamura, M.; Fujihara, H. J. Am. Chem. Soc. 2003, 125, 15742–3.
(4) Wang, Z. Y.; Todd, E. K.; Meng, X. S.; Gao, J. P. J. Am. Chem. Soc. 2005, 127, 11552–3.
(5) Bringmann, G.; Gulder, T. A. M.; Reichert, M.; Gulder, T. Chirality 2008, 20, 628–642.
(6) Tomasi, J.; Mennucci, B.; Cammi, R. Chem. Rev. 2005, 105, 2999–3093. (7) Mennucci, B.; Cammi, R. Continuum Solvation Models in Chemical Physics:
From Theory to Applications; Wiley, Chichester, 2007.
(8) Gray, D. M.; Wen, J.; Gray, C. W.; Repges, R.; Repges, C.; Raabe, G.; Fleischhauer, J. Chirality 2008, 20, 431–440.
(9) Rivera-Fuentes, P.; Alonso-Gómez, J. L.; Petrovic, A. G.; Santoro, F.; Harada, N.; Berova, N.; Diederich, F. Angew. Chem. Int. Ed. 2010, 49, 2247–2250. (10) Padula, D.; Di Bari, L.; Santoro, F.; Gerlach, H.; Rizzo, A. Chirality 2012. (11) Lahoz, I. R.; Padula, D.; Navarro-Vazquez, A.; Llamas-Saiz, A.; Santoro, F.;
Alonso-Gomez, J. L.; Cid, M. M. submitted 2012.
(12) Biczysko, M.; Bloino, J.; Santoro, F.; Barone, V. In Computational Strategies for
Spectroscopy: from Small Molecules to Nanosystems; Barone, V., Ed.; Wiley,
Daniele Padula Page 4
2 Conformational Problem in ECD Simulation
In this section we are going to analyze the importance of the conformational problem in the simulation of spectroscopic data. After a general introduction on the ideas and problems that are commonly faced in this field, the most employed methods of interpretation will be presented, underlining the fact that the presence of flexibility in the system under analysis can present a huge problem. Ideas that allow overcoming this issue are presented in the last part.
2.1 Introduction
Chiroptical spectroscopic techniques, based on the differential interaction (transmission or emission) between the sample and left- and right-circularly polarized light, represent a wide class of versatile tools purposely designed for analyzing chiral nonracemic samples. They include several different techniques such as electronic circular dichroism (ECD or simply CD, on which we will focus in the following), vibrational CD (VCD), Raman optical activity (ROA), and fluorescence-detected CD (FDCD).1 Two enantiomers of any chiral substance are characterized by chiroptical spectra perfectly matching in shape, position, and intensity of bands but being the mirror image of each other. A CD spectrum contains all the necessary information about the absolute configuration (and, more in general, the absolute structure) of the investigated compound, and if proper means of interpretation are available, i.e., the spectrum-structure relationship is established,2 the AC can be assigned.
It is important to stress that any CD spectrum is sensitive to, and contains information about, the overall molecular geometry, in terms of both conformation and absolute configuration. However, configurational and conformational factors are strictly intertwined, and it is usually very difficult to deduce both pieces of information from a single CD spectrum.2,3
Therefore, when applied to deduce absolute configurations, CD calculations rely on an independently established conformational picture, which is in turn gained through the use of other spectroscopic and/or theoretical means. Any solution CD spectrum amounts to the sum of contributions from all populated conformations; therefore, the set of input structures to be considered in the calculation must be representative of the whole conformational ensemble.
Daniele Padula Page 5 The conformational analysis step may be very computationally demanding and prone to inaccuracy, the major sources of error lying in the prediction of relative energies, and the possible missing of one or more significant conformers. Computational results should always be checked against NMR data, which increases the length of the whole procedure. Finally, after a reliable set of input structures is available, the CD calculation must be run on each structure at the same level of theory.4–6 Therefore, flexible molecules may represent very difficult cases to handle with the above calculation scheme. A further critical point concerns the presence of solvent. A correct treatment of solute-solvent interactions, in both geometry optimization and CD calculation steps, requires inclusion of a solvent model7,8 which additionally increases the computational time.
The total chiroptical property is finally obtained by performing a weighted average of the property of each conformer over its Boltzmann population, which is obtained from the conformational analysis step.
2.2 Methods for ECD Spectra Interpretation
Several methods have been developed for the interpretation of the ECD spectra, or in general chiroptical data, of chiral compounds. These methods have become more and more raffinate, especially thanks to the development of computer technology, which nowadays allows performing calculations on really large systems.
In the past more simple, rapid and unreliable methods were used, which will be mentioned for historical importance, such as sector rules or other empirical methods which assume a structural similarity between the compounds in analysis.
2.2.1 Empirical Methods
9Empirical methods are based on the assumption that the conformation of the system under analysis is known. Typically these methods are employed to determine the absolute configuration of a system that has a very similar structure with respect to a compound of known configuration. Under these conditions, one compares the chiroptical data of the known compound with the ones of the system under study, and deduces the absolute configuration of the latter from this comparison. Such a procedure is very general, and can be performed with different chiroptical data such as ECD and ORD spectra or even with an optical rotatory power measurement.
Daniele Padula Page 6 The weak point of these methods is that the conformational picture of an unknown compound is assumed from the analysis of other molecules sharing the same functional groups or chromophores. Moreover, these methods does not usually show any theoretical foundation, thus one can occur in an exception from the rule in each moment, falling in error.
2.2.2 Semi-empirical Methods
9,10These methods allow assigning the absolute configuration of a compound by analysis of a particular signal corresponding to a well known electronic transition. The signal of this particular transition is expected to be of a particular sign thanks to rules which are specific depending on the chromophore under analysis. Such rules were developed via an empiric procedure, but in some cases have shown a theoretical foundation. We can divide these rules into helicity rules and sector rules.
Helicity rules can be applied to intrinsically asymmetric chromophores, which are intrinsically chiral. For example, in the cases of cis-dienes, there is a helicity rule which correlates the sign of the π→π* transition at 280 nm with the helicity of the diene system.
Sector rules are applied to symmetric chromophores which are perturbed by an asymmetric environment. The space around a chromophore is divided into sectors by nodal planes. Groups falling into such sectors give a positive or negative contribution to a particular transition, depending in which sector they are located. The most famous rule of this type is the octant rule,11 which allows predicting the sign of the n→π* transition of a saturated ketone.
This rule is based on the simple fact that a carbonyl has two local symmetry planes (it belongs to the point-group C2v) and any atom or group occupying the space outside
these planes breaks the symmetry and possibly leads to a chiral structure. This is well represented by an equatorial group in position β to the carbonyl in cyclohexanone derivatives. If we arbitrarily choose clockwise sense in atom numbering, 3 and 5 positions are enantiotopic and a substituent in one or the other leads to a molecule of opposite chirality. By watching (R)-3-methylcyclohexanone along the O–C direction, with the carbonyl plane horizontal, as represented in Figure 2.1, we may say that the symmetry breaking methyl group Me is in the upper left sector, or octant.
Daniele Padula Page 7 Figure 2.1: Conformational inversion equilibrium (ring commutation) of (R)-3-methyl cyclohexanone and projections defining rear octants considered in the ketone octant rule.
Every other atom in the molecule either lays on the C2v planes, or, if it is in the space
between them, it is exactly “compensated” by a symmetry-related equal one. Only Me faces a hydrogen atom, which introduces an unbalance.
It is observed that, for the methyl group occupying the upper left octant, or the equivalent lower right one, (300 nm) > 0. This also leads to the conclusion that had the methyl group occupied the enantiotopic lower left or the upper right sectors one would obtain a negative Cotton effect. This molecule lends itself to introducing one of the first cases when ECD was used for conformational analysis.11 (R)-3-Methylcyclohexanone has two main conformers: by ring commutation between the two pseudo-chair conformations, Me can occupy an equatorial or an axial position (Figure 2.1).
In the latter case, by inspecting molecular models, one finds that it occupies the upper right octant. As we have seen before, we can ignore the rest of the backbone, which is symmetric, and we can fix our attention on the Me group only: its exact locations in the two isomers with respect to C=O are not really symmetry-related, but one can assume that they are almost enantiotopic. We can expect that for the axial isomer (300 nm) < 0. We are in the case where two different conformers lead to opposite ECD spectra (relative to the sole n→* transition). We made this prediction on the basis of a symmetry argument and by assuming that the interactions by which we observe a Cotton effect of the n→* transition occur through space and e.g. not through bonds. One can estimate the enthalpy difference between the two conformers with Me in axial or equatorial position to about 1.74 kcal/mol.9
At room temperature (300 K), this corresponds to an equilibrium constant
0.053 and ultimately to a composition of about xax = 5% and xeq = 95%. The
observed ECD around 300 nm can be written as a sum of contributions due to the methyl in equatorial (eq) and in axial (ax) positions, the former being positive and
Daniele Padula Page 8
and because of the opposite sign of ax and eq, |obs| < |eq | that is, in absolute
value the observed Cotton effect is smaller than it should be for the pure equatorial conformer. On lowering the temperature, we expect that the mole fraction of the less enthalpically stable isomer decreases in favor of the more stable one; ultimately xax →
0; xeq → 1.
This means that the magnitude of the Cotton effect is strongly dependent on temperature and that |obs (T)| increases on lowering the temperature, which is exactly
what was found experimentally. Thus, for 3-methylcyclohexanone the sign of the ECD band is a reporter of the absolute configuration, while variable temperature trends provide conformational information. Use of vibrational spectroscopy would be preferred in such circumstances where different conformers give rise to distinct VCD or ROA bands identifiable in the average spectrum so that relative populations may be more easily quantified.12,13
2.2.3 Exciton Coupled Circular Dichroism (ECCD)
This method is applied in multichromophoric systems where the chromophores are close in terms of distance. The chromophores must absorb the UV light nearly at the same wavelength, so this method is particularly useful when the chromophores are exactly the same.
This method combines the immediacy of sector-like rules with the reliability of a nonempirical treatment. Consideration of a conformationally fixed and structurally well-characterized situation is not without value for ECCD, given that unexpectedly assumed conformations may be the reason for an apparent sign reversal or diminished intensity of exciton couplets.14
When two individual chromophores with intense →* absorptions and identical or similar excitation energies are also in close spatial proximity to one another, they cannot be excited independently. Each chromophoric excited state will delocalize over all chromophores within the system and becomes an exciton. The excitons interact and couple with each other, thus giving rise to a characteristic pair of intense ECD bands with opposite signs and comparable band areas at shifted wavelengths, called an ECD exciton couplet, located in correspondence with chromophore transition wavelength 0.
The sign of the exciton couplet depends on the absolute angle of twist (clockwise or counter-clockwise) between the two transition dipoles, while its intensity is related to the overall arrangement, including the interchromophoric distance.
Daniele Padula Page 9 In the example shown in Figure 2.2, the intense intra-molecular charge transfer (CT) band originates from the 1La transition of para-substituted benzoates; the through-space
coupling between these CT bands leads to exciton-split ECD and may serve for the determination of AC of the two stereogenic centers.
Figure 2.2: exciton coupling of two identical p-substituted benzoate chromophores forming a positive chiral twist between their La transitions; the carbinol hydrogens are represented syn
to the carbonyls and the ester group is in preferred trans conformation. ACD is the exciton
couplet amplitude in M-1 cm-1, defined as a difference between the peak and trough of the split ECD curve.
If the substrate is rigid and the chromophores orientation is known with certainty, the conclusion based on the exciton coupled ECD is comparable to X-ray analysis. Even though the two different methods provide information for solution or solid state conformation, respectively, they naturally reveal the same absolute configuration. Figure 2.2 contains the partial structure of 5-cholestane-2,3-diol bis-p-substituted benzoate and illustrates a rigid substrate where there is no conformational uncertainty about the steroidal scaffold. There is some free rotation around the C–O bonds, but the ester bonds are known to adopt usually an s-trans conformation. Furthermore, X-ray crystallographic data, molecular modeling, as well as other data have shown that the ester C=O is syn with respect to the carbinol or methane hydrogens. Thus, the intra-molecular CT transition indicated by 1La and polarized along the long axis of the
benzoate chromophore is almost parallel to the alcoholic C–O bond. Hence, the positive exciton ECD couplet, which represents the absolute chirality of the 1La transition
moments, also represents the chirality between two hydroxyl groups and allows for the unambiguous assignment of AC at C-2 and C-3.
The exciton chirality rule permits assigning the absolute configuration of a bis-chromophoric compound in a straightforward way, provided that a single, well-established conformation is prevailing. Application of the exciton chirality method may
Daniele Padula Page 10 require chemical derivatization of the sample compound with one or two properly chosen chromophores; standard microscale procedures exist for various classes of substrates.1,2 Alternatively, methods based on supramolecular chemistry have been developed where an achiral chromophoric host interacts with a chiral guest and acquires a diagnostic ECCD spectrum, which reports guest chirality.15 In particular, Zn bis-porphyrin tweezers by Berova et al.1,2,16 have been employed as chirality probes for establishing the absolute configuration of some natural products.17,18 A single site of derivatization is required to append a suitable linker and form a multi-functional conjugate capable of double binding to the metal porphyrins.
Conformational ambiguity that can render application of exciton chirality method less straightforward than for steroidal diols may occur when the cyclic system (or in general the skeleton to which the two chromophores are appended) adopts different conformations.
On a quantitative ground, a full prediction of exciton coupled spectra is possible by means of “classical” calculation approaches based on matrix methods,19–22 which, in addition to the molecular conformation, require the electronic properties of all chromophores involved to be already known. This kind of approach results useful when the number of coupled chromophores increases with respect to the cases which are typically analyzed through exciton coupling. Classical electromagnetic theory allows one to exactly evaluate the energy of any number of interacting dipoles and consequently the precise wavelength corrections; moreover, it allows one to evaluate the magnetic moment induced from one oscillating electric dipole to another one. This is what can be achieved by the so-called De Voe approach.19,20
The main limitation or drawback consists in the dipole approximation, i.e. in saying that a transition charge distribution spans an area small compared to the distances between chromophores. With extended conjugation in large chromophores or when the two interacting moieties are nearby, this approximation may no longer be valid and the results unsatisfactory.
2.2.4 Quantum-chemical Methods
With the development of computer technology, the simulation of experimental data through quantum-chemical calculation has become very common today. We can distinguish between two classes of quantum methods: semi-empirical and ab initio.
Semi-empirical implementations of molecular orbital theory represent efficient and computationally inexpensive tools for the prediction of molecular properties.23 They ignore core electrons and rely on various approximations like the neglect of differential overlap (NDO) to skip the explicit calculation of computationally demanding one- and
Daniele Padula Page 11 two-electron integrals; these latter are either put to zero or suitably parameterized to atom-related values depending on quantities such as ionization potential and electron affinity. In the context of excited-state calculations, electron correlation is taken into account by means of a truncated configuration interaction (CI).
When only singly excited states are included, a CI single (CIS) procedure is employed in connection with various semi-empirical models developed for spectroscopic purposes, such as CNDO/ S (complete NDO) and ZINDO/S (Zerner’s intermediate NDO).24 Both of them have been successfully employed for CD calculations, as demonstrated by recent reviews and articles.3,25 The main advantage of such techniques lies in the extreme quickness of calculations. The observed accuracy is usually good and may be even superior to more rigorous treatments; systematic wavelength shifts are common and must be taken into account.3 A major problem with CD calculations is the usually observed poor agreement between length and velocity formalism computed rotational strengths. Because of the parametric essence of NDO methods, their efficiency depends case by case on the system investigated, and their consistency is somewhat limited.
Both CNDO/S and ZINDO/S have been especially designed to treat aromatic and hetero-aromatic chromophores (including ligands for transition metals, for ZINDO). As a matter of fact, the large majority of literature reports on CD calculations with these two methods concerns aromatic compounds, especially biaryls.16
Concerning ab initio methods, Density functional theory (DFT) has been emerging in the last decades as the most widespread calculation method for the prediction of many different molecular properties, due to a very favorable compromise between accuracy and computational cost. In fact, for many problems, hybrid DFT functionals like the most popular B3LYP are capable of attaining degrees of accuracies similar to that of higher-level MO methods that include electron correlation (approaching full CI limit) at a considerably smaller cost.
Time-dependent DFT (TDDFT) results from application of a perturbative approach to DFT. The linear response of a system to an oscillating field, expressed through a frequency-dependent polarizability, yields prediction of electronic excitations in terms of frequency and corresponding transition dipoles (electric and magnetic).26 In this case too, observed accuracies are very high at a limited computational effort,27 which makes now routine the prediction of absorption and electronic CD spectra of medium-sized molecules (≈30 nonhydrogen atoms).28 In fact, the last decade has seen an increasing number of publications concerning TDDFT CD calculations.
Apart from the limitation put by the molecular size, the scope of TDDFT calculations is practically unlimited, still some pitfalls are known. Because of the nature of approach employed, TDDFT is intrinsically more accurate in the prediction of low-lying excited states.29 Moreover, deficiencies are observed in the description of poorly
Daniele Padula Page 12 localized states such as charge-transfer, diffuse, and Rydberg states due to self-interaction errors and incorrect asymptotic behavior of exchange-correlation functional (like B3LYP)30 employing adiabatic local density approximation. Daily efforts are put by researchers in developing new DFT functionals able to overcome such problems.31–33
The method consists in the following steps:
conformational analysis, usually at Molecular Mechanics level, and exclusion of low populated conformers;
optimization of geometries obtained from the previous conformational analysis;
excited state calculations on each conformer with TDDFT, employing, when necessary, different functionals (e.g., B3LYP, PBE0,34 CAM-B3LYP,35 BH&HLYP,36,37 BP8638) and basis sets (TZVP,39 aug-TZVP,40 ADZP,41 aug-cc-pVDZ,42 etc.)
generation of a CD spectrum as sum of Gaussians by applying a Gaussian band shape of appropriate width to each calculated rotational strength;
comparison between experimental CD spectrum and TDDFT-calculated one. Usually, the most evident difference between B3LYP and BH&HLYP-calculated spectra is a systematic wavelength shift, due to the different fraction of “exact” HF exchange in the two functionals (B3LYP, 20%; BH&HLYP, 50%); the direction of such a shift depends on the nature of transitions involved.
More details on the theory underlying the calculation of ECD spectra, especially concerning their vibronic contribution, will be given in another section.
2.3 How to Overcome the Conformational Problem
Even though in the last years computational techniques have become more and more powerful and allow with little to no problem the treatment of a “large” conformational distribution, simple approaches that eliminate or reduce this problem by a great extent are always interesting. In this section we will analyze two types of approaches that have been developed through the years, assuming, for simplicity, that the interpretation of the final spectrum will be performed through computational methods.
Daniele Padula Page 13
2.3.1 Chemical Derivatization Approach
The idea on which this approach is developed is the mutual employment of the advantages of different techniques. In order to avoid the repetition of the calculation for each conformer, some simple reaction is used to transform the compound under study in a simpler, from a conformational point of view, derivative. This approach is particularly useful for 1,2 or 1,3 difunctional compounds,43 in which the two functional groups can be employed for the synthesis of a cyclic moiety, which will result for sure in a more rigid derivative.
It must be noted that the derivatization reaction should be as simple as possible since if it is true that the number of conformations will decrease, it is also true that we are adding atoms to the molecule, and thus the calculation time on a single conformer will result higher. However, the reliability of the calculation will benefit from the derivatization because it increases when the number of conformers decreases.
This type of approach has been applied successfully both in Electronic and Vibrational Circular Dichroism, respectively by Rosini43 and Stephens.44
2.3.2 Solid-state Approach
45This approach is based on the idea that in the solid state only a single conformation is possible (unless polymorphs occur), thus all the inaccuracy and possible errors which may be encountered in the conformational analysis step are eliminated.
Compounds that can be isolated as crystals amenable to X-ray analysis offer a two-fold advantage: first, in the solid state, the molecular conformation is fixed and univocal; second, the structure can be determined with high accuracy by X-ray single-crystal diffraction experiments. Thus, the prediction of any property related to the crystalline state, such as the solid-state CD spectrum, requires a unique and already determined conformation to be taken into account.
CD spectra of microcrystalline samples may be recorded by various techniques, the most common of which is the KBr pellet. It is then possible to compare experimental solid-state CD spectra with those calculated with different methods, using the X-ray geometry as input structure and deduce the AC. This is the essence of the solid-state CD/TDDFT and its main advantage, with respect to the procedure based on solution CD calculations, is that the whole conformational analysis step is skipped.
Daniele Padula Page 14 Calculations are therefore much faster and avoid the uncertainties connected to conformational searches and geometry optimizations. A second key point is that the experimental and the calculated property (CD spectrum) refer to the very same geometry, therefore, provided that suitable and accurate means for calculating CD is chosen, a good agreement is expected between theory and experiment, and AC assignment can be performed with high confidence.
The most important limitation of the solid-state method is that it is only applicable to samples giving single crystals suitable for X-ray diffraction, although they need not to contain “heavy” elements. It must be stressed that the vast majority of natural compounds contains only H, C, O, and N atoms. A second problem associated with solid-state CD spectra is that intermolecular interactions between molecules closely packed in the crystals may give rise to non-negligible contributions to the spectrum. It is clear that any phenomenon of this kind cannot be predicted by a calculation run on a single, isolated, molecule.
Daniele Padula Page 15
References
(1) Berova, N.; Nakanishi, K.; Woody, R. W. Circular dichroism: principles and
applications; Wiley-VCH, 2000.
(2) Berova, N.; Di Bari, L.; Pescitelli, G. Chem. Soc. Rev. 2007, 36, 914–31. (3) Bringmann, G.; Gulder, T. A. M.; Reichert, M.; Gulder, T. Chirality 2008, 20,
628–642.
(4) Wang, F.; Polavarapu, P. J. Phys. Chem. A 2001, 105, 6991–6997.
(5) da Silva, C. O.; Mennucci, B.; Vreven, T. J. Org. Chem. 2004, 69, 8161–4. (6) Voloshina, E.; Fleischhauer, J.; Kraft, P. Helv. Chim. Acta 2005, 88, 194–209. (7) Tomasi, J.; Mennucci, B.; Cammi, R. Chem. Rev. 2005, 105, 2999–3093. (8) Mennucci, B.; Cammi, R. Continuum Solvation Models in Chemical Physics:
From Theory to Applications; Wiley, Chichester, 2007.
(9) Eliel, E.; Wilen, S.; Mander, L. Stereochemistry of Organic Compounds; Wiley&Sons, 1994.
(10) Pescitelli, G.; Di Bari, L.; Berova, N. Chem. Soc. Rev. 2011, 40, 4603–4625. (11) Lightner, D. A.; Gurst, J. E. Organic conformational analysis and
stereochemistry from circular dichroism spectroscopy; Wiley: New York, 2000.
(12) Devlin, F. J.; Stephens, P. J. J. Am. Chem. Soc. 1999, 121, 7413–7414. (13) He, J.; Petrovic, A. G.; Polavarapu, P. L. J. Phys. Chem. B 2004, 108, 20451–
20457.
(14) Chisholm, J. D.; Golik, J.; Krishnan, B.; Matson, J. A.; Van Vranken, D. L. J.
Am. Chem. Soc. 1999, 121, 3801–3802.
(15) Hembury, G. a; Borovkov, V. V.; Inoue, Y. Chem. Rev. 2008, 108, 1–73. (16) Berova, N.; Pescitelli, G.; Petrovic, A. G.; Proni, G. Chem. Commun. 2009,
5958–80.
(17) Ishii, H.; Krane, S.; Itagaki, Y.; Berova, N.; Nakanishi, K.; Weldon, P. J. J. Nat.
Prod. 2004, 67, 1426–30.
(18) Van Klink, J. W.; Baek, S.-H.; Barlow, A. J.; Ishii, H.; Nakanishi, K.; Berova, N.; Perry, N. B.; Weavers, R. T. Chirality 2004, 16, 549–58.
Daniele Padula Page 16 (20) DeVoe, H. J. Chem. Phys. 1965, 43, 3199.
(21) Tinoco, I. Adv. Chem. Phys. 1962, 4, 113.
(22) Rosini, C.; Zandomeneghi, M.; Salvadori, R. Tetrahedron: Asymmetry 1993, 4, 545–554.
(23) Cramer, C. J. Essentials of computational chemistry; Wiley, Chichester, 2004. (24) Zerner, M. C. Reviews in Computational Chemistry 1991, 2, 313.
(25) Bringmann, G.; Bruhn, T.; Maksimenka, K.; Hemberger, Y. Eur. J. Org. Chem.
2009, 2717–2727.
(26) Rappoport, D.; Furche, F. Lecture notes in physics, Vol. 706: Excited states and
photochemistry; 2006; pp. 337–354.
(27) Dreuw, A.; Head-Gordon, M. Chem. Rev. 2005, 105, 4009–37. (28) Diedrich, C.; Grimme, S. J. Phys. Chem. A 2003, 107, 2524–2539.
(29) Casida, M. E.; Jamorski, C.; Casida, K. C.; Salahub, D. R. J. Chem. Phys. 1998,
108, 4439.
(30) Becke, A. D. J. Chem. Phys. 1993, 98, 5648.
(31) Jacquemin, D.; Perpete, E. J. Chem. Theory Comput. 2008, 123–135. (32) Zhao, Y.; Truhlar, D. G. Acc. Chem. Res. 2008, 41, 157–67.
(33) Goerigk, L.; Grimme, S. J. Phys. Chem. A 2009, 113, 767–76. (34) Adamo, C.; Barone, V. J. Chem. Phys. 1999, 110, 6158.
(35) Yanai, T.; Tew, D. P.; Handy, N. C. Chem. Phys. Lett. 2004, 393, 51–57. (36) Becke, A. D. J. Chem. Phys. 1993, 98, 1372–1377.
(37) Becke, A. D. Phys. Rev. A 1988, 38, 3098–3100. (38) Perdew, J. P. Phys. Rev. B 1986, 8822–8824.
(39) Sch fer, A.; Huber, C.; Ahlrichs, R. J. Chem. Phys. 1994, 100, 5829–5835. (40) Kurtán, T.; Pescitelli, G.; Salvadori, P.; Kenéz, Á. Chirality 2008, 385, 379–385. (41) Neto, A.; Jorge, F. Chirality 2006, 73, 67–73.
Daniele Padula Page 17 (43) Tartaglia, S.; Padula, D.; Scafato, P.; Chiummiento, L.; Rosini, C. J. Org. Chem.
2008, 73, 4865–73.
(44) Devlin, F. J.; Stephens, P. J.; Besse, P. J. Org. Chem. 2005, 70, 2980–93.
Daniele Padula Page 18
3 Vibronic Simulation of Spectra
In this section we are going to analyze the time-independent approaches to the simulation and analysis of vibronic absorption and ECD spectra. After a brief introduction to the major problems that this kind of approach presents, we are going to define the approximations that are necessary to face this problem, so that the framework we are working within will result clear: first of all Born-Oppenheimer approximation will be recalled and then a brief mathematical description of the phenomena we are going to study is given, in order to understand which are the quantities that we need to estimate for the simulation of experimental data. Once these quantities are identified, further approximations are described, which allow the calculation of these quantities and the lineshape of the spectra.
At the very end, we will show how the inclusion of vibronic effects can actually improve a lot the quality of the calculated spectrum, besides being useful for many other reasons discussed in the Introduction.
3.1 Introduction
An electronic excitation can occur among different types of electronic states (neutral, ionic, dissociative and so on). If the system we are considering is flexible, the regions of the potential electronic surfaces (PESs) relevant for spectral signals can show a high degree of anharmonicity. If the system is large in terms of size other effects can occur, such as strong non-adiabatic couplings among electronic states, which in large systems are often triggered by the existence of a conical intersection.
The situation presented above is the most general one and at the state-of-the-art there is no rigorous method that can be applied to describe this situation in a reliable way.
However, the employment of opportune approximations, chosen depending on the system under consideration, can simplify the approach very much. Different effective approaches can be selected to fit the case in analysis (mainly rigid systems with negligible non-adiabatic coupling) to effectively simulate the spectrum. Such approaches all work within the Born-Oppenheimer approximation, which will be briefly described later, and rely on further considerations on the most relevant factors of an electronic transition: transition moments and potential energy surfaces.
Nonadiabatic problems are not rare, but the majority of the studies present in the literature focus on cases which do not show conical intersections or strong nonadiabatic
Daniele Padula Page 19 couplings. In these cases the final spectrum can be obtained as a sum of single state spectra.
Even in cases where nonadiabatic effects maybe present, a single state approach can be useful to perform a preliminary analysis and to detect the presence of such effects.
3.2 Born-Oppenheimer (BO) Approximation
The Born-Oppenheimer approximation consists in the separation of nuclear and electronic motions.
The electrostatic forces that electrons and the nuclei exert reciprocally are of the same order of magnitude, thus they have similar momentum. Because of the much greater mass of the nucleus with respect to that of electrons, the nucleus itself will have a negligible velocity with respect to that of electrons. The consequence of these assumptions is that the molecular wavefunction can be separated into two independent wavefunctions, one for the nuclei and one for the electrons, which can be independently solved.
The nonrelativistic Hamiltonian in atomic units may be written as
(3.1)
where i, j refer to electrons and A, B to nuclei. The Schrödinger equation maybe written more compactly as
(3.2)
where R is the set of nuclear coordinates and r is the set of electronic coordinates. If spin-orbit effects need to be included, a spin-orbit term can account for them.
The term prevents from separating the Hamiltonian into nuclear and electronic parts, which would allow us to write the wavefunction as a product of the nuclear and electronic terms. The Born-Oppenheimer approximation is introduced at this point: we assume that this separation is possible for the reasons described above and we make the R dependence parametric. The molecular wavefunction can thus be written as a product of the electronic and nuclear terms.
Daniele Padula Page 20
(3.3)
The nuclei positions can then be considered fixed thanks to their higher mass with respect to electrons, and the electronic part can be solved with a parametrical dependence upon R.
(3.4)
If spin-orbit coupling has to be considered it can be taken into account by an additional term.
(3.5)
3.3 Quantities Needed for the Calculations
Time-independent approaches to the calculation of electronic spectra are characterized by a summation of individual transitions from the initial state to the final state . One-photon processes can be can be summarized by the following general equation.
(3.6)
in which is the Dirac function and the notation identifies the transition dipole moments integrals between initial and final state. The replacement of the quantities with opportune quantities gives the expression for the one-photon process in which we are interested. The quantities to be computed for the spectral simulation are the transition dipole moments .
For absorption calculations we have that
Daniele Padula Page 21 while for ECD calculations it is
where is the molar absorption coefficient while , the difference between the molar absorption coefficients relative to the left (L) and right (R) circularly polarized light. is Avogadro’s number, the vacuum permittivity and c the speed of light. is the electric transition dipole moment between the vibronic states i and f and is the imaginary part of the magnetic transition dipole moment between the same vibronic states.
3.4 Transition Moment Approximations: Franck-Condon
(FC) and Herzberg-Teller (HT) Formulations.
In the discussion upon this approximation we are assuming that a single state approach is feasible, and thus we are setting this discussion within the BO approximation.
In order to compute the transition intensities for one-photon processes following equation 1.6 we need to evaluate the transition dipole moments and in case of ECD.
The most used transition approximation is Franck-Condon,1,2 which assumes that the transition takes place in such a short time that the position of the nuclei during the transition remains unchanged and so the transition dipole can be considered constant. The transition that is most likely to happen is the one with the best overlap between the ground state and excited state wavefunction.
This approximation is good for allowed transition or when the PESs involved in the transition are almost vertical with respect to each other. The limitations of this approximation are showed in cases of weakly allowed or dipole forbidden transitions. This limitation is even more important in the case of ECD, because the scalar product between the electric and magnetic transition moments may be negligible even in case of a fully allowed transition, if their orientation is nearly orthogonal.
An extension of this approach was proposed by Herzberg and Teller3 to take into account a linear variation of the dipole moment with respect to the normal coordinates of the initial state . It is possible to generalize the approach by developing the
Daniele Padula Page 22
transition dipole moment
in a Taylor series about the equilibrium geometry of the initial state ( .
(3.7)
with N the number of normal modes. The FC approximation corresponds to the first term of equation 1.7, the Herzberg–Teller (HT) one to the second one, and the acronym FCHT will refer to both terms taken simultaneously.
Following equation 1.7, the transition dipole moment is given by
(3.8)
where and are the vibronic state r in the initial electronic state i and the vibronic state s on the final electronic state f. The overlap integral is commonly known as FC integral (or factor).
The summation over k in equation 1.8 introduces an intensity-borrowing effect due to the coupling of states involved in the electronic transition with closely lying electronic states, with which they mix upon displacement along the normal coordinates.
The first derivatives that appear in equation 1.7 can be written as
(3.9)
in which the derivatives of the electronic wavefunction appear. To compute them we adopt the Herzberg-Teller expression of the electronic Hamiltonian.4
Daniele Padula Page 23
(3.10)
which has a perturbative formulation, in which is the unperturbed Hamiltonian and the other terms are perturbators.
These transition moment approximations (FC and HT) can be coupled with different possible PES approximations that can be made in the calculation of a vibronically resolved spectrum.
3.5 Potential Energy Surfaces Approximations
The description of the PESs of electronic states is a problem of general interest since a detailed knowledge of the PESs is required by both independent and time-dependent methods.
For a system characterized by hundreds of normal modes, a general solution of the anharmonic vibrational potential is not achievable, thus the harmonic approximation has to be applied at least as a starting point for the description of the PESs.
The harmonic approximation allows writing the multidimensional vibrational wavefunction as a product of one-dimensional wavefunctions.
The problem that arises when one wants to calculate the overlap integral between the initial and final state vibronic wavefunctions is that the set of normal coordinates that express the two wavefunctions is different.
Duschinsky proposed a linear relationship between the set of normal coordinates of the involved electronic states.5
(3.11)
where and are the normal coordinates of the initial and final state respectively, is the Duchinsky matrix, which represents the mixing of normal modes of the two states that occurs during the transition, and is the displacements matrix. This approximation is reasonable when upon transition the molecule does not undergo a noticeable distortion.
The description of the PESs relative of the electronic states involved in the transition relies in approximations made on equation 3.11: depending on the case we are analyzing we may want to neglect the displacements matrix or consider the Duchinsky matrix
Daniele Padula Page 24 to be the identity matrix. Approximations can be made also on the normal modes of the excited state, which we may consider identical to the initial state normal modes. These approximations will be considered in more detail in the next section.
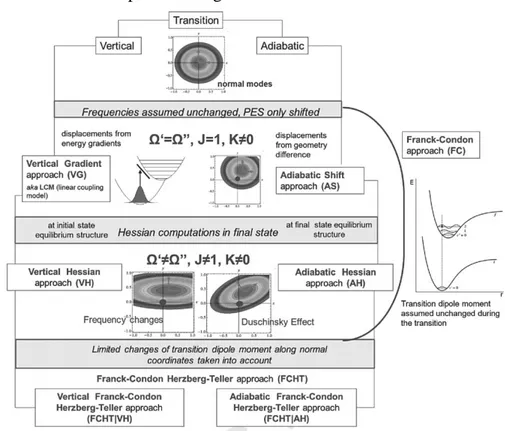
3.5.1 Adiabatic and Vertical Approaches
6Two general families of harmonic models can be individuated, namely Vertical (V) and Adiabatic (A). They share the same description of the initial state PES, built by localization of the equilibrium structure and performing a normal mode analysis, but they are different for the procedure employed to build the final state PES.
The first model lies on the observation that the most intense transitions are vertical so that a correct description of the PES of the final state about the geometry of the initial state is more suited to the analysis of the region of the spectral maximum and of the broad features of low-resolution spectra.
In adiabatic models, both initial and final PESs are built by harmonic analysis of the equilibrium geometry of the considered state. Both states are treated at the same level of accuracy, and these approaches are best suited for a high-resolution description of the spectra and where an accurate reproduction of the fine structure of the spectrum is required.
Different levels of accuracy may be employed within each of the two great families of approaches. The most accurate models require full quadratic expansions in terms of energies, gradients and Hessians. These models are called Vertical Hessian (VH) and Adiabatic Hessian (AH), and account for the Duchinsky effect, which complicates the calculation of the overlap integrals. VH and AH models are equivalent when the harmonic approximation is exact, thus the comparison between the two methods can give an idea of how much the harmonic approximation is good for the considered system.
However, the computational effort required for the application of these two methods makes other simplified alternatives attractive. The simplest assumption that can be made is that the initial and final states share the same normal modes and frequencies, and only the equilibrium position is displaced. Final state vertical energy and shifts between initial and final state equilibrium geometry are the only data required to set up these models in V or A framework respectively. These simple models are named Vertical Gradient (VG, also known as Linear Coupling Model LCM)7 and Adiabatic Shift (AS). It has been suggested that VG can outperform even the most accurate models like AH by “effectively” accounting for some anharmonicity.7
Intermediate models can be generated assuming that the normal modes remain the same upon transition, but allowing their change in frequency. These models are named
Daniele Padula Page 25 Vertical Gradient and Frequencies (VGF) and Adiabatic Shift and Frequencies (ASF) depending on the framework we are working within.
Let’s consider an electronic transition from the initial state to a final state with the equilibrium geometry of the initial state. The harmonic potential V’ for the initial state can be defined as
(3.12)
with the diagonal matrix of the normal frequencies and Q’ the vector of the associated normal coordinates, defined as
(3.13)
with M the diagonal matrix of atomic masses.
AH model. The final state PES V is expanded around its equilibrium geometry . At this point the gradient is zero by definition, thus we have something similar to what said for the initial state.
(3.14)
(3.15)
with Ead the energy difference between final state and initial state minima.
If we obtain x from 3.15 and substitute it into 3.13, we obtain that
(3.16)
(3.17)
(3.18)
By substitution into equation 1.12 we obtain that the final state PES can be written as a function of the normal coordinates of the initial state Q’.
Daniele Padula Page 26
(3.19)
We can define here some quantities. The force constant matrix , which is a non-diagonal matrix; the reorganization energy and its sum with adiabatic energy gives an estimation of the vertical excitation energy at the initial state geometry.
AS model. We said before that the approximation adopted in this model is to
consider the only difference between the initial and final states to be the equilibrium geometry of the minima of the PESs. Thus we have that , and K retains the same expression seen in the AH model above. We can write the excited state PES as
(3.20)
ASF model. We defined this model basically identical to AS, with the sole difference
that now we allow the frequency change for the normal states upon transition. The final state frequencies are defined as .
VH model. A different quadratic model can be built upon vertical data (computed at
the initial state equilibrium geometry ). The data needed are the energy ( ), the gradients ( ) and hessian ( ) of V, where the subscript x indicates that they are expressed in Cartesian coordinates. We can write the final state PES as
(3.21)
(3.22)
(3.23)
(3.24)
Final state normal coordinates are determined through an orthogonal transformation of initial state normal modes and then by setting the first derivatives to zero.
Daniele Padula Page 27
VG model. Similarly to what said in case of the AS model, here we consider that the
only difference between the involved states is a shift of the normal modes. For this model a calculation of the gradient of the final state PES is required. The model assumes that , , , .
VGF model. Here we assume that, besides the shift of the normal modes, a frequency
variation is possible. The model assumes that , , . For the application of this model the calculation of the diagonal elements of the Hessian of the excited state PES along the initial state normal modes is required.
As anticipated, any of these PESs approximations can be coupled with different transition dipole moment approximation (FC, HT or FCHT) to define the physical model applied to the problem under analysis. Excluding intermediate approximation methods (ASF and VGF) from this kind of discussion, we can schematically represent the choice of the method as reported in Figure 3.1.
Figure 3.1: schematic representation of the combination of transition dipole moments and PESs approximations.
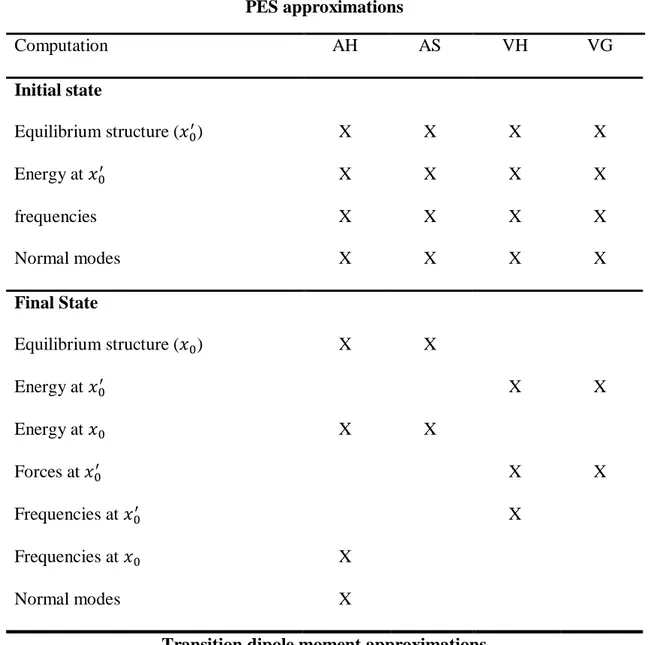
The choice of the most appropriate approach depends on the problem under analysis and the feasibility of the computations needed to obtain all the necessary information (reported schematically into Table 3.1).
All the models require the same description of the initial state, given by definition of the equilibrium geometry and calculation of the Hessian.
Daniele Padula Page 28 PES approximations Computation AH AS VH VG Initial state Equilibrium structure ( ) X X X X Energy at X X X X frequencies X X X X Normal modes X X X X Final State Equilibrium structure ( ) X X Energy at X X Energy at X X Forces at X X Frequencies at X Frequencies at X Normal modes X
Transition dipole moment approximations
Approximation FC HT FCHT
Electronic transition amplitudes X X
Derivatives of electronic transition amplitudes X X Table 3.1: ab initio computations required for the application of the chosen model for the
simulation of a vibronically resolved spectrum.
When the harmonic approximation fails, it is possible to apply anharmonic descriptions of the PES, but this is not practical for medium to large systems. Within the V framework, a method which assumes that the PES can be studied independently along each anharmonic mode has been proposed.8 Further simplifications can be added assuming there is no mixing among the anharmonic mode and all the other ones, but these description are beyond the objectives of the current work.
Daniele Padula Page 29
3.6 Prescreening of Vibronic Transitions.
The major difficulty to compute single-state vibronic spectra in bound (nondissociative) systems lies in the large amount of discrete transitions to consider, which increases steeply with the size of the system and the energy window of interest.
However, in practice, most transitions have a very low intensity that can be safely neglected. Thus, only a limited finite number of transitions give an actual contribution to the vibrational structure of the electronic spectrum. A first, preponderant step before considering the generation of any theoretical spectrum is then to define a consistent way of selecting these transitions.
Alternative solutions to this problem are offered by time-dependent approaches9 that are complementary to time-independent ones, in the sense that, renouncing to a state-to-state description of the spectrum, they can directly describe the effect of the complete ensemble of excitable stationary states.
The prescreening method employed here is based on a categorization of the multidimensional vibrational states of the final state in classes, which are defined as the number of simultaneously excited modes in a given electronic state. By convention, the electronic state of reference is the final one.
For instance, class 1 ( ) represents all the transitions to final vibrational states with a single excited mode k, and class 0 contains the overlap integral to the vibrational ground state of the final electronic state.
This selection procedure is able to evaluate both FC and HT spectra, and thanks to this versatility and the low computational cost of the prescreening procedure,10–12 a wide range of possible experimental conditions can be analyzed.
The overlap integrals in classes 1 and 2 are computed up to full convergence. In practice, one sets a chosen limit, but it can be as large as needed to reach full convergence since their calculations are cheap. Characteristic quantities can then be extracted from the ensemble of data gathered at this point. Those values are subsequently used to choose the most relevant transitions to compute in each class of higher order, starting from class 3. The prescreening gives a priori an estimate of the maximum quantum number which must be considered for each mode.
A detailed analysis of the prescreening procedure is beyond the objectives of the current work and is not really necessary to understand the interpretation of the presented results, but literature works which describe the procedure in deep detail are given in ref. 11.
Daniele Padula Page 30
3.7 Quality Improvement by Inclusion of Vibronic
Effects
It is interesting to analyze how the inclusion of vibronic effects can influence the comparison between experimental and calculated spectra. Obviously the reasons for the inclusion of vibronic effects go beyond the improvement of spectral shapes: the real objective is to understand which mechanisms generate particular spectral signals.
Many examples of these applications will be reported in the results sections, but here we want to show the differences between a purely electronic calculated spectrum, which is the most commonly calculated, and its analogous computed with inclusion of vibronic effects.
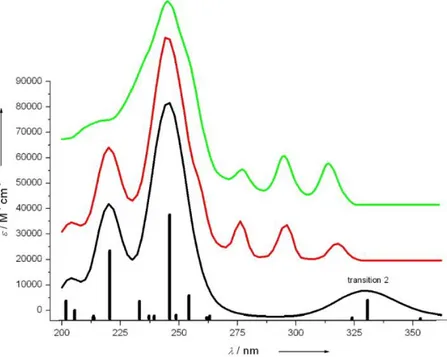
To this purpose we are going to analyze the UV spectrum of an alleno-acetylene oligomer, reported by Diederich et al.,13 which shows signals due to vibronic coupling in the region between 240-370 nm (Figure 3.2). In general, compounds containing acetylenic chromophores show UV/Vis absorption endowed with fine structure.14
Here the vibronic fine structure observed in the experimental spectrum is not reproduced by purely electronic calculations. A big part of the spectrum is completely missed and, apart from this qualitative problem, the electronic calculation does not allow assigning this spectral feature. The spacing between the bands is ca. 2200 cm-1, which corresponds to the stretching frequency of a carbon-carbon triple bond.15 Thanks to vibronic analysis it has been possible to assign this vibronic feature to the electronic transition at 330 nm, labeled as “transition 2” in Figure 3.2.
Figure 3.2: UV/Vis absorption spectra reported in ref.13. Green line: experimental. Red line: calculated included vibronic contributions. Black line: purely electronic calculated. Further