CHAPTER 6
The Epithelial to Mesenchymal Transition
in Colon cancer Cells with Microsatellite Instability
This chapter has been published under the title:
“The Epithelial to Mesenchymal Transition is Impaired in Colon Cancer Cells
with Microsatellite Instability”, Pino MS, Kikuchi H, Zeng M, Herraiz MT,
Sperduti I, Berger D, Park DY, Iafrate AJ, Zukerberg LR, Chung DC;
Gastroenterology. 2009 Dec 17.
2
Aim of the Study
Colorectal cancer (CRC) is the second leading cause of cancer deaths in the United States [1]. DNA microsatellite instability (MSI) results from inactivation of the DNA mismatch repair (MMR) system and is observed in 15% of CRCs. The remaining 85% of CRCs are microsatellite stable (MSS) and instead display chromosomal instability [2]. MSI tumors typically arise in the proximal colon and display mucinous histology as well as lymphocytic infiltration. Intriguingly, MSI colorectal carcinomas are associated with a better prognosis compared with MSS tumors. However, the precise explanation for this improved outcome is not clearly established [3].
TGFBR2 is one of the most commonly mutated genes in CRCs with MSI (up to 90% of tumors) [4]. TGF-β signaling plays a dual role in tumorigenesis. In early stages, it mediates tumor-suppressive effects. Paradoxically, at later stages, TGF-β signaling may enhance tumor progression due to its ability to inhibit cell death from growth factor deprivation, suppress immune function, and induce an epithelial to mesenchymal transition (EMT) [5]. EMT is a highly conserved process required for embryonic development, tissue remodeling, and wound repair. In addition, there is evidence that tumor progression, invasion, and metastasis involve the induction of EMT [6]. Loss of E-cadherin and concomitant induction of mesenchymal markers such as vimentin or N-cadherin lead to a disassembly of cell adherens junctions, reorganization of the actin cytoskeleton, and acquisition of a more motile and invasive phenotype [7].
To determine whether dysfunctional TGF-β signaling impairs the induction of EMT, we examined the morphological and functional effects of TGF-β on MSS and MSI colon cancer cell lines with wildtype and mutant TGFBR2, respectively. TGF-β1 effectively
induced EMT in MSS colon cancers whereas it failed to do so in MSI cell lines with mutant TGFBR2. Moreover, cancer cells with MSI but no TGFBR2 mutations underwent EMT in response to TGF-β1. Consistent with these in vitro findings, primary human CRCs with MSS expressed markers of EMT more often than stage-matched cancers with MSI. These results suggest that the impaired ability to induce EMT by TGF-β may contribute to the favorable natural history seen in MSI tumors.
4
Materials and Methods
Cell Culture
All cell lines were maintained in DMEM (GIBCO-Invitrogen, Carlsbad, CA) supplemented with 10% fetal bovine serum (FBS; HyClone, Ogden, UT) and antibiotics (penicillin/streptomycin; GIBCO). TGFBR2 genotype and MSI status of the cell lines have been previously described [8-10].
Reagents and Antibodies
Active, recombinant human TGF-β1, produced in A293 cells (Peprotech Inc, Rocky Hill, NJ) was reconstituted according to the manufacturer’s recommendation and used at a concentration of 5 or 10 ng/mL. The MEK1/2 inhibitor PD98059 (Cell Signaling Technology, Beverly, MA) was dissolved in dimethyl sulfoxide and used at 50 µM. The TGF-β RII neutralizing antibody and IgG control were from R&D Systems (Minneapolis, MN) and used at 10 µg/mL. The antibodies used in this study were purchased from the following vendors: mouse anti vimentin, clone V9, from Thermo Scientific (Fremont, CA); mouse anti E-cadherin and mouse anti N-cadherin from BD Biosciences (Bedford, MA); rabbit anti E-cadherin from Cell Signaling Technology; rabbit anti Smad4, anti Smad 2/3, anti-phospho Smad2, anti-total ERK1/2 and anti-phospho ERK1/2, all from Cell Signaling Technology; mouse anti β-Actin from Sigma-Aldrich (St Louis, MO); mouse anti Tubulin and Histone H1 from Santa Cruz Biotechnology (Santa Cruz, CA).
Immunofluorescence
Cells cultured on collagen-coated (BD Biosciences) glass coverslips were fixed, permeabilized, and incubated with the indicated primary antibodies. Alexa-conjugated secondary antibodies (Molecular Probes, Invitrogen Corporation, Carlsbad, CA) were used for visualization. The nuclei were counterstained with DAPI (Molecular Probes).
Western Blotting
Cells were scraped into total lysis buffer (Cell Signaling) containing protease inhibitors (Roche, Indianapolis, IN), and phosphatase inhibitors. Proteins were separated on SDS polyacrylamide gels, electrophoretically transferred to PVDF membranes, and incubated with the indicated primary antibodies. Proteins were visualized with horseradish peroxidase-conjugated secondary antibodies (Promega, Madison, WI) followed by chemiluminescence (ECL, Perkin-Elmer, Boston, MA).
Densitometry
Image J software was used for densitometry measurements of Western blots. All densitometry values were divided by the corresponding β-Actin band density in order to normalize values to protein loading.
Small Interfering RNA-Mediated Knock Down of TGFBR2
Cells were transiently transfected with either small interfering RNA (siRNA) targeting endogenous TGFBR2 (siTGFBR2) or a non targeting control siRNA (siControl) using Lipofectamine RNAiMAX (Invitrogen, Carlsbad, CA), following the manufacturer’s protocol. All the siRNA constructs were obtained from Ambion (Applied Biosystems,
6 Austin, TX). After removal of the transfection mixture, cells were grown overnight in serum-free medium and then stimulated with varying concentrations of TGF-β1 in medium with 0.5% FBS for 48 hours.
Quantitative Reverse Transcription-PCR
RNA was extracted using Isogen reagent (Nippon gene, Tokyo, Japan), and quantitative reverse transcription PCR was performed using SuperScript III platinum Two-Step qRT-PCR Kit (Invitrogen) following the manufacturer’s protocol. The 18S rRNA served as an endogenous control. Relative amounts were calculated using the parameter threshold cycle (CT) values.
In vitro Migration and Invasion Assays
Migration and invasion of colon cancer cells were examined using 8 µm pore size polycarbonate transwell filters (Becton Dickinson Labware, Franklin Lakes, NJ) as previously described [11]. After treatment, cells were seeded in serum-free media on the upper side of a transwell, either uncoated for the migration assay or coated with Matrigel (BD Biosciences, Bedford, MA) for the invasion assay, and allowed to migrate towards media containing 10% of FBS for 6 or 24 hours, respectively. After the incubation period, cells on the lower side of the membrane were fixed, stained with DAPI (Invitrogen) and counted. The migration and invasion indices were calculated as the mean number of cells in 10 random fields at 20X magnification.
Transient Transfections and Reporter Assays
Cells were transfected with pSBE4-BV/Luc or p3TP-Lux reporter (Addgene Inc, Cambridge, MA; plasmids 16495 and 11767), and the internal control reporter plasmid pRL-CMV (Promega, Madison, WI) using FuGENE6 (Roche). After treatment, cells were lysed and assayed for reporter activity using a Dual-Luciferase Reporter Kit (Promega). The firefly luciferase activity was normalized to Renilla luciferase activity.
Tissue Samples and Immunohistochemical Analysis
A total of 63 MSS and 66 MSI sporadic CRC were collected retrospectively from 2001 to 2008 at the Massachusetts General Hospital, Boston, MA, USA and Pusan National University Hospital, Busan, South Korea. Immunohistochemical staining of E-cadherin was defined as abnormal when the immunoreactivity was cytoplasmic instead of membrane associated (normal staining). For N-cadherin and vimentin, a cytoplasmic, membranous, or nuclear staining pattern, which is normally absent from epithelial cells, was defined as positive.
Statistical Analysis
Comparisons between test and control groups were evaluated using Student's t test. Continuous variables are expressed as median and range and categorical variables as absolute values or rates. Differences with respect to categorical covariates were evaluated using the χ2 test (overall or for trend) or Fisher’s exact test on appropriate cross-tabulations. P values ≤ 0.05 were considered statistically significant. For the calculation, a statistical package (SPSS Inc, Chicago, IL) was used.
8
Results
TGF-β1 Induces EMT in MSS Colon Cancer Cell Lines
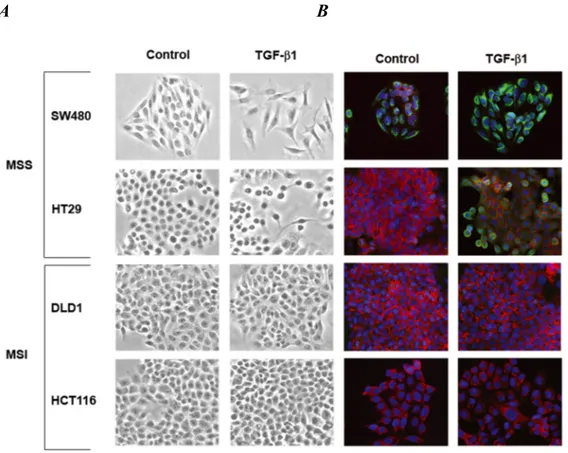
To determine whether TGF-β1 induces a mesenchymal phenotype consistent with EMT in colon cancer cells, we selected two MSS cell lines (SW480 and HT29) and two MSI cell lines (DLD1 and HCT116) with wildtype and mutant TGFBR2, respectively. Treatment with TGF-β1 for 48 hours resulted in transdifferentiation from an epithelial to a fibroblastic-like morphology only in MSS cells (Figure 1A). Consistent with this change, there was a decrease in immunostaining of E-cadherin and induction of vimentin in TGF-β1-treated SW480 and HT29 cell lines (Figure 1B). In contrast, no changes in E-cadherin or vimentin expression were observed in DLD1 and HCT116 cells.
A B
Figure 1. A and B, Phase contrast photomicrographs and immunofluorescence images of
control cells and cells treated with 5ng/mL TGF-β1 for 48 hours. In B, cells were stained with antibodies to E-cadherin (red) and vimentin (green) and then stained with DAPI (blue)
As shown in Figure 1C, levels of E-cadherin mRNA were significantly reduced after 48 hours of treatment with TGF-β1 in SW480 and HT29 cells (P=0.004 and P=0.01, respectively). The expression of vimentin mRNA was induced 1.6-fold (P=0.04) and 3.7-fold (P=0.01) in SW480 and HT29 cells, respectively. Furthermore, immunoblotting of whole cell lysates revealed a reduction in E-cadherin and increase in vimentin levels after TGF-β1 treatment in the MSS cell lines (Figure 1D). In contrast, TGF-β1 did not induce any significant change in expression levels of differentiation markers associated with EMT in DLD1 and HCT116 cells (Figures 1C and D). Collectively, these findings demonstrate that TGF-β1 induces the expression of EMT markers in MSS colon cancer cell lines with a wildtype TGFBR2 whereas it fails to do so in MSI cell lines with TGFBR2 mutations.
Figure 1. C, Relative mRNA levels of E-cadherin and vimentin in control cells and cells treated
with 10 ng/mL TGF-β1 for 48 hours. The control values have been normalized to 1, and the data are expressed as fold change in treated cells. D, Western blot analysis of E-cadherin and vimentin expression in total lysets of untreated cells and cells treated with 10 ng/mL TGF-β1 for 48 hours.
C
10 To more directly assess the role of TGF-β receptor II in the induction of EMT by TGF-β1 in MSS cells, we knocked down TGFBR2 expression in SW480 and HT29 cells via RNA interference. Suppression of E-cadherin and induction of vimentin expression in response to TGF-β1 treatment were both blocked in cells transfected with the TGFBR2-specific siRNA construct, confirming that TGFBR2 is directly responsible for TGF-β1 induced-EMT (Figures 1 E and F). Efficient TGFBR2 silencing was confirmed by immunoblotting.
Figure 1. E and F, Immunofluorescence images and relative mRNA levels of control cells and
cells treated with 5 and 10 ng/mL TGF-β1 for 48 hours, respectively, after transfection with a TGFBR2-specific siRNA construct (siTGFBR2) or a non targeting control (siControl). Efficient TGFBR2 silencing was confirmed by Western blotting.
E
Repression of E-cadherin in epithelial cells can be mediated by several transcription factors, including Snail, Slug, ZEB1, SIP1, Twist and E12/E47 [12]. To determine whether these genes were induced in response to TGF-β1, we performed quantitative RT-PCR (Figure 1G). The expression of Snail, Slug and Twist mRNA was significantly induced by TGF-β1 in SW480 and HT29 cell lines with a maximal induction of 3.8-fold (P=0.01) of Twist when compared to untreated controls. No significant changes in SIP1 mRNA levels were detected. No significant changes in mRNA levels of these repressors of E-cadherin were observed in DLD1 and HCT116 cells.
G
Figure 1. G, Relative mRNA levels of Snail, Slug and Twist, in untreated cells and cells treated with 10 ng/mL TGF-β1 for 48 hours. The control values have been normalized to 1, and the data are expressed as fold change in treated cells.
12 TGF-β1 Induces Cell Migration and Invasion in MSS Cells
Loss of intercellular adhesion and down-regulation of E-cadherin have been associated with enhanced motility and invasive potential [7]. To evaluate the migratory capacity and invasive potential of our panel of MSS and MSI cell lines, we performed a modified Boyden chamber assay [11]. TGF-β1 increased the migration of SW480 and HT29 cells 2.9-fold (P=0.02) and 2.8-fold (P=0.31), respectively, when compared to untreated control cells. No effects on migration were observed in DLD1 and HCT116 cells (Figure 2A). In addition, we used transwells coated with Matrigel as a surrogate basement membrane to investigate the ability of the cells to invade. MSS cells exhibited higher levels of invasion through Matrigel after TGF-β1 treatment compared to untreated control cells (Figure 2A). The invasion indices in SW480 and HT29 cells increased 3.2-fold (P=0.14) and 3.1-fold (P=0.04) after TGF-β1 exposure, respectively. No effects on invasion were observed in DLD1 and HCT116 cells.
A
Figure 2. A, Migratory and invasive behavior of untreated cells and cells treated with 5
ng/mL TGF-β1 for 48 hours. The control values have been normalized to 1, and the data are expressed as fold change in treated cells.
The increase in motility and invasion induced by TGF-β1 was not due to an increase in cell number. No differences in growth rate were observed between untreated and TGF-β1-treated SW480 cells. A statistically significant 15% reduction in cell counts was observed in HT29 cells treated with TGF-β1 (P=0.01) (Figure 2B). These data suggest that the phenotypic alterations observed in MSS cell lines after TGF-β1 exposure are associated with functional increases in migratory and invasive capabilities.
B
Figure 2. B, Control cells and cells treated with 5 ng/mL TGF-β1 for 48 hours were counted.
Results are expressed as percentage of viable cells compared with cells grown in the absence of TGF-β1.
14 TGF-β1 Induces Smad2 Phosphorylation, Nuclear Translocation of Smad2 and Smad3, and Transcriptional Responses in MSS Colon Cancer Cell Lines
Activation of TGF-β RII typically recruits Smad4 together with Smad2 to transmit the TGF-β1 signal [13]. Immunoblot analysis of TGF-β1-treated cell lysates with a phospho-specific Smad2 antibody revealed that MSS cell lines were highly responsive to TGF-β1. Phosphorylation of Smad2 was observed within 15 minutes and peaked at 30 minutes, indicating activation of the canonical Smad pathway (Figure 3A). The ability of TGF-β1 to induce Smad2 phosphorylation was impaired in DLD1 and HCT116 cell lines. We next examined whether TGF-β1 also mediates the nuclear translocation of Smad2. As shown in Figure 3B, a reduction in the Smad2/3 cytoplasmic fraction with a concomitant increase of the nuclear fraction was observed in both SW480 and HT29 cells. These data suggest that TGF-β1 mediates not only the activation of Smad2 but also its nuclear translocation in MSS cell lines with wildtype TGFBR2.
Figure 3. A, Cells were treated with 5 ng/mL TGF-β1 and whole cell extracts were prepared
and analyzed by Western. B, Untreated cells and cells treated with 5 ng/mL TGF-β1 for 2 hours were lysed and separated into nuclear and cytoplasmic fractions.
A
15 MADH4 splicing and nonsense mutations have been reported in SW480 and HT29 cells, respectively [8]. To determine the nature of the transcriptional response in these cells deficient in Smad4 (Figure 3C), we tested the ability of TGF-β1 to activate the pSBE4-BV/Luc reporter, which contains four repeats of an eight-base-pair palindromic SBE (Smad-binding element) driving a luciferase reporter [14]. As shown in Figure 3D, TGF-β1 was unable to activate the pSBE4-BV/Luc Smad4 reporter. However, the luciferase reporter construct p3TP-Lux, which contains the SBE and three consecutive phorbol ester-responsive elements from the PAI-1 gene, a direct target of the TGF-β pathway, was induced 1.3-fold (P<0.001) and 1.9-fold (P=0.005) after TGF-β1 treatment [15]. This partial activation of p3TP-Lux transcription suggests the involvement of Smad4-independent pathways in the TGF-β-induced response.
C
D
Figure 3. C, Levels of Smad4 were determined by Western blot analysis in whole cell lysates
from untreated cells. D, Cells were transfected with pSBE4-BV/Luc, p3TP-Lux and pRL/CMV constructs and treated with or without 10 ng/mL TGF-β1 for 18 hours. Luciferase activity was then measured.
16 Role of ERK Activation in TGF-β-Dependent EMT
The Ras-MEK-ERK cascade can regulate Smad-independent gene programs associated with TGF-β1-induced EMT [16]. Immunoblotting for phospho-ERK1/2 revealed activation of ERK1/2 within 15 minutes of exposure to TGF-β1 in SW480 cells, and this returned to basal levels after 120 minutes (Figure 4A). No effects on phospho-JNK or phospho-p38 were observed under identical conditions (data not shown). Pretreatment of SW480 cells with PD98059 completely abolished ERK1/2 phosphorylation by TGF-β1, whereas there was no effect on Smad2 activation (Figure 4B). To verify the specific role of TGFBR2, we pretreated cells with a TGF-β RII neutralizing antibody. As shown in Figure 4B, TGF-β1-induced ERK1/2 phosphorylation was significantly reduced, indicating that TGF-β RII is essential for this response. The specificity of this effect was confirmed by a reduction in Smad2 phosphorylation.
A B
Figure 4. A, SW480 cells were treated with 5 ng/mL TGF-β1 and whole cell extracts were
analyzed for the indicated primary antibodies. B, Total lysates of untreated SW480 cells, cells treated for 2 hours with 5 ng/mL TGF-β1, or cells pretreated for 60 minutes with 50 µM PD98059 or 10 µg/mL TGF-β RII neutralizing antibody were analyzed by Western blotting for the indicated primary antibodies.
To define the involvement of ERK1/2 signaling in the Smad4-independent response induced by TGF-β1, we evaluated the effect of PD98059 pretreatment on p3TP-Lux reporter activity in SW480 cells. A 55% (P=0.06) reduction in promoter activity was observed after pretreatment with PD98059 when compared to cells treated with TGF-β1 alone (Figure 4C). A 37% reduction in p3TP-Lux promoter activity was also observed with PD98059 alone (P=0.03) when compared to no treatment, suggesting that pathways other than TGF-β in these cells also activate ERK1/2.
C
Figure 4C. Cells were transfected with p3TP-Lux and pRL/CMV constructs and treated with 10
ng/mL TGF-β1 alone or after pretreatment with 50 µM PD98059 for 18 hours. Luciferase activity was then measured.
18 Inhibition of ERK1/2 kinase promoted the reversion to an epithelial morphology (Figure 4D) with a significant increase in E-cadherin protein levels (Figure 4E), both in the presence or absence of TGF-β1 in SW480 cells. These results were also confirmed at the mRNA level by quantitative RT-PCR (data not shown). In addition, PD98059 blocked the induction of vimentin in cells treated with TGF-β1.
D
E
Figure 4. D, Phase-contrast photomicrographs of SW480 cells before (control) and after
treatment with 5 ng/mL TGF-β1 alone or after pretreatment with 50 µM PD98059 for 48 hours. E, The levels of E-cadherin and vimentin expression were determined by Western blot analysis in whole cell lysates from untreated SW480 cells or cells treated with 10 ng/mL TGF-β1 for 48 hours alone or after 60 minutes with 50 µM PD98059.
To examine whether inhibition of the ERK signaling pathway also modulates TGF-β1-induced tumor cell migration, we performed a transwell assay. Pretreatment with PD98059 attenuated TGF-β1-mediated tumor cell migration in SW480 cells and similar results were obtained with a TGF-β RII neutralizing antibody (Figure 4F). Collectively, these data indicate that ERK is a direct regulator of E-cadherin and that ERK is also necessary for the induction of EMT by TGF-β in Smad4-deficient SW480 cells.
F
Figure 4 F. Tumor cell migration was evaluated in untreated SW480 cells or cells treated with 5
ng/mL TGF-β1 alone or after 60 minutes with 50 µM PD98059 or 10 µg/mL TGF-β RII neutralizing antibody. The control values are normalized to 1, and the data are expressed as fold change in treated cells.
20 TGF-β1 Can Induce EMT in MSI Cell Lines with a Wildtype TGFBR2
To determine whether MSI status plays a role in the regulation of EMT independently of TGFBR2 genotype, we used a prostate (DU145) and ovarian (MDAH2774) cell line, both of which display MSI but retain a wildtype TGFBR2 gene [9,10]. Treatment with TGF-β1 for 48 hours induced EMT, characterized by a reduction in E-cadherin and induction of vimentin at both the mRNA (Figure 5A) and protein levels (Figure 5B).
A
B
Figure 5. A, E-cadherin and vimentin mRNA levels in DU145 and MDAH2774 cell lines after
treatment with 10 ng/mL TGF-β1 for 48 hours. B, The expression of E-cadherin and vimentin was evaluated by Western blot analysis in untreated DU145 and MDAH2774 cells or cells treated with 10 ng/mL TGF-β1 for 48 hours. Densitometry values are expressed as fold change compared with control values normalized to 1
This resulted in a cellular change from an epithelial to a spindle-shaped morphology (Figure 5C). In addition, TGF-β1 treatment significantly enhanced the migration and invasion of DU145 and MDAH2774 cells (Figure 5D). These data suggest that TGF-β1 induces morphological and functional changes of EMT not only in MSS colorectal cancer cells but also in MSI cell lines with a wildtype TGFBR2 gene.
C
D
Figure 5. C, Phase-contrast photomicrographs of DU145 and MDAH2774 cells before and
after treatment with 5 ng/mL TGF-β1 for 48 hours. D, The migratory behavior of untreated cells and cells treated with 5 ng/mL TGF-β1 for 48 hours was evaluated
22 We further tested the ability of TGF-β1 to activate the pSBE4-BV/Luc and p3TP-Lux reporters in these cells, and as shown in Figure 5E, TGF-β1 activated both the pSBE4-BV/Luc (4.32- and 2.50-fold, P=0.02 and P=0.2, in DU145 and MDAH2774, respectively) and the p3TP-Lux (5.23- and 4.35-fold, P=0.01 and P=0.13, in DU145 and MDAH2774, respectively) after TGF-β1 treatment.
E
Figure 5. E, Cells were transfected with pSBE4-BV/Luc, p3TP-Lux and pRL/CMV constructs
and treated with or without 10 ng/mL TGF-β1 for 18 hours. Luciferase activity was then measured.
To further determine the role of ERK signaling, immunoblotting for phospho-ERK1/2 was performed on extracts from DU145 and MDAH2774 cells incubated with TGF-β1. No increase of ERK1/2 phosphorylation was observed whereas phosphorylation of Smad2 occurred within 15 minutes in both cell lines, suggesting activation of the canonical Smad pathway (Figure 5F).
F
Figure 5. F, DU145 and MDAH2774 cells were treated with 5 ng/mL TGF-β1 and whole cell
24 Differential Expression of E-cadherin, N-cadherin and Vimentin in Human Colorectal Carcinomas with or without MSI
TGFBR2 is mutated in as many as 90% of colon cancers that exhibit microsatellite instability [4]. To determine whether the differences in EMT observed between MSS and MSI cell lines are a valid paradigm, we examined the expression of E-cadherin, N-cadherin, and vimentin in a series of 129 human colorectal tumors. Table 1 illustrates the clinico-pathologic features of the 63 MSS and 66 MSI cases. Whereas the normal colorectal mucosa displayed uniform membranous staining of E-cadherin, aberrant cytoplasmic staining was observed in 36/129 (28%) colon cancer samples.
Table 1. Clinicopathological features of patients with colorectal cancer.
n MSS MSI P Value
n (%) n (%)
Gender
Male 69 27 (39) 42 (61)
Female 60 36 (60) 24 (40) 0.02
Age (yrs) (mean ± SD) 63.7 ± 14.3 59.9 ± 15.9 0.16
Stage I (T1 or T2, N0M0) 24 13 (54) 11 (46) II (T3 or T4, N0M0) 64 32 (50) 32 (50) III (any T, N1-2, M0) 34 14 (41) 20 (59) IV (any T, any N, M1) 7 4 (57) 3 (43) 0.55 Differentiation Well-Moderate 96 57 (59) 39 (41) Poor 33 6 (18) 27 (82) 0.0001 Location Proximal colon 84 33 (39) 51 (61) Distal colon 45 30 (67) 15 (33) 0.003 Histology Typical adenocarcinoma 103 59 (57) 44 (43) Mucinous, signet ring,
Abnormal E-cadherin staining was significantly correlated with MSS status, but not with tumor differentiation, depth of infiltration, lymph node involvement or pathological tumor stage (Table 2). Non-membranous staining of E-cadherin was observed in 37% of MSS and only 20% of MSI tumors (P=0.03). Expression of N-cadherin was identified in 49/129 (38%) cases and typically displayed a focal staining pattern. Positive N-cadherin staining was observed in 48% of MSS cancers compared with 29% of MSI samples (P=0.03). Finally, expression of vimentin was observed in 40/129 (31%) colon tumors, and was significantly associated with tumor grade (P=0.02), depth of invasion (P=0.05), nodal involvement (P=0.03), and advanced stage (P=0.01). Forty-four percent of MSS tumors exhibited positive vimentin staining compared with only 18% of MSI tumors (P=0.001).
Table 2. Association between EMT markers and clinicopathological variables.
E-cadherin N-cadherin Vimentin
Normal Abnormal P Negative Positive P Negative Positive P
Differentiation Well-Moderate 69 (72) 27 (28) 57 (59) 39 (41) 61 (64) 35 (36) Poor 24 (73) 9 (27) 0.93 23 (70) 10 (30) 0.29 28 (85) 5 (15) 0.02 Depth of invasion T1/T2 21 (70) 9 (30) 23 (77) 7 (23) 25 (83) 5 (17) T3/T4 72 (73) 27 (27) 0.77 57 (58) 42 (42) 0.06 64 (65) 35 (35) 0.05 Node Stage Negative 65 (74) 23 (26) 57 (65) 31 (35) 66 (75) 22 (25) Positive 28 (68) 13 (32) 0.51 23 (56 18 (44) 0.34 23 (56) 18 (44) 0.03 Stage I-II 64 (74) 23 (26) 57 (66) 30 (34) 66 (76) 21 (24) III-IV 29 (69) 13 (31) 0.59 23 (55) 19 (45) 0.23 23 (55) 19 (45) 0.01 Microsatellite Status MSS 40 (63) 23 (37) 33 (52) 30 (48) 35 (56) 28 (44) MSI 53 (80) 13 (20) 0.03 47 (71) 19 (29) 0.03 54 (82 12 (18) <0.001
Figure 6A illustrates representative immunostaining for all markers.
Abnormal E-cadherin expression was significantly associated with expression of N-cadherin (P=0.003; Figure 6B) and vimentin (P=0.003).
A
Figure 6. A, Examples of (a) normal (membranous) and (b) abnormal (cytoplasmic)
E-cadherin expression, (c) negative and (d) positive N-E-cadherin, and (e) negative and (f) positive vimentin expression.
B
Figure 6. B, Example of (a) abnormal (cytoplasmic) E-cadherin expression with concomitant
In addition, N-cadherin expression was significantly associated with vimentin expression (P=0.002). Since EMT has been proposed as a marker for more advanced, aggressive tumors, we sought to determine whether E-cadherin, N-cadherin and vimentin expression correlated with disease stage in MSS or MSI colorectal tumors. In both groups, we observed a trend towards increased non-membranous E-cadherin and positive N-cadherin and vimentin expression with increased disease stage. In the MSI group, the percentages of cases with a non-membranous E-cadherin, positive N-cadherin, and positive vimentin staining pattern were 23%, 28%, and 14%, respectively, in stage I/II tumors and increased only to 30% and 26% for N-cadherin and vimentin in stage III/IV tumors. There was no increase in aberrant E-cadherin staining. However, in the MSS group, the percentages increased from 30%, 41%, and 36% in stage I/II tumors to 53%, 63%, and 63% in stage III/IV tumors, respectively (P=0.04 for vimentin), suggesting that EMT markers are more prevalent in advanced stage MSS tumors.
We quantified mRNA levels of E-cadherin, N-cadherin, vimentin, and PAI-1 in a series of 55 macrodissected tumors from the same group of patients, including 29 MSS and 26 MSI samples (Figure 5C). MSI cancers expressed significantly higher levels of E-cadherin and lower levels of PAI-1 mRNA (3.9-fold increase, P=0.03 and 0.58-fold decrease, P=0.04, respectively) compared with MSS cancers. No significant differences in N-cadherin and vimentin mRNA levels were observed, most likely due to the stromal contamination of our macrodissected samples. Snail, Slug, Twist and SIP1 mRNA expression levels were measured, and a significant reduction in Snail mRNA levels was observed in MSI tumors (0.7-fold reduction, P=0.03; Figure 5D). Overall, these data indicate that primary colorectal cancers with MSS express markers of EMT more often than cancers with MSI.
28
C
D
Figure 5. C, Quantitative RT-PCR for E- cadherin, N-cadherin, vimentin and PAI-1 mRNA
was performed in MSS and MSI human colorectal cancer samples. D, Quantitative RT-PCR for Snail, Slug, SIP and Twist mRNA was performed in MSS and MSI human colorectal cancer samples. mRNA levels in MSS tumors were normalized to 1.
Discussion
High frequency MSI is observed in 15% of CRCs. The clinical behavior of these MSI tumors is distinctive, and the most intriguing and consistently described feature is the enhanced survival benefit that does not appear to be attributable to differences in therapeutic response [3]. The molecular basis for the prognostic advantage due to MSI is not clearly established. Mutations of APC, KRAS and TP53, all associated with a poor prognosis, are reported less frequently in MSI colorectal cancers [17]. An intense lymphocytic infiltrate is commonly seen in tumors with MSI. This observation has lead to the hypothesis that mutations in cell-surface molecules might trigger immune responses that ultimately limit tumor growth. Indeed, recent data indicate that a group of novel frameshift peptides generated through mutations in coding microsatellites can be recognized as immunogenic by tumor-infiltrating T cells in patients with MSI cancers. When presented to antigen-specific T-cells, these peptides can induce a specific cytotoxic immune response, potentially limiting MSI tumor growth and dissemination [18].
We focused attention on TGF-β receptor type II (TGFBR2), a gene commonly mutated in MSI tumors [4]. Several reports have indicated that TGFBR2 mutations may be associated with significantly improved survival in patients with MSI colon cancers [19]. TGF-β can act as a tumor suppressor at early stages of tumorigenesis, but enhance tumor progression, invasion and metastasis as a major inducer of epithelial to mesenchymal transition at later stages [5]. Here, we demonstrate that TGF-β1 induces EMT in colon cancer cell lines with a wildtype TGFBR2. However, no changes in cell morphology, expression of differentiation markers, motility, and invasion were observed in cells with homozygous TGFBR2 mutations. More importantly, TGF-β1 induced phenotypic changes
30 of EMT in DU145 and MDAH2774 cancer cells, both of which display MSI but retain a wildtype TGFBR2 gene. Our data are in agreement with the results of gene expression profiling analysis of the NCI-60 panel of cancer cell lines, which also includes human cancer cell lines of colorectal origins [20]. Increased instability of chromosomal content, typically seen in MSS tumors, was associated with upregulation of genes including vimentin that are involved in motility, migration, and EMT.
The role of TGF-β-activated Smads in EMT is complex. Expression of Smad2, Smad3 and/or Smad4 induces EMT whereas expression of dominant negative receptor-Smad or inhibitory receptor-Smad7 can block TGF-β-induced EMT [21]. However, there has been recent evidence that dominant negative Smads or Smad4 knockdown can block some TGF-β-induced gene responses but not EMT [22]. TGF-β can also signal through non-Smad pathways, and activation of the ERK1/2, p38, Jun N-terminal protein kinase (JNK), Rho GTPase, and PI3-kinase/AKT pathways in response to TGF-β have been linked to EMT [23]. The relevance of ERK1/2 has been recently highlighted in a transcriptome screen of keratinocytes stimulated with TGF-β. TGF-β regulated 80 EMT-related genes with defined roles in cell-matrix interactions and cell motility that depended upon ERK activation [24]. In SW480 cells, which are Smad4-deficient, the ERK1/2 pathway was directly involved in the EMT process driven by TGF-β1. This was supported by the activation of ERK1/2 with TGF-β1 treatment and the blockade of the phenotypic effects of TGF-β1 by PD98059. Consistent with previous observations in the literature, ERK1/2 blockade alone up-regulated E-cadherin expression in SW480 cells [25,26]. These findings are consistent with a model in which ERK signaling can also regulate EMT, and in the context of Smad4 deficiency, TGF-β can mediate some of its effects through ERK. However, the molecular details for this cross-talk have not yet been defined.
EMT is an important component of cancer progression. Changes of EMT have been associated with features of advanced disease including metastasis, resistance to chemotherapy, and generation of cancer cells with stem cell-like characteristics [27]. Specifically, loss or abnormal intracellular localization of E-cadherin in breast and colon cancer has been associated with advanced histological grade, metastasis, and decreased disease-free as well as overall survival [28,29]. Similar results have been reported in bladder and non-small cell lung cancers [30,31]. In our analysis of 129 human colorectal cancer cases, abnormal cytoplasmic E-cadherin staining and expression of N-cadherin and vimentin were associated not only with clinicopathological variables of poor prognosis but also with microsatellite stability. Loss or reduced junctional E-cadherin promotes the invasiveness of tumor cells by reducing the interactions between neighboring cells. Furthermore, cell invasiveness and tumor progression is often accompanied by de novo expression of vimentin coupled with “cadherin switching”, in which E-cadherin is replaced by N-cadherin. To our knowledge, this is the first report of positive vimentin expression in colon tumor cells. In previous studies, vimentin has been specifically reported to be expressed in the stroma but not in colorectal tumor cells [32]. These observations highlight the clinical relevance of the relationship between MSI status and EMT seen in vitro.
In summary, our data define a unique set of molecular and cellular consequences of TGFBR2 mutations that are typically observed in colon cancers with MSI. These mutations interfere with TGF-β-induced EMT and therefore reduce the migratory and invasive capabilities of these cells. Tumors with MSI but without TGFBR2 mutations underwent EMT in response to TGF-β1, suggesting that TGFBR2 genotype and not MSI status per se may be the key determinant of the EMT response and ultimately, prognosis. In addition to providing a potential molecular explanation for the favorable outcome consistently
32 observed in MSI tumors, these findings suggest a rationale for the therapeutic inhibition of TGF-β signaling in MSS colorectal tumors.
References
1. Jemal A, Siegel R, Ward, et al. Cancer statistics, 2008. CA Cancer J Clin 58, 71-96 (2008).
2. Grady W. Genomic and epigenetic instability in colorectal cancer pathogenesis. Gastroenterology 135, 1079-1099 (2008).
3. Popat S, Hubner R, Houlston R. Systematic review of microsatellite instability and colorectal cancer prognosis. J Clin Oncol 23, 609-618 (2005).
4. Markowitz S, Wang J, Myeroff L, et al. Inactivation of the type II TGF-beta receptor in colon cancer cells with microsatellite instability. Science 268, 1336-1338 (1995).
5. Roberts A, Wakefield L. The two faces of transforming growth factor beta in carcinogenesis. Proc Natl Acad Sci USA 100, 8621-8623 (2003).
6. Thiery J. Epithelial-mesenchymal transitions in tumour progression. Nat Rev Cancer 2, 442-454 (2002).
7. Yamaguchi H, Wyckoff J, Condeelis J. Cell migration in tumors. Curr Opin Cell Biol 17, 559-564 (2005).
8. Woodford-Richens K, Rowan A, Gorman P, et al. Smad4 mutations in colorectal cancer probably occur before chromosomal instability, but after divergence of the microsatellite instability pathway. Proc Natl Acad Sci USA 98, 9719-9723 (2001). 9. Sun X, Chen C, Vessella R, et al. Microsatellite instability and mismatch repair
target gene mutations in cell lines and xenografts of prostate cancer. Prostate 66, 660-666 (2006).
10. Orth K, Hung J, Gazdar A, et al. Genetic instability in human ovarian cancer cell lines. Proc Natl Acad Sci USA 91, 9495-9499 (1994).
11. Albini A. Tumor and endothelial cell invasion of basement membranes. The matrigel chemoinvasion assay as a tool for dissecting molecular mechanisms. Pathol Oncol Res 4, 230-241 (1998).
12. Natalwala A, Spychal R, Tselepis C. Epithelial-mesenchymal transition mediated tumourigenesis in the gastrointestinal tract. World J Gastroenterol 14, 3792-3797 (2008).
13. Feng X, Derynck R. Specificity and versatility on the TGF-beta signaling through Smads. Annu Rev Cell Dev Biol 21, 659-693 (2005).
14. Zawel L, Dai J, Buckhaults P, et al. Human Smad3 and Smad4 are sequence-specific transcription activators. Mol Cell 1, 611-617 (1998).
15. Wrana J, Attisano L, Cárcamo J, et al. TGF-beta signals through a heteromeric protein kinase receptor complex. Cell 71, 1003-1014 (1992).
16. Janda E, Lehmann K, Killisch I, et al. Ras and TGF cooperatively regulate epithelial cell plasticity and metastasis: Dissection of ras signaling pathways. J Cell Biol 156, 299-313 (2002).
17. Klump B, Nehls O, Okech T, et al. Molecular lesions in colorectal cancer: Impact on prognosis? Original data and review of the literature. Int J Colorectal Dis 19, 23-42 (2004).
34 18. Schwitalle Y, Kloor M, Eiermann S, et al. Immune response against
frameshift-induced neopeptides in HNPCC patients and healthy HNPCC mutation carriers. Gastroenterology 134, 988-997 (2008).
19. Watanabe T, Wu T, Catalano P, et al. Molecular predictors of survival after adjuvant chemotherapy for colon cancer. N Engl J Med 344, 1196-1206 (2001). 20. Roschke A, Glebov O, Lababidi A, et al. Chromosomal instability is associated
with higher expression of genes implicated in epithelial-mesenchymal transition, cancer invasiveness, and metastasis and with lower expression of genes involved in cell cycle checkpoints, DNA repair, and chromatin maintenance. Neoplasia 10, 1222-1230 (2008).
21. Valcourt U, Kowanetz M, Niimi H, et al. TGF-β and the Smad signaling pathway support transcriptomic reprogramming during epithelial-mesenchymal cell transition. Mol Biol Cell 16, 1987-2002 (2005).
22. Levy L, Hill C. Smad4 dependency defines two classes of transforming growth factor {beta} (tgf-{beta}) target genes and distinguishes tgf-{beta}-induced epithelial-mesenchymal transition from its antiproliferative and migratory responses. Mol Cell Biol 25, 8108-8125 (2005).
23. Derynck R, Zhang Y. Smad-dependent and Smad-independent pathways in TGF-β family signalling. Nature 425, 577-584 (2003).
24. Zavadil J, Bitzer M, Liang D, et al. Genetic programs of epithelial cell plasticity directed by transforming growth factor-beta. Proc Natl Acad Sci USA 98, 6686-6691 (2001).
25. Conacci-Sorrell M, Simcha I, Ben-Yedidia T, et al. Autoregulation of E-cadherin expression by cadherin-cadherin interactions: The roles of beta-catenin signaling, Slug, and MAPK. J Cell Biol 163, 847-857 (2003).
26. Li Q, Mattingly RR. Restoration of E-cadherin cell-cell junctions requires both expression of E-cadherin and suppression of ERK MAPK kinase activation in RAS-transformed breast epithelial cells. Neoplasia 10, 1444-1458 (2008).
27. Polyak K, Weinberg R. Transitions between epithelial and mesenchymal states: Acquisition of malignant and stem cell traits. Nat Rev Cancer 9, 265-273 (2009). 28. Heimann R, Lan F, Mcbride R, et al. Separating favorable from unfavorable
prognostic markers in breast cancer: The role of E-cadherin. Cancer Res 60, 298-304 (2000).
29. Ikeguchi M, Taniguchi T, Makino M, et al. Reduced E-cadherin expression and enlargement of cancer nuclei strongly correlate with hematogenic metastasis in colorectal adenocarcinoma. Scand J Gastroenterol 35, 839-846 (2000).
30. Baumgart E, Cohen M, Silva Neto B, et al. Identification and prognostic significance of an epithelial-mesenchymal transition expression profile in human bladder tumors. Clin Cancer Res 13, 1685-1694 (2007).
31. Al-Saad S, Al-Shibli K, Donnem T, et al. The prognostic impact of NF-kB, p105, vimentin, E-cadherin and Par6 expression in epithelial and stromal compartment in non-small-cell lung cancer. Br J Cancer 99, 1476-1483 (2008).
32. Ngan C, Yamamoto H, Seshimo I, et al. Quantitative evaluation of vimentin expression in tumour stroma of colorectal cancer. Br J Cancer 96, 986-992 (2007).