\
Department of Business and Management Course of Corporate Strategies
“
CEO and Managerial Capabilities Effects in the ICT industry: a variance
decomposition simulation”
THESIS SUPERVISOR GRADUATING Prof. Alessandro Marino Lorenzo Veturi ASSISTANT SUPERVISOR ID: 649421 Prof. Matteo De Angelis
1
To my parents
2
-Table of Contents
1. INTRODUCTION ... 5
2. VARIANCE DECOMPOSITION ANALYSIS ... 5
3.EMPIRICAL SETTING ... 8
3.1. DATA ... 9
3.1.1. DATA ON CORPORATE-LEVEL DECISIONS ... 11
3.2. STATISTICAL METHODOLOGY ... 13 4. RESULTS ... 14 5. DISCUSSION ... 20 6. CONCLUSIONS ... 21 Acknowledgements ... 23 References……….22 Appendices………24
3
-Tables and Figures
Table 1. ICT Company Sample ... 10 Table 2. Increment to Explanatory Power by Type of Effect ... 17 Table 3. Increment to explanatory power (incremental R2) for each effect with no time lag and one-year lag ... 18 Table 4. Comparison of results with previous studies ... 19
4
-Abstract
How CEOs affect strategy and performance is obviously relevant to strategic management research. In this paper the evidence on CEO effect, associated with corporate managerial actions, is analyzed in depth, within a single industry and on a time period of reasonable length. In particular, this study addresses the issue of the relative degree of variance in ROA accounted for by year, corporate, a proxy for managerial decisions and the person of the CEO herself. Most of the earlier literature focused much more on one of the two factors, separately. Here I propose a model that encompasses both CEO and corporate level decision effects, the latter representing what managers implement and, especially, how they do that. Further, rather than considering a corporate level fixed effect, I have presented a time-varying one. Several tests on this model will be carried out in detail.
Contrary to previous literature, I find a negligible CEO effect, while management capabilities, as it was in earlier studies, account for a significant part of the variance explained, thus implying their prominence in profitability analysis research. I have also performed the interaction term between CEO and the managerial capability proxy variable and, interestingly, find it explaining a significant portion of variance in firm profitability. This finding would emphasize the organizational dimension of CEOs’ actions. The concept of managerial capabilities is employed here to firmly restate the heterogeneity in managerial decisions and, consequently, their relatedness to firm performance in a changing external environment.
5
-1. INTRODUCTION
The variance decomposition literature in strategic management has grown rapidly over the last several years (Rumelt, 1991; McGahan and Porter, 1997, 1999, 2002, 2003). Most of this work has concentrated on the percentage of firm performance explained by industry, corporate and firm effects (e.g. Schmalensee, 1985; Rumelt, 1991; Roquebert, Phillips, and Westfall, 1996; McGahan and Porter, 1997, 1999, 2002, 2003). Apart from Lieberson and O’Connor 1972, Weiner 1978, Thomas 1988 and Wasserman, Nohria, and Anand 2001 papers, there have been no other works that examined the percentage of variance in firm performance explained by CEO effects and Management Capabilities.
This study partitions the total variance in rate of return among firms within the same industry – gathered at the corporate parent level – time factors, factors associated with strategic decisions taken at the corporate level and, finally, factors related to those people taking decisions for the companies’ growth: CEOs. I estimate the time-varying corporate effect associated with corporate-level managerial decisions, restating and developing the concept of
dynamic managerial capabilities (Adner, Helfat 2003). I have included the analysis of the CEO effect to check whether a significant change was brought into the original model. Theory
and empirical evidence of connections to performance overflow within each paradigm, but, surprisingly, very little has been done to investigate the two and evaluate the relative effect of each on firm profitability.
2. VARIANCE DECOMPOSITION ANALYSIS
In the past, variance decomposition has involved the breakdown of both business-level or corporate level performance as a dependent variable, generally including many of the following elements in a descriptive model:
r
ijt= µ+ α
i+ β
j+ γ
t+ ϕ
ij+ δ
it+ ε
ij (1)where
r
ijt denotes the rate of return of business or company operating in industry i, in time6
-are corporate effects (if a business level variable is chosen), the
γ
t are year effects, theϕ
ij arebusiness effects (from company operations contained in a singular industry), the
δ
it are industry-year interaction effects, and theε
ijt is the residual. Evidently, the model changes withrespect to the dependent variable and the interaction terms analyzed.
On the one hand, if a business level performance variable is selected, then the descriptive paradigm will include the corporate effect, which represents the performance at the consolidated level or the holding company performance. On the other hand, if the corporate level performance is used as a dependent variable, then the variance could be further decomposed at the business-segment or business-unit level, depending on the available data. The elements contained in a model always depend upon the data at hand, in terms of quality and size.
The majority of past research contributions use ROA as a dependent variable measure. ROA indicates the profitability of a company with respect to its total assets. It gives an idea on how efficient the management of a company is, at using its assets, to generate earnings. Specifically, it could be calculated either using net income or profit and loss before taxes. For what concerns the factors, studies often interpret the industry, business and corporate effects as reflecting ‘stable’ differences in business returns associated with each of these classes of effects. In practice, for the estimation of these effects practitioners use differences in the average returns over the sample time period. Industry effects derive from differences between industries in the average of returns to individual businesses in each industry. Business effects typically derive from differences between businesses in the average of annual returns to each business. Therefore, only the average returns of businesses within a corporation matter (if that analysis level is chosen) for the estimation of a corporate effect. Consequently, individual corporations do not need to have an impact on all the businesses they operate in to produce a ‘corporate effect’ (Brush and Bromiley, 1997). Corporate effects derive from differences between multiple-division corporations in the average of returns to individual businesses in each corporation. Year effects derive from differences between years in the average of returns to individual businesses. It represents year-to-year fluctuations in macroeconomic conditions that influence all corporations, or business units, equally. Each firm is different to some extent in each period of time, and this is not uniform across time. That is, the firm, its strategy and the environment change over time.
7
-Then a number of possible interaction effects could be assessed. One of the most used is the industry-year effect that represents the fact that industry effects may vary between years. Furthermore, it is crucial to consider that, at any given time, some firms are better prepared to deal with coexistent environment features than others. Hence, there is an interaction effect between individual firms and the contemporaneous environment, which is not captured by the fixed year effect. This has led practitioners to formulate models with the firm-year interaction effect that I have included in my model.
Analysis and variables used
Here, I employ the ANOVA variance decomposition, considering the following equation:
r
iy= µ + γ
y+ φ
i+ β
i j+ α
ceo,y+ ɸ
iy+ δ
it+ ε
ijt (2)With respect to equation (1), in the above descriptive model
r
it denotes the rate of return ofcompany i in year y. It adds a simple form of time-varying corporate effect from one particular type of managerial decision βi j. Further, the model includes
α
ceo, ywhich is adummy code that represents the CEO effect or the premium (or deficit) associated with the CEO who leads the company in year y; the
ɸiy
represents the interaction term between CEO and managerial decisions; theδ
it are firm-year interaction effects and theε
ijt are randomdisturbances. It drops variables such as industry and business-segment that were heavily employed in past research. The sizes of the individual effects are determined by a simultaneous ANOVA (McGahan and Porter, 2002).
Consistent with most previous works on CEO effects (e.g., Fitza 2013; Ahn et al., 2009; Crossland and Mackey, 2008; Hambrick, 2007; Wasserman et al., 2001; Thomas, 1988) as well as variance decomposition analyses in corporate effects in the strategic management literature (e.g., Bowman and Helfat, 2001; Brush and Bromiley, 1999; McGahan and Porter, 1997, 2002; Rumelt, 1991), I have used here the return on assets (ROA) for the dependent variable, as a measure of accounting-based firm performance. This measure is calculated as profit before taxes divided by total assets. There are studies that have utilized alternate
8
-measures such as Tobin’s q and market share for business effects or corporate focus variables for corporate effects. Bowman and Helfat (2001) offer a comprehensive review of these studies.
3. EMPIRICAL SETTING
The Information Communication and Technology industry (ICT) provides the empirical setting for this study. I have considered a period between 1992 and 2014. This industry context involves computer networking or data network or the study of the technology used to handle information and improve communication. In addition to the subjects included in Information Technology (IT), ICT encompasses areas such as telephony, broadcast media and all types of audio and video processing and transmission. The investigated company sample is the most comprehensive, with that respect, and actually extends to a broader set of corporations, including those operating in the electronic and digital entertainment. In this scenario, all the companies face the same external difficulties and there are a plenty of factors that could affect profitability. In this highly competitive, fast paced environment - characterized by tremendous uncertainty – CEOs are deemed to find the best strategies to boost performance and shareholders’ value. Resources could be really rare, talented people are essential and every kind of decision process is clearly time constrained. Taking all together, ICT is one of the most competitive environments where CEOs could be easily thought as indispensable, given the huge impact of their role and the repercussions of their decisions in shaping companies’ future.
9 -3.1. DATA
U.S. Government disclosure reporting standards (like the FRS1 in Adner-Helfat 2003) or Compustat’s ExecuComp database have been the data source for the vast majority of past variance decomposition studies. However, for what concerns the elaboration of this research, I could not benefit from such precious access. Having set the focus on the ICT industry, I have used a number of online sources, analyzing individual CEOs’ curricula and check for their affiliations.
My data sample includes a total of 50 companies over a 22-year time period. Financial data on companies’ performance have been taken from Bureau Van Dijk’s Osiris database. Some of the companies reported data for only part of this period, due to acquisitions, spin-offs and start-ups. If a company has had financial information available for only part of the period, I have excluded the company’s data for that time frame from the analysis. If a company reported financial information for only part of a year, then company’s data in that year have to be excluded. In addition, the analysis includes only parent companies since the majority of firms in the sample do not own subsidiaries. For those corporations that do own domestic or foreign subsidiaries, Osiris Database does not include data, thus making impossible to correctly ascertain corporate and other effects. Table 1 below lists the companies in this analysis.
As already mentioned, the dependent variable used in the decomposition of variance is annual return on assets (ROA). These data are taken from Osiris Financial Database and are expressed as profit and loss before taxes divided by total assets.
CEOs, instead, are only those people in charge for that precise role (I have also included those CEOs in charge of chairmanship as usual in US). Any other member of the executive committee as well as any board member other than the CEO was taken out of the sample. One of the main concerns of past research regarded the selection of CEOs. Indeed, CEOs usually serve in that capacity in only one company, resulting in a complete confounding of CEO and corporation. These studies assess the effect of a particular CEO in a particular company at a particular time but have the limit to specify the CEO effect, linking it to
1
10
-company and time. Here, I propose a generalized, independent version using a sample of CEOs who served in more than one company to overcome this confounding (see Appendix A). Although this selection criterion can likely address these issues, other aspects of confounding will be nevertheless unresolved. For example, the experience of a CEO in one firm can undoubtedly influence the performance of the same CEO in subsequent firms. Moreover, there are other factors like the preference to hire CEOs with certain previous experience (outsiders) other than those coming from the inside the corporation and this condition applies to industries as well. Hence, a CEO performance effect in a certain firm will be contingent to some degree to different particular combinations and interactions of events, trends and, largely, on the internal organization of the firm itself.
Table 1. ICT Company Sample
Company Name Time Frame
ADTRAN 2005-2007
ALK Technologies 2011-2013
Allscripts Health Solutions Inc 2010-2011
AMD 2011-2013
ANADIGICS 1998-2008
Aruba Networks 2006-2013
Avago Technologies 2006-2013
Avistar Communications Corp 2007-2013
Centura Software Corporation 1996-1998, 2013
Cisco Systems 1995-2013 Comarco 2007-2010 CompuCom 1999-2004 Computer Sciences 2012-2013 Cummins Inc. 1992-1995 EA 2005-2013 Ebay 1998-2008 EMC 2000-2013 Extreme Networks 2010-2013 FriendFinder Networks 1996-1998 Gateway Inc 2006-2008 Gemplus International 2000-2001 HP 1997-2013
Integrated Circuit Systems 1999-2005
Integrated Device Technology 2005-2008
11
-Lenovo 2009-2011
Lucent Technologies Inc 1996-2003
Majesco Entertainment Company 2004-2005
Meru Networks 2012-2013 Misysplc 2006-2012 Motorola 1992-2011 Motorola Mobility 2011-2013 NCR Corporation 2005-2013 Oracle 2004-2013 Polycom 2009-2013 Progress Software 2011-2013 Selectica 2007-2013 SonicFoundry 2011-2013 Sun Microsystems 1999-2002 Symantec Corporation 2009-2012 Symbol Technologies 2002-2005 Taleo Corporation 2005-2012 Tandbergasa 2002-2006 Telco Systems 2011-2013 Terabeam Corporation 2000-2004 Trident Microsystems 2011-2012 Unisys Corporation 2008-2013 Verizon 2000-2011 Vmware 2008-2013 Wang Laboratories 1993-1999
Source: personal elaboration
As illustrated by the table above, due to the limited availability of data for these companies2 and to the particular industry dynamics, I have registered missing years for each company record, implying an unbalanced dataset. At the beginning, my sample counted a total of 312 observations, downsized to 283 after the above stated considerations.
3.1.1. DATA ON CORPORATE-LEVEL DECISIONS
Research & Development (R&D) spending has been chosen as a proxy for managerial decisions. These data have been taken from Osiris Financial Database that provides customized options for the types of indices to use. Particularly, more than a mere budget expense, I have employed a composite measure given by R&D expenditure for the period
2
12
-divided by operating income. This index ties the static R&D budget to the revenues generated by the core activities of the firm. Additionally, it emphasizes the organizational dimension in which strategic decisions occur. R&D reflects decisions at the corporate level of management and is about resource allocation and choice of businesses within the corporation. The R&D decisions generally reflected efforts by corporate management to increase profits, by selecting the most profitable product development projects or allocating resources to more profitable divisions.
βi j in equation (2) could be seen as a type of firm-year interaction effect that is tied directly
to corporate managers. Clearly, it is time-varying, in the sense that corporate managers may make a series of decisions over time. t represents a multiple-year time period that begins with the year in which a decision occurs in corporation i and terminates in the year prior to the next decision of the same type made by the same corporation.
This concept has been resumed from Adner-Helfat’s research of 2003. They employed a dummy variable, identified in downsizing that, by the nature of the decision, had to have come from the corporate level of management. They coded all announcements in the Wall
Street Journal and selected those highlighting management actions in the form of downsizing.
Among the identifiable categories of downsizing decisions there were cost cutting, layoffs, and financial as well as organizational restructurings.
Contrary to Hadner-Helfat research, I have adopted a continuous quantitative variable with the aim of reaching a better explanatory fitting. This factor represented the biggest issue of this study. While continuous variables typically offer more information than dichotomous variables, establishing validity for continuous variables measuring something like managerial talent could be extremely problematic. Yet, even if a good measure of managerial ability were available, this measure would have to vary over time to avoid being collinear with the fixed effect corresponding to each executive.
However, R&D proved to be particularly appropriate at reflecting ICT managers’ decision characteristics. There are several advantages of using R&D over operating income as proxy for managerial actions. It targets only core business projects that are fundamental for firm’s growth and, contrary to downsizing, would not affect extraordinary items that do not enter into the ROA formula (in that case a conservative approach should be taken in evaluating only longer lasting effects on operating cash flows). It represents one of the most leading
13
-measureable drivers on which CEO rely on in the ICT industry. Further, a decision of the type of downsizing would not have had much business sense in this context.
As I have pointed out, I use R&D divided by operating revenue as this estimate offers additional advantages. In fact, CEOs not only have to decide on the allocation of these funds among the best investment alternatives but they do have to be aware of the consequences that this choice has on the cash flows generated by the company’s operations, implying a continuous and careful trade-off between growth and prudence. Then, there will be CEOs who are eager to make their companies thriving and would therefore take on a more aggressive approach. On the contrary, there could be CEOs who prefer to consolidate and defend the business and would more likely to take on a conservative approach. All depends on the specific contingent sub-environment that the company is facing inside the industry and by the type of CEO at the helm. Yet, these considerations can actually be regarded as both good and bad news as they widen the significance of the measure itself and, consequently, its application.
Despite the good fitness displayed by this variable I would like to point out the limits too, as these represent mainly technical problems and are therefore crucial in evaluating final results. R&D is a quantitative variable and contrary to a dummy code, recorded observations may present excessive variability resulting in results destabilization. In order to reduce this variability, I have modified the distribution, centering it on the mean. Like firm performance, because of the specific nature of the industry and the poor availability of information in general, data do not cover all the years for each company in the sample. In addition, there are no references in the past literature that used similar approaches, leaving this study to be a standalone example without direct comparable analyses. Taking a very conservative approach, I would recommend new tests and further research before reaching complete reliability on the ANOVA based on these variables.
3.2. STATISTICAL METHODOLOGY
I have employed a simultaneous ANOVA performed with R Statistical Software to decompose the variance of the return on assets at the company level for equation (2). As said before, there are studies that estimated CEO effects using a nested ANOVA. However, a
14
-nested ANOVA assumes that no covariance exists between the individual effects. This assumption may be too optimistic. A key advantage of a simultaneous ANOVA is the ability to control for such covariance between the CEO effect and all other effects.
The R procedure for computing the analysis of variance is the anova or aov function. The default procedure set in R is the “Type I effect” or the sequential sum of squares. This procedure leads to unclear results as it tests the main effect of a factor and estimates the main effect of the subsequent factor only after the main effect of the former. Because of the sequential nature and the fact that the factors are tested in a particular order, this type of sums of squares will give different results for different ordering schemes, depending on which main effect is entered first. If using this command we still bear all the disadvantages of a nested ANOVA. The vast majority of past studies used this technique.
As I have pointed out, due to turnover CEOs, I have registered an unbalanced sample. When data are unbalanced, there are different ways to account for the ordering entry of variables in the ANOVA. This leads to use “type III” sum of squares R command that effectively neutralizes the unwanted effect due to the order of entry of variables. Type III tests for the presence of a main effect after the other main effects and interactions. The hypothesis of interest in this case is about the significance of one factor while controlling for the level of the other factors. However, even after correcting for the entry order of variables statistical results remained unchanged. This means that the order in which variables are entered does not impact considerably the effects derived by the model. In the following section I have constructed an analysis of variance table in a “neutralization format”, as previously reported in McGahan and Porter paper of 2002 to show how this mechanism effectively works.
4. RESULTS
In this section, I show the results of a simultaneous ANOVA approach for equation (2) also compared with the results of a variety of related models where restrictions have been imposed. I will also show the incremental explanatory power associated with year, firm, R&D and CEO effects, as well as interaction effects, respectively.
15
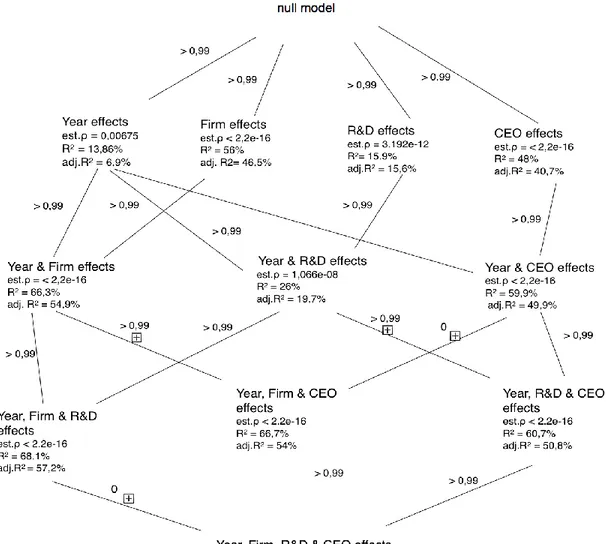
-As I have mentioned, I have illustrated the results of my analysis-of-variance as McGahan and Porter did in their 2002 research. Figure 1 below shows the methodology adapted to my model. The advantages of its use are intuitive, as it describes the neutralization of the order discussed in previous section. I have performed the neutralization firstly with R Type III ad hoc procedure and found no difference in the results associated with the order generated by the default formula.
Figure 1. Analysis of Variance of equation 2
The model at the bottom of the figure corresponds to the fully specified model in equation (2). Looking at the above strings, the model assumes the reduced form. All the entries in Figure 1
16
-correspond to models in which at least one class of effects is restricted to zero. The serial correlation in residuals ( ), and the ordinary and adjusted R2
are shown for each model. Each line is accompanied by the probability at which an F-test rejects the corresponding restriction. In restricted models, the rate of serial correlation is higher because the residuals include the omitted effects. In the full model, the rate of serial correlation could be interpreted as the tendencies of shocks in a specific year to influence returns in the subsequent year.
The model at the bottom of the figure includes year, Firm, R&D, and CEO effects, and generates an R2 of 0.688. The model immediately above excludes the R&D effect, and generates an R2 of 0.667. The difference in the explanatory power of the two models is significant at the 99% level, as indicated by the “ > 0,99 ” that accompanies the restriction. Thus, the analysis shows that R&D effect adds significant explanatory power even in a model that already includes year, firm, and CEO effects.
The first two lines above are associated with restrictions on CEO and R&D effects, respectively. In the first case, the level of the F-test does not reject the restriction because most of the variance in the model is clearly captured by the firm effect (here these two effects could be seen as linear by design). In the second case the F-test rejects at 1% confidence, meaning that the portion of variance explained by the R&D factor is clearly relevant with this order. The third line points to a model in which firmeffects are restricted. Again, the F -test rejects the exclusion with 1% confidence. The next-highest group of lines corresponds to various restrictions in which three of the four effects are into the model. The first group of three lines is associated with restrictions on the model composed by year, firm, and R&D effects. The F-tests cannot reject the restriction on firm and R&D effects as they do provide significant R2 increase. Similarly, the second group of three lines is associated with restrictionson the model that includes year, R&D and CEO effects. The F -tests cannot reject the restriction on R&D effectsand on CEO effects. The reason, again, is the absence of firm in this paradigm.These results provide additional insight for CEO effects.The third group of three lines is especially important because it is associated with restrictions on the model that includes year, firm, and CEO effects and not R&D effects. Firm significantly contribute to explanatory power either when CEO effects are excluded or when they are plugged in. On the contrary, CEO effect does not add significant explanatory power to the model. The third-highest group of lines corresponds to restrictions on models with two sets of effects. CEO
17
-effect, this time, has important explanatory power in the fixed-effects model. The remaining models also reject the exclusion of all effects, except in the cases of linearity by design. Again, these results suggest the relationship between firm and CEO effects. The final group of restrictions at the top of the figure provides information about the explanatory power of each type of effect on its own. When only one of the classes of effects is present, the F-statistic never rejects the restriction to the null model.
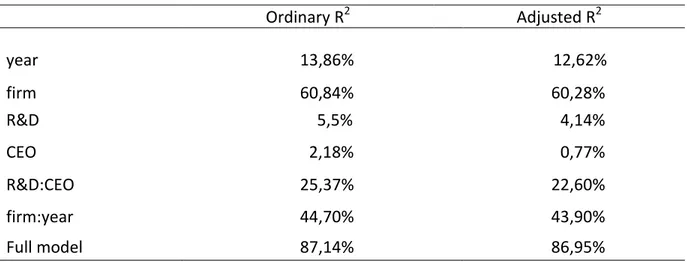
In sum, Figure 1 confirms that all but CEO types of effects— year, firm, R&D — are justified for inclusion in the full model. CEO effect provides explanatory power only when firm effects are moved away from the model. If CEO effects were introduced before firm and R&D effects, then firm and R&D effects would still have had explanatory power, because CEO alone would not have captured all profit differences in the industry and among all companies. Table 2 summarizes the results from Figure 1 about the increment to explanatory power by type of effect. To construct Table 2, I have calculated the increment to the ordinary and adjusted R2 with effects introduced in the following order: year, firm, R&D and CEO. With respect to Figure 1, I have also included the interaction effects. I have followed the convention that takes the year effect as the first one and the corporate-parent as the second (here I have only corporate-parent level). This is such an economic convention that is based on economic characteristics of the variables included.
Table 2. Increment to Explanatory Power by Type of Effect
Ordinary R2 Adjusted R2 year 13,86% 12,62% firm 60,84% 60,28% R&D 5,5% 4,14% CEO 2,18% 0,77% R&D:CEO 25,37% 22,60% firm:year 44,70% 43,90% Full model 87,14% 86,95%
18
-The above results have been obtained with the “partialR2” function in R. Note that the increment in model of year effects is over null model. The increment in model of year and firm effects are over model of year effects. Increment in model of year, firm and R&D effects are over model of year and firm effects and so forth to the increment in full model over null model.
Even if smaller in magnitude, the more appropriate measures to look at are those derived by the adjusted R2 since they have been calculated taking into account the number of observations n and the number of explanatory variables p in the model.
Firm effects are more important than any other type of effect. In order, looking at the explanatory variables, year effects are the most important (in many previous studies these effects were marginal), after firm, while R&D effects are quite important after year. CEO effects are relatively unimportant. Lastly, the interaction terms are both substantially important with the R&D-CEO term being a paramount linkage in this research.
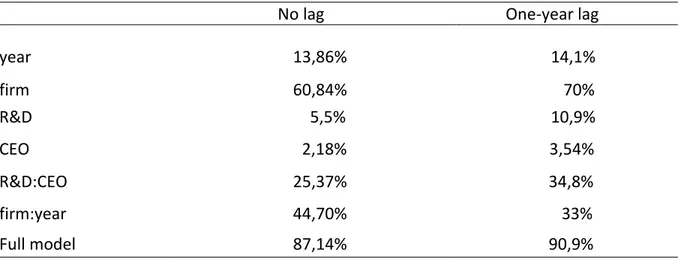
I have also reported the same analysis conducted over a sample on which the time lag effects have been imposed. I have carried out the analysis considering only one level of time leg, precisely at one year. In order to do the analysis with any level of lag, it is necessary to exclude some observations from the data. In fact, if the lag is one year, then the first year of each CEO’s tenure has to be deleted from the sample. Table 3 below shows the results. As in Lieberson and O’Connor’s (1972) study, the CEO effect is larger when the CEO influence is lagged.
Table 3. Increment to explanatory power (incremental R2) for each effect with no time lag and one-year lag
No lag One-year lag
year 13,86% 14,1% firm 60,84% 70% R&D 5,5% 10,9% CEO 2,18% 3,54% R&D:CEO 25,37% 34,8% firm:year 44,70% 33% Full model 87,14% 90,9%
19
-As shown in Table 3, one-year lag results in a larger CEO effect. Considering the adjusted R2, this estimate increases from 0,77 to 1,82 percent, a more considerable impact than before but still too restricted to be considered an imperative effect. The interaction term R&D-CEO shows an increment as well, from 25,37 to 34,80 percent, meaning that, as one would expect, when CEO effect is postponed in time, the effects that this variable produces - along with its managerial instruments - are amplified accordingly. As in previous table, the company effect accounts for the most variance(between 60,8% and 70%).Year effects account for substantial variance (13,8-14%) and R&D accounts for 5,5-10,9 percent of the variance.
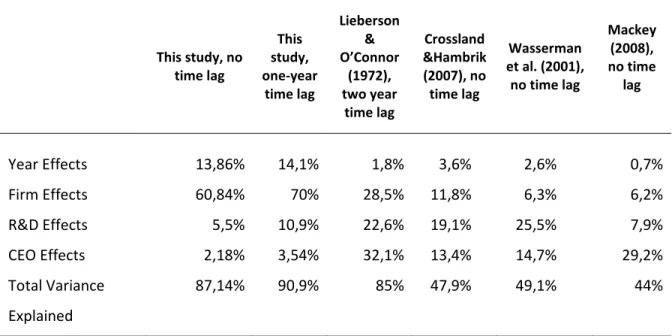
Finally, Table 4 illustrates my results compared with those of previous studies concerning the same class of effects and, in particular, the CEO effect.
Table 4. Comparison of results with previous studies
This study, no time lag This study, one-year time lag Lieberson & O’Connor (1972), two year time lag Crossland &Hambrik (2007), no time lag Wasserman et al. (2001), no time lag Mackey (2008), no time lag Year Effects 13,86% 14,1% 1,8% 3,6% 2,6% 0,7% Firm Effects 60,84% 70% 28,5% 11,8% 6,3% 6,2% R&D Effects 5,5% 10,9% 22,6% 19,1% 25,5% 7,9% CEO Effects 2,18% 3,54% 32,1% 13,4% 14,7% 29,2% Total Variance Explained 87,14% 90,9% 85% 47,9% 49,1% 44%
Source: M. Fitza 2013, Strategic Management Journal. Personal re-elaboration
As illustrated, my CEO results are somewhat negligible with respect to past studies that found, instead, considerable effects. My study is not directly comparable to them though. My model comprises management capabilities effects and does not include industry effects. The R&D effects are found in the Hadner-Helfat research which I have often cited in this paper.
20
-This element is paramount as it demonstrates how important strategic choices are for the organization but do not consent for direct comparison among the models above reported.
5. DISCUSSION
In short, the empirical analysis conducted in this paper suggests that firm leaders account for 0,77% of the variance in corporate profitability. These results indicate that CEOs, taken individually, in this industry context, appear to have an insignificant influence on corporate-level performance. CEO effects of 0,77 per cent are clearly different than most of the prior cited empirical studies of leadership effects. In sum, the results here presented show the impossibility for CEOs to appropriate economic rents. I want to stress that CEOs, taken
individually – that is the person of the CEO - cannot impact firm’s performance.
As I have pointed out, CEOs’ results may be influenced by a number of data sample characteristics. For example, the fact that a CEO has moved from a different industry matters as well as a move from a different company within the same industry. In my sample there are only CEOs who have moved, at least once, from an existing company of the same industry. In a parallel research, I have performed the same statistical analysis on the same dataset but including CEOs who had never moved from a company to another. I have found significant succession effects. In particular, the fact that a CEO had been in more than one company proved to be statistically significant on firm’s performance. Furthermore, the ICT environment consists of a number of different external and internal variables that can impact firm’s achievements. That could be another reason for muted or even not existent CEO effects.
In the ICT context firm performance metrics might not always reflect the true value created by a strategic choice if the value is appropriated by an individual CEO and not by the organization members as a whole. CEOs influence organizational outcomes and vice versa. My findings proved to be consistent with a branch of past literature and useful for future research too. In fact, the interaction term between CEO and R&D explains 22,60% of the variance in profitability, implicitly saying that CEOs do matter in reality but they have to be
21
-conceptualized in the organizational context. They deliver critical results for the firm through the cooperation of the entire corporate system. This shows why the linkage with the R&D variable is so powerful; R&D benefits are directly accountable to corporate key roles.
In other words, it is not the person of the CEO for his/her own sake who makes any difference on firm’s performance but he or she, using proper managerial tools (strategies), along with all the other active organization participants. This is not new to business administration theorists and it is totally reinforced in this study.
6. CONCLUSIONS
My analysis contributes to the study of competitive heterogeneity by measuring the effect of specific corporate-level managerial decisions, driven by the so called dynamic managerial capabilities, on the variance of firm’s performance. I have also estimated the effect provoked by CEOs in charge for making such decisions. Despite the strong results in favor of CEO effects displayed by earlier studies, I find here the CEO to be negligible, while management actions seem to explain much of the performance’s variance. I have also included the interaction term between CEO and management actions proxy into the model. Interestingly, the interaction term effect does assume significant values and this brings new insights to current research.
Taking Adner-Helfat paper as a yardstick, more than restating the importance of managerial decisions on firm performance, I have tried to see whether the person of the CEO, per se, would have generated the same statistical results. The answer is negative, in the sense that CEOs do not show a comparable portion of variance explained like the R&D variable.
My findings clearly leave room for future research opportunities. New insights reside in exploring new data. For instance, comparable data on the accounting profits of firms in other parts of the world would shed light on questions about the relationships between the national economic environment and industrial performance.
In this study I have provided results on profitability of privately held firms and this may constitute an important contribution in making the entire research body more representative of
22
-the whole economy. Opportunities may also lie in exploring additional measures of firm performance, including stock-market return and market share. Other approaches for analysis could be explored too. One would be to identify cross-sectional relationships between the industry, corporate-parent, and business-specific effects. Additional research could be also needed on the inter-temporal relationships incorporated in effects. For instance, both industry and business-specific effects derive by interaction in the strategies of rivals over time. That is to say that the entry by diversified firms affects the evolution of a target industry. In the same way, diversifying firms may be attracted to particular kinds of industries. Decomposition of variance cannot address these issues because models would be over-specified if interaction terms were included for industry-year, corporate-parent-year, and business-specific–year effects. However, further research on the interaction of effects over time would bring new insights to the competitive process framework. Here, I have conducted similar analyses that proved to be critical with that respect.
One of the main questions raised by recent studies is whether results are robust to analytical method. Literature’s findings are generally robust. These findings, directly reconcilable to mine, suggest that industry, corporate-parent, and business-specific influences are all important. New approaches should be needed now to understand how industry, corporate-parent and business-specific influences interact.
To conclude, I argue that top leaders formulate a collective purpose that practically binds them in the organization with all the other active participants. This is not a new topic to this theme. Selznick (1957) described how top leaders infuse values within an organization; Schein (1992) argued that top leaders help create an organization’s culture. Again, Tichy and Cohen (1997) argued for the crucial role of top managers in deciding an organization’s course of action with respect to technical and environmental change (Woodward, 1965; Lawrence and Lorsch, 1967; Thompson, 1967). What these studies teach is that leadership effects are thought to be leveraged by an organization, resulting in substantial impact on a firm’s performance, and this suggestion is restated here and supported by statistical results.
23
-Acknowledgements
I thank my Professor Alessandro Marino for his helpful and developmental review.
In addition, I am grateful to Giancarlo Ferrara for programming assistance and for providing valuable input at different stages of the development of this research.
All remaining errors are my own.
References
- Does Corporate Strategy matter?, Helfat, E.H./ Strategic Management Journal (2001) - The relative influence of industry and corporation on business segment performance: an alternative estimate, Brush T, Bromiley T. /Strategic ManagementJournal (1999)
- Markets vs management: what 'drives' profitability? Jaime A. Roquebert, Robert L. Phillips
and Peter A. Westfall / Strategic Management JournaL,Vol. 17, 653-664 (1996)
- What does a small corporate effect mean? A variance components simulation of corporate and business effects, Thomas H. Brush and Philip Bromiley /Strategic ManagementJournal,
Vol. 18, 825–835 (1997)
- Corporate effects and dynamic managerial capabilities, Ron Adner and Constance E. Helfat/
Strategic Management Journal, 24: 1011–1025 (2003)
- Corporate and industry effects on business unit competitive position, Sea-Jin Chang and
Harbir Singh/Strategic Management Journal, 21: 739–752 (2000)
- Determinants of firm performance: the relative importance of economic and organizational factors, Gary S. Hansen / Strategic Management Journal, Vol. 10, 3 9 9 4 1(1989)
- How much does industry matter?, Richard P. Rumelt /Strategic Management Journal, Vol.
12, 167-185 (I 991)
24
-- Introducing ANOVA and ANCOVA: a GLM approach, Andrew Rutherford (2001)
- Research notes and commentaries / The CEO performance effect: statistical issues and a complex fit perspective, Daniela P. Blettner, Fernando R. Chaddad and Richard A. Bettis/
Strategic Management Journal, Vol. 33: 986–999 (2012)
- Firms and industry effects within strategic management: an empirical examination, Alfredo
J. Mauri and Max P. Michaels / Strategic Management Journal, Vol. 19,211-219 (1998)
- The use of variance decomposition in the investigation of CEO effects: how large must the CEO effect be to rule out chance?, Markus A. Fitza /Strategic Management Journal (2013)
- How much do CEOS influence firm performance--really?, Alison Mackey
- Analysis of variance and covariance: subprograms / ANOVA and ONEWAY, Jae-On Kim and Frank J. Kohout
- Do markets differ much?, Richard Schmalensee/ The American Economic Review, Vol. 75,
No. 3 (Jun., 1985), pp. 341-351, American Economic Association
- What do we know about variance in accounting profitability?, Anita M. McGahan and
Michael E. Porter/ Management Science, Vol. 48, No. 7, (July 2002)
- The performance of U.S. corporations: 1981-1994, McGahan Anita M. (1999a) / Indust. Econom.67(4)
- How much does industry matter, really?, Anita M. McGahan and Michael E. Porter / Strategic Management Journal, Vol. 18 pag. 15-30 (1997a)
- How much does industry matter, really?, Anita M. McGahan and Michael E. Porter /
Strategic Management Journal, Vol. 18 (1997b)
Websites
http://www.findthebest.com http://www.forbes.com
25
-APPENDICES
26 -APPENDIX A CEO ID Safra A. Catz 1 Mark Hurd 2 Margaret C. Whitman 3 Jason Stern 4 John T. Chambers 5 Simon B. Moss 6 Bob Kirk 7 Andrew Miller 8 Gary R. Weis 9 Itzik Weinstein 10 Samuel M. Inman 11 Dominic P. Orr 12 BamiBastani 13 Henry B. Schacht 14 Edward J. Zander 15 George M. C. Fisher 16 Sanjay Jha 17 Antonio M. Perez 18 Mr. Hock E. Tan 19 Mr. J. Michael Lawrie 20 J. Edward Coleman 21 Barry J. Glick 22 John S. Riccitiello 23 Robert A. Altman 24 Carl J. Yankowski 25 Danny J. Windham 26 Philip M. Pead 27 Paul Maritz 28 Oscar Rodriguez 29 John S. Chen 30 Michael P. Gregoire 31 Enrique T. Salem 32 William Nuti 33 Daniel R. Hesse 34 Joseph M. Tucci 35 Rory Read 36 Ivan Seidenberg 37