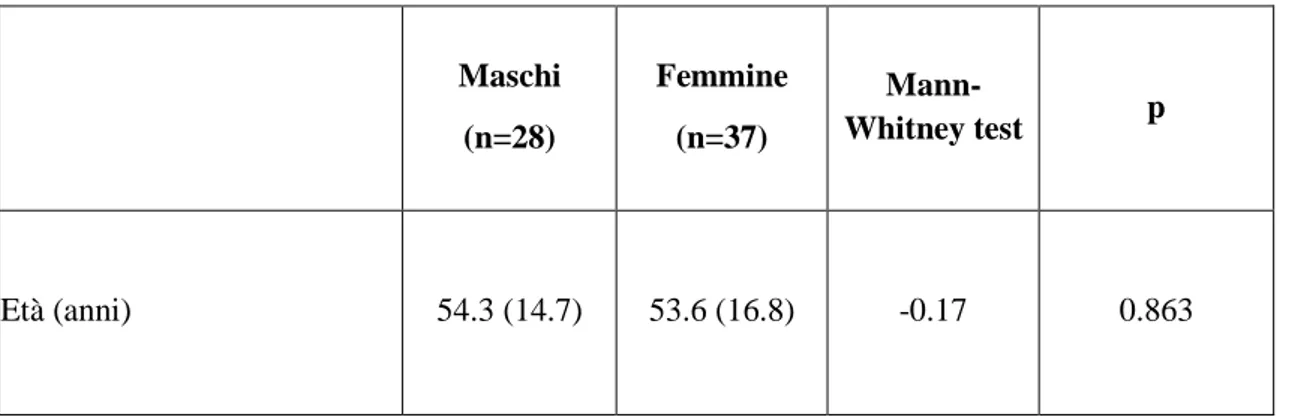
Tabella 1. Età media nei soggetti con PTSD. I dati sono presentati come media (SD) o come frequenza (%).
.
Tabella 2. Caratteristiche socio-demografiche dei 42 soggetti con PTSD. I dati sono presentati come media (SD) o come frequenza (%). Maschi (n=28) Femmine (n=37) Mann-Whitney test p Età (anni) 54.3 (14.7) 53.6 (16.8) -0.17 0.863 Maschi (n=18) Femmine (n=24) Mann-Whitney test or Chi-square test p Stato Civile, N(%) Celibe/nubile Coniugato/a Separato/a Vedovo/a 3 (10.7) 19 (67.9) 4 (14.3) 2 (7.1) 6 (16.2) 22 (59.5) 6 (16.2) 3 (8.1) 0.585 0.900 Scolarità, N(%)
Basso livello di istruzione Alto livello di istruzione
20 (71.4) 8 (28.6)
23 (62.2) 14 (37.8)
0.611 0.434
Familiarità positiva per disturbi psichiatrici, N(%)
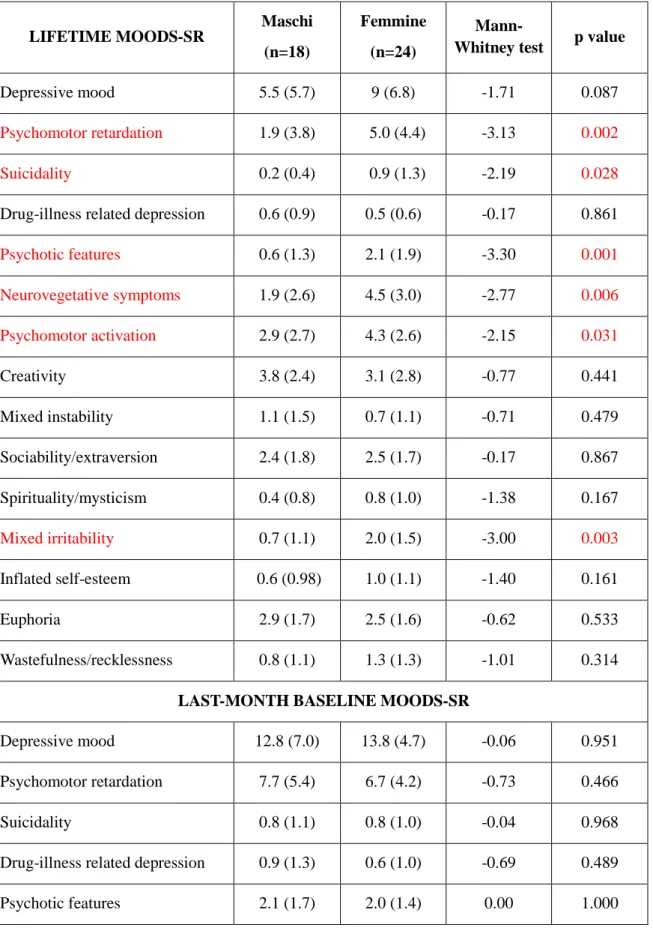
Tabella 3. Caratteristiche psicometriche dei 42 soggetti con PTSD. I dati sono presentati come media(SD). LIFETIME MOODS-SR Maschi (n=18) Femmine (n=24)
Mann-Whitney test p value
Depressive mood 5.5 (5.7) 9 (6.8) -1.71 0.087
Psychomotor retardation 1.9 (3.8) 5.0 (4.4) -3.13 0.002 Suicidality 0.2 (0.4) 0.9 (1.3) -2.19 0.028 Drug-illness related depression 0.6 (0.9) 0.5 (0.6) -0.17 0.861 Psychotic features 0.6 (1.3) 2.1 (1.9) -3.30 0.001 Neurovegetative symptoms 1.9 (2.6) 4.5 (3.0) -2.77 0.006 Psychomotor activation 2.9 (2.7) 4.3 (2.6) -2.15 0.031 Creativity 3.8 (2.4) 3.1 (2.8) -0.77 0.441 Mixed instability 1.1 (1.5) 0.7 (1.1) -0.71 0.479 Sociability/extraversion 2.4 (1.8) 2.5 (1.7) -0.17 0.867 Spirituality/mysticism 0.4 (0.8) 0.8 (1.0) -1.38 0.167 Mixed irritability 0.7 (1.1) 2.0 (1.5) -3.00 0.003 Inflated self-esteem 0.6 (0.98) 1.0 (1.1) -1.40 0.161 Euphoria 2.9 (1.7) 2.5 (1.6) -0.62 0.533 Wastefulness/recklessness 0.8 (1.1) 1.3 (1.3) -1.01 0.314 LAST-MONTH BASELINE MOODS-SR
Depressive mood 12.8 (7.0) 13.8 (4.7) -0.06 0.951
Psychomotor retardation 7.7 (5.4) 6.7 (4.2) -0.73 0.466
Suicidality 0.8 (1.1) 0.8 (1.0) -0.04 0.968
Neurovegetative symptoms 5.7 (2.8) 5.9 (1.8) -0.76 0.448 Psychomotor activation 3.1 (2.9) 2.9 (2.3) -0.13 0.900 Creativity 1.3 (1.7) 0.8 (1.5) -1.35 0.177 Mixed instability 0.4 (0.7) 0.1 (0.3) -1.40 0.161 Sociability/extraversion 0.6 (1.1) 0.8 (1.0) -0.94 0.346 Spirituality/mysticism 0.4 (0.8) 0.2 (0.6) -1.27 0.203 Mixed irritability 2.5 (2.2) 2.7 (1.7) -0.56 0.573 Inflated self-esteem 1.2 (1.7) 0.7 (1.1) -1.30 0.195 Euphoria 0.3 (0.7) 0.5 (0.9) -0.88 0.377 Wastefulness/recklessness 0.4 (0.8) 0.7 (1.0) -1.78 0.075 TALS-SR Loss events 4.4 (2.1) 5.1 (1.6) -1.37 0.170 Grief reactions 13.1 (6.1) 15.1 (5.6) -0.99 0.324
Potentially traumatic events 4.5 (2.9) 5.3 (3.1) -1.00 0.316 Reaction to losses or upsetting
events 11.2 (2.7) 11.0 (3.7) -0.06 0.953
Re-experiencing 6.1 (1.9) 6.0 (1.7) -.031 0.760
Avoidance and numbing 6.0 (2.8) 6.5 (3.0) -0.40 0.692
Maladaptive coping 2.3 (1.7) 1.5 (1.1) -1.54 0.125 Arousal 3.5 (1.4) 3.8 (1.1) -0.60 0.546 Personal characteristics/risk factors 1.7 (1.2) 1.6 (1.1) -0.01 0.990 IES Total score 42.2 (16.4) 44.4 (20.4) -0.60 0.546 Intrusion domain 23.8 (8.9) 24.0 (10.9) -0.38 0.702 Avoidance domain 18.3 (8.9) 20.5 (11.8) -0.60 0.546
Tabella 3. Comorbidità di Asse I lifetime nel campione di soggetti con PTSD, SCID I (n=66).
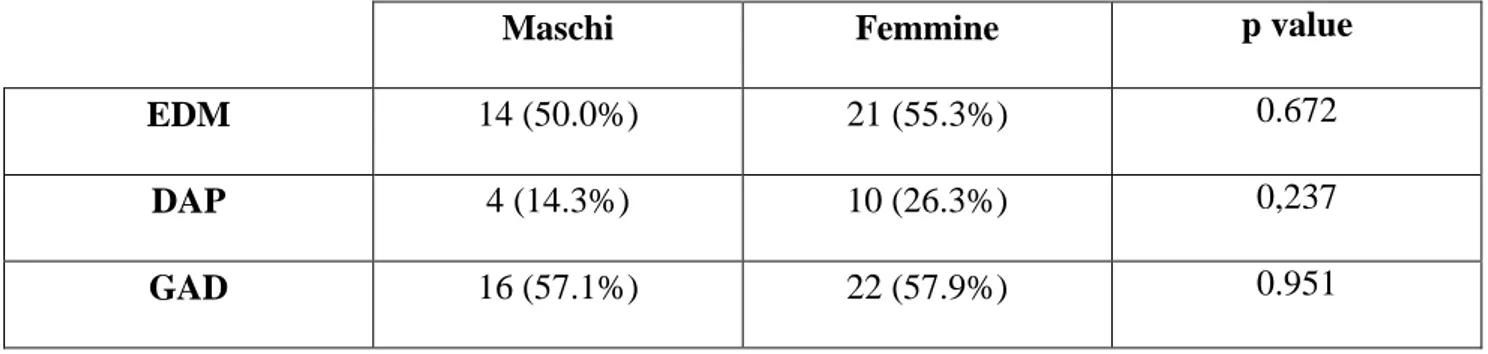
Tabella 3.2 Comorbidità di Asse I ultimo mese nel campione di soggetti con PTSD (n=42)
Maschi Femmine p value
EDM 14 (50.0%) 21 (55.3%) 0.672
DAP 4 (14.3%) 10 (26.3%) 0,237
GAD 16 (57.1%) 22 (57.9%) 0.951
Maschi Femmine p value
EDM 10 (55.6%) 13 (54.2%) 0.929
DAP 3 (16.7.%) 8 (33.3%) 0.224