SUPPLEMENTARY INFO
Enhanced N
2
fixation activity by converting Ti
3
C
2
MXenes
nanosheets to nanoribbons
Hua Wei
[a, c], #, Qian Jiang
[b], #,
Claudio Ampelli
[a],
Shiming Chen
[b], Siglinda Perathoner
[a], Yuefeng Liu
[b],* and Gabriele Centi
[a],*
[a] Dr. H. Wei, prof. C. Ampelli, prof. S. Perathoner, prof. G. Centi Dept.s ChimBioFarAm and MIFT,
V.le F. Stagno D’Alcontres 31, 98166 Messina, Italy. E-mail: [email protected]
[b] Dr. Q. Jiang, Dr. S. Chen, prof. Y. Liu
Dalian National Laboratory for Clean Energy, Dalian Institute of Chemical Physics, Chinese Academy of Sciences, 457 Zhongshan Road, Dalian 116023, China.
E-mail: [email protected] [c] Dr. H. Wei
University of Lyon, Institut de Chimie de Lyon, UMR 5265 – CNRS – Université Lyon 1, ESCPE Lyon, Laboratoire de Chimie, Catalyse, Polymères et Procédés (C2P2), Equipe Chimie Organométallique de Surface, Villeurbanne, France
[#] These authors contributed equally to this work.
Supplementary Experimental Section
Electrocatalytic reactor
The electrocatalytic cell for the direct NH3 synthesis from N2 and
H2O operates at ambient temperature/ pressure.[1-3] A solid
membrane-electrode assembly separates the gas and liquid hemicells, where the reduction of N2 to ammonia (cathodic part)
and the water oxidation (anodic part) reactions occur, respectively.
Figure S1 Schematic view of the improved design in the three-phase reactor
for electrochemical ammonia synthesis. Gas chamber: cathode; working electrode is fully contact with N2; N2 reduced to ammonia. Electrode size about
2 cm2. Liquid chamber: Anode; Pt as counter electrode; Water decomposition
reaction. The reactant N2 was continuously fed (20 mL min-1) and the flow
coming out from the electrocatalytic reactor outlet was sent to a liquid absorber containing a 0.001 M H2SO4 solution. Electrolyte: 0.25 M Li2SO4 0.5M H2SO4.
The anodic section contains a liquid electrolyte (0.5 M KOH) for water electrolysis to generate the protons and electrons. The protons and electrons were used in the cathodic zone for the electrocatalytic conversion of N2 to NH3.
This electrocatalytic reactor has a compact-design[4,5] and
operates without the presence of a liquid electrolyte in the ammonia synthesis hemicell, differently from most of the other literature results. Due to its configuration, allowing continuous
operations with a not energy-intensive continuous recovery of the ammonia formed, this type of reactor is indicated as gas-phase (or electrolyteless) electrocatalytic flow reactor. A main difference with respect to conventional electrochemical reactors, where the electrode is in direct contact with a liquid electrolyte, is that the gas reactant (N2) could have a higher coverage on the
electrocatalytic nanoparticles, being not limited from solubility in the electrolyte and double-charge diffusion limitations. For the case of CO2, we demonstrated that this is an important aspect.[6]
Calculations
Ammonia formation rates were calculated using the following equation:
𝑟𝑁𝐻3(𝜇𝑔 ∙ 𝑚𝑔𝑒𝐶𝐴𝑇
−1 ∙ ℎ−1) = 𝑥(𝑝𝑝𝑚) ∙ 𝑉(𝑙) 𝑀𝐶𝐴𝑇 (𝑚𝑔) ∙ 𝑡(ℎ) Where:
- 𝑟𝑁𝐻3: ammonia formation rate in 𝜇𝑔 ∙ 𝑚𝑔𝐶𝐴𝑇−1 ∙ ℎ−1.
- x (ppm): ammonia concentration in the detection solution in ppm (mg/L)
- V (l): is volume of solution in liter.
- MeCAT(mg): the amount of the electrocatalyst (mg) in the
electrode
- t (h): the reaction time in hours.
Faraday efficiency of ammonia was determined using the following equations 𝐹𝐸𝑁𝐻3(%) = 3 × 𝑟𝑁𝐻3∗ (𝑚𝑜𝑙 ∙ 𝑐𝑚−2∙ 𝑠−1) × 𝑡(𝑠) × 𝑆(𝑐𝑚−2) × 𝐹 𝐼(𝐴) × 𝑡(𝑠) × 100% Where: - F: Faraday constant,
- I(A): the average of current during the reaction, - 𝑃𝐻2(%): is the percentage of H2 in the total gas flow. - 𝐹𝑁2(𝑚𝐿/𝑚𝑖𝑛): the flow of N2, 𝐹𝑁2(𝑚𝐿/𝑚𝑖𝑛)=10 𝑚𝐿/𝑚𝑖𝑛 in
the study.
- Vm: the molar volume in the standard condition (Vm = 22.4
L/mol).
© 2020. This manuscript version is made available under the CC-BY-NC-ND 4.0 license http://creativecommons.org/licenses/by-nc-nd/4.0/
https://chemistry-europe.onlinelibrary.wiley.com/doi/full/10.1002/cssc.202001719
2
Ammonia detection
The amount of ammonia formed is monitored by a highly-sensitive spectrophotometry method, which resulted preferable with respect to the alternative tested methods of ammonia detection, such as by using ammonium ion selective electrodes or using NMR.[7-9]In control experiments, we have compared the results
obtained by the spectrophotometric method described below and those with NMR. Due to a discontinuous access to NMR equipment, differently from the spectrophotometric method which allow immediate analysis during the experiments, we found less reliable the NMR method, although widely used by other authors.[7-9]On the other hand, the spectrophotometric method is
the established method to analyze ammonium ions in environmental analysis methods.
The method used for low ammonia concentration detection was adapted from the standard methods for analyzing ammonia in wastewater. Ammonia concentration was detected by spectrophotometry with salicylic acid, which gives better sensibility and reproducibility with respect to the alternative tested methods, such as ion selective electrode analysis (Orion™ High-Performance Ammonia Electrode 9512HPBNWP) or ammonia detection by NRM. Reproducibility tests indicate an average error of less than ±5% in the estimation of the ammonia formation rate. Details of the spectrophotometry measurement with salicylic acid are given below. The method shows analogies with that used by Guo et al.[10] Reproducibility tests indicate an
average error of less than ±5% in the estimation of the ammonia formation rate.
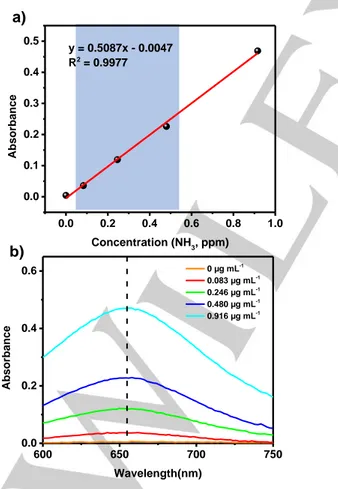
Figure S2 (a) Calibration curve used for estimation of NH3 (b) UV-Vis absorption
spectra of indophenol assays with NH3 after incubated for 1 h at room
temperature.
Regents used:
1. Coloring solution: sodium salicylate (0.4 M) and sodium hydroxide (0.32 M);
2. Oxidation solution: sodium hypochlorite (ρCl=4~4.9) and sodium hydroxide (0.75M);
3. Catalyst solution: 0.1g Na2[Fe(CN)5NO]•2H2O diluted to
10ml with deionized water. 4. Standard ammonium solution. Procedure:
4 mL of sample was taken. Then 50 µL of oxidizing solution, 500 µL of coloring solution and 50 µL of catalyst solution were added respectively to the sample solution. Absorbance measurements were performed after 1 hr at =690 nm. The calibration curve used for estimation of NH3 and the UV-Vis absorption spectra of
indophenol assays with NH3 after incubated for 1 h at room
temperature are reported in Figures S2a and S2b, respectively.
Procedure to analyze eventual formation of hydrazine
A check for the possibility to form hydrazine (NH2NH2) was made
using the procedure indicated by Qin et al.[11] 2 g of
p-dimethylaminobenzaldehyde and 10 mL of hydrochloric acid (37%) in 100 mL of anhydrous ethanol solution are used to prepare the color reagent, 3 mL of which are with 3 mL of the liquid in the cold trap used to collect ammonia from the gas stream outlet of the gas-phase electrocatalytic reactor. After 10 min, the absorbance of 465 nm was analysed to determine whether N2H4
was produced. No indication of the formation of hydrazine was obtained under our experimental conditions.
Electrocatalytic tests
The electrocatalysts (about 0.2 mg/cm2) is dispersed in ethanol
containing a 10% Nafion solution (ultrasonic mixing for 90 min), up to obtain an homogenous mixture which is deposited by spray drying onto a gas-diffusion layer (GDL) which is then hot pressed to a Nafion membrane. The Nafion membrane was purified before the use. Size of the electrodes was 2 cm2.
The electrocatalyst is located between two GDLs, one of which in contact with flowing N2, and the other joint with the Nafion
membrane. The intermediate GDL between the electrocatalyst and the Nafion is used to limit ammonia cross-over.[2] Before the
tests, electrochemical CV cycles were used to reach the steady state of the electrode.
Ultrapure N2 gas (99.9999% purity, 20 mL/min) was used in
the tests, with further purification steps by passage through alkaline and acidic trap to remove possible sources of N contaminations.[12] The purification level and the absence of
contaminants such as NOx was monitored by mass quadrupole and gas chromatography.
Ammonia formation and the eventual formation of hydrazine were determined as described above. H2 formation was
monitored by gas-chromatography.
Control experiments
A series of control tests were made to assure that ammonia form from N2 feed rather than from other N sources and to verify that
ammonia derives from an electrocatalytic process.
A verification was made that NOx was not present in the N2
pure feed used in the present tests, and that contaminations by NH3 were also not present in the feed section of the
600 650 700 750 0.0 0.2 0.4 0.6 0 µg mL-1 0.083 µg mL-1 0.246 µg mL-1 0.480 µg mL-1 0.916 µg mL-1 Abs orbanc e Wavelength(nm) 0.0 0.2 0.4 0.6 0.8 1.0 0.0 0.1 0.2 0.3 0.4 0.5 y = 0.5087x - 0.0047 R2 = 0.9977 Ab so rban ce Concentration (NH3, ppm)
a)
b)
SUPPLEMENTARY INFO
3 electrocatalytic apparatus. These control experiments were further supported by switching tests with Ar feed.
In these switching-feed tests, the procedure for the electrocatalytic tests is made as described before, but only Ar is feed rather than N2. In these conditions, no ammonia was
detected. After 2h, the feed is switched to N2 and the catalytic
behavior monitored with time on stream. The results are reported in Figure S3. It is shown clearly that i) ammonia forms only when gaseous N2 is feed and thus ammonia do not derive from
contaminations by other N-compounds present in the reactor or its components, and ii) after switching to N2 there is a stable
ammonia formation for at least 2h on tests. Control tests with labelled 15N
2 were also made to verify
formation of ammonia from gas N2,[13,14]monitoring 15NH3 by NMR,
but these tests do not provided different results. We consider preferable the procedure indicated in Figure S3, because allow a procedure protocol which can be applied to all tests.
Further control experiments regarded tests feeding N2 and H2,
but without application of a potential to the electrocatalyst, to confirm that i) ammonia do not derive from the catalytic reduction of contaminant N-species and ii) the behaviour observed derives from the electrocatalytic reduction rather than from the catalytic reduction in presence of in-situ generated H2.
Figure S3 Experimental protocol for NRR tests: after the initial phase of
pre-treatment to stabilize the electrode, the first two hours of electrocatalytic tests are made by applying the chosen potential (-0.5 V vs RHE), but feeding Ar; then , the feed is switched to N2, maintaining constant the applied potential and
ammonia formation is monitored for at least 3h; after these tests, the potential is decreased to zero, and a feed of N2 + 5% H2 is feed to verify the catalytic
(rather than electrocatalytic) activity in ammonia formation.
Supplementary Characterization Data
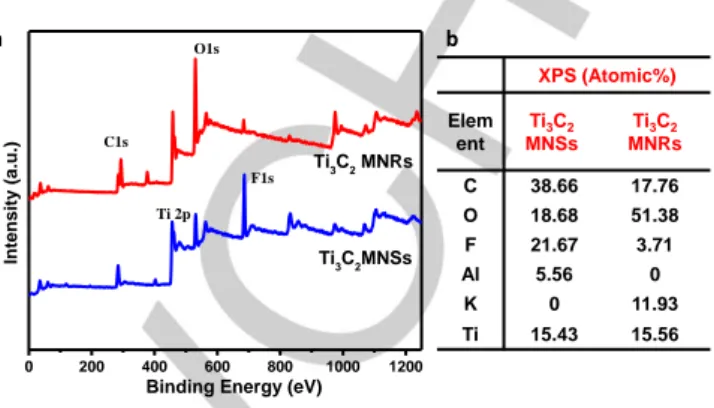
The full XPS spectrum with corresponding elemental content analysis confirms the existence of C, K, O and F in Ti3C2 MNRs
(Figure S4).
After the treatment by KOH, the intensity of the XPS Ti-F peaks decreased markedly (Figure S4), while the contents of -OH on the surface increases significantly, indicating that a large amount of -F terminal groups were replaced by hydroxyl groups and consequently the formation of O-terminated Ti3C2 MNRs.
EDX analysis in SEM characterization of the Ti3C2 MNSs and
Ti3C2 MNR samples confirm this indication (Figure S5). The
comparison of the elemental composition by XPS and EDX (SEM)
show that after the treatment by KOH, the Ti/C ratio increases owing to the carbon corrosion by KOH. The comparison of Ti/C ratio measured by XPS and SEM indicates a preferential surface carbon removal by the KOH treatment. The EDX comparison of MAX phase (Ti3AlC2) and Ti3C2 MNSs (Table S1) indicates also
that the oxygen content is similar in these two samples.
Figure S4 (a) Full XPS and (b) elemental content analysis of Ti3C2 MNSs and
(b) Ti3C2 MNR.
Figure S5 SEM image and EDX analysis of the marked zone in (a) Ti3C2 MNSs
and (b) Ti3C2 MNR.
Table S1 Comparison of the EDX elemental composition (atomic % content) of
Ti3AlC2 (MAX phase) and Ti3C2 MNS.
Element (K line) Ti3AlC2 (MAX) Ti3C2 MNS. C 42.15 37.92 O 16.88 15.03 F 0.64 22.45 Al 10.02 1.63 K 0.00 0.01 Ti 30.32 22.95 Element Atomic% C K 37.92 O K 15.03 F K 22.45 Al K 1.63 K K 0.01 Ti K 22.95
a
Element Atomic% C K 14.86 O K 54.13 F K 5.34 Al K 2.00 K K 4.37 Ti K 19.31b
0 200 400 600 800 1000 1200 Ti 2p F1s O1s C1s Ti3C2 MNRs Ti3C2MNSs Intens ity ( a.u.)Binding Energy (eV)
a XPS (Atomic%) Elem ent Ti3C2 MNSs Ti3C2 MNRs C 38.66 17.76 O 18.68 51.38 F 21.67 3.71 Al 5.56 0 K 0 11.93 Ti 15.43 15.56 b
4
Cyclic Voltammetry (CV) tests
CV tests were initially made with the MXene nano ribbon cathode to analyze the range to explore for the electrocatalytic tests. Figure S6a reports the CV curves obtained in the full range (from -1V to +1 V vs. RHE, with Figure S6b reporting an expansion in the 1V to +0.2 V vs. RHE.
Apart from a slight change in the first cycle, the CV curves are very well coincident, indicating the stability of performances during consecutive cycles.
Based on these tests, three values of potential to apply for the electrocatalytic tests could be identified: -0.2V, which corresponds to the value close to onset potential, -0.5 V corresponding to the maximum of current of the first reduction peaks, and -0.8V corresponding to the onset of a new reduction.
Figure S6 Cyclic voltammetry (CV) tests on Ti3C2 MNR. (a) full range from -1V
to +1 V vs. RHE. (b) expansion in the 1V to +0.2 V vs. RHE.
Initial Tests and Stability
Based on CV results (Figure S6), initial electrocatalytic tests were made to evaluate the effect of the applied potential versus Ag AgCl in the range from -0.2V to -0.8V vs. RHE. These initial tests were performed on Ti3C2 MNRs. Results at intermediate voltages
between those tested to not add relevant additional information. Note, in fact, that the scope of this work is not to obtain the maximum possible performances, but to understand better the effect of changing from 2D to 3D like nanostructure.
The highest NH3 yield was obtained at −0.5 V vs RHE
(Figure S7). Current density at this voltage is about -1.5 A and remain stable for at least 3h of continuous tests (Figure S8). At
more negative voltage (-0.8 V), the current density instead decreases from the initial -3.5 A value to about -4.5 A (after 2h), indicating thus an in-situ transformation during the electrocatalytic tests. At a voltage of -0.2 V, the current density (about -0.5 A) is instead low, indicating low catalytic activity. Further tests were thus made at -0.5 V vs RHE. Data reported refer to the behavior determined after 3h of continuous tests.
Figure S7 NH3 formation rate and Faradaic efficiency of Ti3C2 MNRs at different
potentials vs. Ag/AgCl.
Figure S8 Time-dependent current density curves for Ti3C2 MNRs at different
potentials vs. Ag/AgCl.
Characterization before and after the NRR
catalytic tests
SEM characterization of the most active Ti3C2 MNRs sample,
fresh and after 2h and 10h of catalytic tests are reported in Figures S9a, S9b and S9c respectively. There is no evidence of morphological changes with the time on stream of the nanoribbons, with respect to the fresh sample. These data are in well agreement with also CV experiments during extended cycling tests.
XPS Ti2p spectra of fresh and used Ti3C2 MNRs (Figure S10)
also do not evidence changes in the surface characteristics of this electrocatalyst before and after the catalytic tests, confirming the stability during NRR electrocatalytic tests.
-1.0 -0.8 -0.6 -0.4 -0.2 0.0 0.2 0.4 0.6 0.8 1.0 -0.06 -0.05 -0.04 -0.03 -0.02 -0.01 0.00 0.01 Cu rrent ( A) Potential vs. RHE -1.0 -0.8 -0.6 -0.4 -0.2 0.0 0.2 -0.06 -0.05 -0.04 -0.03 -0.02 -0.01 0.00 0.01 Cu rrent ( A) Potential vs. RHE
a
b
SUPPLEMENTARY INFO
5
Figure S9 SEM images of Ti3C2 MNRs fresh (a) and after 2h (b) and 10h (c) of
catalytic tests at a potential of -0.5 V vs. RHE.
Figure S10 XPS spectra (Ti2p region) of Ti3C2 MNRs after extended catalytic
tests (10h) at a potential of -0.5 V vs. RHE.
XRD results also confirm that no structural change occur during the catalytic tests.
Comparison with state-of-the-art literature
results
A comparison with state-of-the-art literature data on NRR by using as electrocatalysts (a) MXenes, (b) composite electrocatalysts based on MXenes, and selected electrocatalysts based on (c) noble metals or (d) transition metal oxides is reported in Table S2.
Table S2 Comparison with state-of-the-art representative electrocatalysts in
NRR. Type of electrocatalysts: (a) MXenes, (b) modified and composite electrocatalysts based on MXenes, selected electrocatalysts based on (c) noble metals or (d) transition metal oxides.
Composition (*) FE (%) NH3 Formation rate (g·h -1·mg cat-1) Potential applied (V) and electrolyte Ref.
(a) Pure MXenes
Ti3C2 MNRs 2.0 14.8 -0.5 vs RHE 0.5 M KOH This work Ti3C2 MNSs 0.7 2.4 Ti3C2Tx nanosheets 2.0 6.5 -0.2 vs RHE 0.05 M H2SO4 15 Ti3C2 nanosheets 1.0 30.3 -0.3 vs RHE 0.1 M HCl 16 OH-rich Ti3C2Tx QDs 13.3 62.9 -0.5 vs RHE 0.1 M HCl 17 OH-surface rich Ti3C2 7.0 1.71 -0.2 vs RHE 0.1 M KOH 18 Ti3C2Tx 1.5 22.4 -0.6 vs RHE 0.1 M HCl 19 Ti3C2Tx nanosheet/CP 9.3 20.4 -0.4 vs RHE 0.1 M HCl 20 HF-Ti3C2Tx nanosheets/CC 6.0 15.0 -0.3 vs RHE 0.1 M HCl 21 F-free Ti3C2Tx nanosheets/CC 9.1 36.9 Ti3C2Tx/CP 3.0 10.2 -0.6 vs RHE 0.1 M HCl 22 Ti3C2Tx MXene / SSM 4.6 2.7 -0.1 vs RHE 0.5 M Li2SO4 23 Mo2CTX MXene 7.0 10.0 -0.3 vs RHE 0.5 M K2SO4 24
(b) Modified and composite MXenes
MXene/ TiFeOx-700 24.4 21.9 -0.2 vs RHE 0.05 M H2SO4 15 1T-MoS2/ Ti3C2 MXene 10.9 39.3 -0.3 vs RHE 0.1 M HCl 16 Ti3C2Tx/ TiO2 (vacancy rich) 3.0 32.0 -0.6 vs RHE 0.1 M HCl 19 TiO2/Ti3C2Tx /CP 8.4 26.3 -0.6 vs RHE 0.1 M HCl 22 Ti3C2Tx MXene / FeOOH 5.8 0.2 -0.1 vs RHE 0.5 M Li2SO4 23
MnO2–Ti3C2Tx 11.9 34.1 -0.5 vs RHE
0.1 M HCl 25
Mn3O4/ MXene
nanosheets 5.5 25.9
-0.5 vs RHE 0.1 M Na2SO4 26
(c) Noble-metal based electrocatalysts
Ru-single atom Mo2CTX MXene 25.8 40.6 -0.3 vs RHE 0.5 M K2SO4 24 Ru/C 12.5 20.0 Au nanoroads 4.0 1.6 -0.2 vs RHE 0.1 M KOH 27 Pd/C 8.2 4.5 -0.1 vs RHE 0.1M PBS 28
Rh nanosheets 0.3 23.9 -0.2 vs RHE 0.1 M KOH 29
α-Au/CeOx-RGO 10.1 8.3 -0.2 vs RHE 0.1 M HCl 30
1 μm
500 nm
1µm
a
b
c
6 (d) Transition metal oxide/sulphide based electrocatalysts
Fe2O3/CNT 3h
activated in situ 17.0 41.6
-0.5 vs RHE
0.5 M KOH 3
TiO2/rGO 3.3 15.1 -0.9 vs RHE
0.1 M Na2SO4 31 amorphous Bi4V2O11/CeO2 10.1 23.2 -0.2 vs RHE 0.1 M HCl 32 Nb2O5 nanofibers 9.3 43.6 -0.6 vs RHE 0.1 M HCl 33 MoO3 nanosheets 0.8 29.4 -0.5 vs RHE 0.1 M HCl 34
MnOx nanowire 11.4 1.5 -0.5 vs RHE
0.1 M Na2SO4 35 Mn3O4 nanocube 3.0 11.6 -0.5 vs RHE 0.1 M Na2SO4 36 N-doped C/ Fe3C 2.7 15.8 -0.4 vs RHE 0.01 M KOH 37 Mo- MnO2 nanoflowers 7.7 36.6 -0.5 vs RHE 0.1 M Na2SO4 38 MoS2/C3N4 17.8 18.5 -0.3 vs RHE - 39 Mo-SnS2 nanosheets (&) 20.8 (-0.4V) 41.3 -0.5 vs RHE 0.5M LiClO4 40 FeMoO4 Nanorods 7.5 45.8 -0.5 vs RHE 0.5 M LiClO4 41 (*) T = F, OH; QDs: Quantum Dots; CP: carbon paper; CC carbon cloth; SSM: stainless steel mesh; PBS: phosphate buffer sulution. (&) with enriched S-vacancies
References
[1] S. Chen, S. Perathoner, C. Ampelli, C. Mebrahtu, D. Su, G. Centi, Angew. Chemie Int. Ed. 2017, 56, 2699.
[2] S. Chen, S. Perathoner, C. Ampelli, C. Mebrahtu, D. Su, G. Centi, ACS Sustainable Chem. & Eng. 2017, 5, 7393.
[3] S. Chen, S. Perathoner, C. Ampelli, H. Wei, S. Abate, B. Zhang, G. Centi, J. Energy Chem., 2020, 49, 22.
[4] S. Perathoner, G. Centi, D. S. Su, ChemSusChem 2016, 9, 345. [5] C. Ampelli, G. Centi, R. Passalacqua, S. Perathoner, Catal. Today 2016,
259, 246
[6] B. C. Marepally, C. Ampelli, C. Genovese, T. Saboo, S. Perathoner, F. M. Wisser, L. Veyre, J. Canivet, E. A. Quadrelli, G. Centi, ChemSusChem
2017, 10, 4442-4446.
[7] R. Y. Hodgetts, A. S. Kiryutin, P. Nichols, H.-L. Du, J. M. Bakker, D. R. Macfarlane, A. N. Simonov, ACS Energy Lett. 2020, 5, 736-741. [8] A. C. Nielander, J. M. McEnaney, J. A. Schwalbe, J. G. Baker, S. J. Blair,
L. Wang, J. G. Pelton, S. Z. Andersen, K. Enemark-Rasmussen, V. Colic, et al. ACS Catal. 2019, 9, 5797-5802.
[9] G. Y. Duan, Y. Ren, Y. Tang, Y, Z, Sun, Y. M. Chen, P. Y. Wan, X. J. Yang, ChemSusCjhem 2020, 13, 88-96
[10] Y. Guo, T. Wang, Q. Yang, X. Li, H. Li, Y. Wang, T. Jiao, Z. Huang, B. Dong, W. Zhang, J. Fan, C. Zhi, ACS Nano 2020, DOI: 10.1021/acsnano.0c04284
[11] B. Qin, Y. Li, Q. Zhang, G. Yang, H. Liang, F. Peng, Nano Energy 2020, 68, 104374
[12] R. Dabundo, M. F. Lehmann, L. Treibergs, C. R. Tobias, M. A. Altabet, P. H. Moisander, J. Granger, PLOS One 2014, 9, e110335.
[13] (a) S.Z., Andersen, V., Čolić, S. Yang, et al. Nature 2019, 570, 504–508. (b) L. F. Greenlee, J. N. Renner, S. L. Foster, ACS Catal. 2018, 8, 7820– 7827.
[14] J. Kibsgaard, J. K. Nørskov, I. Chorkendorff, ACS Energy Lett. 2019, 4, 2986-2988
[15] Y. Guo, T.Wang, Q. Yang, X. Li, H. Li, Y. Wang, T. Jiao, Z. Huang, B. Dong, W. Zhang, Wenjun; J. Fan, C. Zhi, ACS Nano 2020, Ahead of Print. DOI: 10.1021/acsnano.0c04284
[16] X. Xu, B. Sun, Z. Liang, H. Cui, J. Tian, ACS Applied Materials & Interfaces 2020, 12, 26060.
[17] Z. Jin, C. Liu, Z. Liu, J. Han, Y. Fang, Y. Han, Y. Niu, Y. Wu, C. Sun, Y. Xu, Adv. Energy Mater. 2020, 10, 2000797.
[18] J. Xia, S.-Z. Yang, B. Wang, P. Wu, I. Popovs, H. Li, S. Irle, S. Dai, H. Zhu, Nano Energy 2020, 72, 104681.
[19] Y. Fang, Z, Liu, J. Han, Z. Jin, Y. Han, F. Wang, Y. Niu, Y. Wu, Y. Xu, Adv. Energy Mater. 2019, 9, 1803406.
[20] J. Zhao, L. Zhang, X. Xie, X. Li, Y. Yong, Q. Liu, W. Fang, X. Shi, G. Cui, X. Sun, J. Mater. Chem. A 2018, 6, 24031.
[21] T. Li, X. Yan, L. Huang, J. Li, L. Yao, Q. Zhu, W. Wang, W. Abbas, R. Naz, J. Gu, Q. Liu, W. Zhang, D. Zhang, J. Chem. A: Materials for Energy and Sustainability 2019, 7, 14462.
[22] J. Zhang, L. Yang, H. Wang, Z. Zhu, H. Wen, H. Feng, X. Sun, X. Guan, J. Wen, Y. Yao, Inorg. Chem. 2019, 58, 5414.
[23] Y. R. Luo, G. F. Chen, L. Ding, X. Z. Chen, L. X. Ding, H. H. Wang, Joule
2019, 3, 279.
[24] W. Peng, L. Luo, X. Xu, K. Jiang, M. Peng, D. Chen, T.-S. Chan, Y. Tan, Adv. Energy Mater. 2020, Ahead of Print. DOI: 10.1002/aenm.202001364 [25] W. Kong, F. Gong, Q. Zhou, G. Yu, L. Ji, X. Sun, A. M. Asiri, T. Wang, Y. Luo, Y. Xu, J. Mater. Chem. A: Materials for Energy and Sustainability
2019, 7, 18823
[26] C. Wang, X,-D. Zhu, P.-J. Zuo, Chem. Eng. J. 2020, 396, 125163. [27] D. Bao, Q. Zhang, F. Meng, H. Zhong, M. Shi, Y. Zhang, J. Yan, Q. Jiang,
X. Zhang, Adv. Mater. 2017, 29, 1604799
[28] J. Wang, X. Feng, L. Yu, H. Xin, L. Hu, G. Chen, Nature Comm. 2018, 9, 1795.
[29] H.-M. Liu, S.-H. Han, Y. Zhao, Y.-Y. Zhu, X.-L. Tian, J.-H. Zeng, J.-H. Jiang, B. Y. Xia, Y. Chen, J. Materials Chemistry A: Materials for Energy and Sustainability 2018, 6, 3211
[30] S. Li, D. Bao, M. Shi, B. Wulan, J. Yan, Q. Jiang, Adv. Mater. 2017, 29, 1700001.
[31] X. Zhang, Q. Liu, X. Shi, A. M. Asiri, Y. Luo, X. Sun, T. Li, J. Materials Chemistry A: Materials for Energy and Sustainability 2018, 6, 17303 [32] C. Lv, C. Yan, G. Chen, Y. Ding, J. Sun, Y. Zhou, G. Yu, Angew. Chem.,
Int. Ed. 2018, 57, 6073
[33] J. Han, Z. Liu, Y. Ma, G. Cui, F. Xie, F. Wang, Y. Wu, S. Gao, Y. Xu, X. Sun, Nano Energy, 2018, 53, 264
[34] J. Han, X. Ji, X. Ren, G. Cui, L. Li, F. Xie, H. Wang, B. Li, X. Sun, J. Mater. Chem. A, 2018, 6, 12974
[35] L. Zhang, X.-Y. Xie, H. Wang, L. Ji, Y. Zhang, H. Chen, T. Li, Y. Luo, G. Cui, X. Sun, Chem. Commun. 2019, 55, 4627
[36] X. Wu, L. Xia, Y. Wang, W. Lu, Q. Liu, X. Shi, X. Sun, Small 2018, 14, 1803111
[37] L. Cong, Z. Yu, F. Liu, W. Huang, Catal. Sci. Technol. 2019, 9, 1208 [38] K. Chu, Y-p. Liu, Y-b. Li, Y-l. Guo, Y. Tian, H. Zhang, Appl. Catal. B 2020,
264, 118525.
[39] K. Chu, Y-p. Liu, Y-b. Li, Y-l. Guo, Y. Tian, ACS Appl. Mater. Inter. 2020, 12, 7081-7090.
[40] K. Chu, J. Wang, Y-p. Liu, Q-q. Li, Y-l Guo. J. Mater. Chem. A 2020, 8, 7117-7124.
[41] K. Chu, Q.-q. Li, Q-qi. Li, Y-h. Cheng, Y-p. Liu, ACS Appl. Mater.