RESEARCH ARTICLE
MALDI-Mass Spectrometry Imaging to Investigate Lipid
and Bile Acid Modifications Caused by Lentil Extract Used
as a Potential Hypocholesterolemic Treatment
Michele Genangeli,
1,2Annemarie M. M. Heijens,
1Alice Rustichelli,
1Noortje Dien Schuit,
1Maria Vittoria Micioni Di Bonaventura,
3Carlo Cifani,
3Sauro Vittori,
2Tiffany Porta Siegel,
1Ron M.A. Heeren
11
The Maastricht MultiModal Molecular Imaging Institute (M4I), Division of Imaging Mass Spectrometry, Maastricht University, Maastricht, The Netherlands
2
School of Pharmacy, Chemistry unit, University of Camerino, Camerino, Italy
3
School of Pharmacy, Pharmacology Unit, University of Camerino, Camerino, Italy
Abstract.This paper reports matrix-assisted la-ser desorption/ionization mass spectrometry im-aging to investigate systematic effects of a lentil extract treatment to lower cholesterol levels. For this purpose, mass spectrometry imaging was used to spatially investigate modifications in the lipid composition and cholesterol levels in the brain, liver, and intestines as well as bile acids in the liver and intestine of rats treated with lentil extract. Neither the lipid composition nor choles-terol levels in the brain samples were found to be significantly different between the treated and not-treated animal groups. The hypercholesterolemic livers showed signs of steatosis (lipid marker PG 36:4), but no modifications in bile acid, cholesterol, and lipid composition. We found significant differences (AUC > 0.75) in the intestines regarding bile acid and lipid composition after treatment with the lentil extract. The treated rats showed a decreased reabsorption (increased excretion) of ursodeoxycholic acid, deoxycholic acid, and chenodeoxycholic acid and an increased deconjugation of taurine-conjugated bile acids (taurochenodeoxycholic acid, taurodeoxycholic acid, taurocholic acid, and 3-keto-taurocholic acid). This indicates that the lentil extract lowers the total cholesterol level in two synergic ways: (i) it increases the excretion of bile acids; hence, new bile acids are produced in the liver from serum cholesterol and (ii) the prebiotic effect leads to free taurine which upregulates the de novo synthesis of bile acid from cholesterol while activating LDL receptors. We demonstrate here that mass spectrometry imaging is a valuable tool for a better understanding of the effects of treatments such as for the synergistic cholesterol-lowering effect of the lentil extract.
Keywords:Imaging mass spectrometry, Neutraceutics, Lentils, Lipids, LCMS, MALDI-MSI Received: 3 April 2019/Revised: 7 June 2019/Accepted: 20 June 2019/Published Online: 5 August 2019
N
utrition has been known to affect a plethora of organs and functions in the body, making it an important factor in health research [1,2]. This study aims to add to this knowledge by investigating the influence of nutrition and local cellular metabolism in the liver, intestines, and brain to provide insightElectronic supplementary material The online version of this article (https:// doi.org/10.1007/s13361-019-02265-9) contains supplementary material, which is available to authorized users.
into the effects of consuming vegetable extracts and phytocomplexes on the body. We focus here on lentils, which is a type of legume, high in macronutrients, mostly proteins and carbohydrates, and also rich in bioactive compounds. Regular consumption of lentils has been shown to decrease the risk for various diseases such as diabetes, obesity, cancers, and cardio-vascular diseases due to the presence of bioactive compounds (e.g., polyphenols known to have health-promoting effects) [3]. The carbohydrates in lentils act as prebiotic components and are beneficial for the growth of healthy microbiota [4]. A recent publication from Micioni Di Bonaventura et al. investigating the effect of lentil extract (LE) on the cholesterol levels in rats via high-performance liquid chromatography-tandem mass spectrometry (HPLC-MS/MS) [5] concluded that a LE (Lens culinaris Medik) treatment lowered the total plasma cholesterol and LDL levels due to an increase in the excretion of fecal bile acids [5,6]. This cholesterol-lowering effect was a result of the inhibition of intestinal reabsorption of bile acids caused by an active phytochemical in lentils called soyasaponin [5, 7, 8]. There are two groups of soyasaponins known as groups A and B; group B contains compounds, e.g., soyasaponin I andβg, which are mainly responsible for lowering cholesterol [5,9].
Bile acids are produced by hepatocytes from precursor cholesterol and secreted via the bile duct into the duode-num [10,11]. Most bile acids (around 95%) are reabsorbed in the ileum and transported back to the liver via the portal vein (the enterohepatic circulatory system) [10]. Primary bile acids are produced in the hepatocytes of the liver and then converted into secondary bile acids by the intestine microbiota. The primary bile acids, mainly cholic acid (CA) and chenodeoxycholic acid (CDCA), are conjugated with taurine and glycine to be excreted as bile into the duodenum [12]. In the intestines, the microbiota converts CA into deoxycholic acid (DCA) and CDCA into lithocholic acid (LCA) and ursodeoxycholic acid (UDCA), which are secondary bile acids [12, 13]. Because soyasaponins have an inhibiting effect on the reabsorption of bile acids, it is of great interest to investigate the metabolic modifications of bile acid and lipid compositions in the intestines after treatment with soyasaponin [5].
It was hypothesized that the changes in the intestine after LE treatment [5] could also result from altered bile acid synthesis and modifications in the lipidic composition in the liver. Additionally, we speculated that the gut–brain connection and the hypercholesterolemia altered the ex-pression of lipids and cholesterol levels in the brain. Here, we employed the matrix-assisted laser desorption/ ionization mass spectrometry imaging (MALDI-MSI) to analyze organs harvested from the same animals sacrificed in the paper from Micioni Di Bonaventura et al. [5] (Fig-ure 1), and investigate whether LE food supplementation affects cholesterol and lipid levels of the brain, intestines, and liver, and bile acid levels in the intestines and liver [14–17]. MALDI-MSI has been proven to be an extremely valuable tool able to study the spatial distribution of a wide variety of analytes (e.g., lipid, protein, peptide,
metabolites) with high sensitivity [18–20]. Compared with conventional imaging techniques such as PET/CT or MRI, MALDI-MSI offers numerous advantages: it is a label-free technique that can produce higher spatial resolution images and allows the simultaneous detection and identification of thousands of different compounds in a single experiment [21]. Additionally, when compared with other mass spec-trometry techniques such as HPLC-MS/MS, MALDI-MS allows the analysis and visualization of selected molecules while maintaining their spatial distribution and the integri-ty of the sample.
We discovered that LE has a duplex effect in which it lowers the total cholesterol and LDL levels, where N-arachidonoyl taurine and taurine-conjugated BA play an important role in these effects. Furthermore, our findings show that LE does not interfere with brain and liver functionality.
Materials and Methods
Chemicals
Methanol, ethanol, n-hexane, and xylene (ULC/MS-CC/SFC grade) were purchased from Biosolve Chimie (Dieuze, France). Red phosphorous standard, acetone, Entellan, and norhamane were purchased from Merck KGaA (Darmstadt, Germany).
Animals and Organ Collection
The organs used for this study were harvested from the same animals sacrificed as described in the paper from Micioni Di Bonaventura et al. [5] (Figure1). The brains, livers, duodena, and colons from 6 male Sprague–Dawley rats (n = 24) were analyzed in three technical replicates. The animals belonged to three study groups as follows:
i. Two rats were used as a control group and did not receive any treatment (C1 and C2) but were fed with standard laboratory chow and water ad libitum (4RF18, Mucedola, Settimo Milanese, Italy; 2.6 kcal/g);
ii. two rats received a commercially available high-cholesterol diet (AIN-76A rodent diet with 1% cholesterol and 0.5% cholic acid, D04082702 Research Diet, New Brunswick, USA) to cause hypercholesterolemia and also received wa-ter ad libitum (hypercholeswa-terolemia rats: HC1 and HC2); iii. The remaining two rats were fed with the same
high-cholesterol diet and also received 4 ml of LE (Lens culinaris Medik) rich in soyasaponin diluted in 16 ml of water, as described elsewhere [3]. When they finished drinking the extract, free access to water was allowed (hypercholesterolemia rats with treatment: HT1 and HT2).
All rats were sacrificed after 71 days, and organs harvested. The intestines were flushed with water. The organs were stored
separately in tin foil in a plastic bag and kept in a– 80 °C freezer prior to analysis.
Preparation of Tissue Sections for MALDI-MSI
Analysis
The organs were sectioned with a cryomicrotome (Leica CM 1860 UV) at 12-μm thickness in a 30–45% humidity atmo-sphere. The brain was transversally sectioned, the median lobe of the liver was axially sectioned, and consecutive transverse cross sections of the intestines (after the duodenal papillae for the duodenum) were also prepared. The tissue sections were mounted onto clean indium tin oxide (ITO) unpolished float glass slides (25 × 75 × 1.1 mm, Rs = 4–8 Ω, Delta Technolo-gies LTD, Loveland, USA). The ITO glass slides were cleaned by sonicating for 6 min in subsequent baths of n-hexane and ethanol. Dust particles from the slides were removed using nitrogen before usage. The organs were randomly mounted onto the slides in order to minimize batch effects during anal-ysis. Prior to analysis, the mounted tissue sections were desic-cated under vacuum for 20 min. Then, 80–90 mg of norharmane (beta-carboline) MALDI matrix was dissolved in 2 ml of methanol. This solution was applied onto the slides with a sublimator device (HTX Technologies, LLC, Chapel Hill, USA) [22] at 140 °C for 180 s, and the samples were allowed to dry up in a vacuum desiccator for at least 20 min. Each plate was scanned (grayscale, 2400 dpi) to align the laser with a visual image. The plates were stored in vacuum bags in the− 80 °C freezer prior to MALDI-TOF analysis.
MALDI-MSI Analysis
Lipid mass spectra were acquired with the Bruker RapifleX MALDI Tissuetyper (Bruker Daltonik GmbH, Bremen,
Germany) where ions were generated with a Smartbeam 3D laser in M5 profile (Nd:YAG laser, λ = 355 nm) and data acquired at a spatial resolution of 50μm. Experiments were performed in negative ionization mode over a mass range of m/z 300–1700. The laser intensity was set between 70 and 90%. External mass calibration was performed using a red phosphorus standard mixed with acetone [23]. MS/MS analysis was performed on a Synapt G2-Si (Waters, Manchester, UK) which utilizes collision-induced dissociation (CID) to fragment-isolated precursor ions in the trap cell with a collision energy of 25 eV and an isolation window of 1 Da. Exact mass measurements were performed on a Fourier transform ion cyclotron resonance (FT-ICR) MS system (solariX; Bruker Daltonik GmbH, Bremen, Germany), equipped with a 9.4-T magnet to provide further information for the elucidation of the identity of selected ion species. This is deployed to match the observed m/z values with the theoretical mass of the molecule under study and complements the MALDI-TOF–based MS/ MS identification.
Data Preprocessing and Analysis
The resulting data from the analysis of all organs were normal-ized to total ion count (TIC) using FlexImaging (version 4.1, Bruker Daltonik GmbH, Bremen, Germany). Average mass spectra from each organ were exported to mMass (http://
www.mmass.org, version 5.5.0 [24]) where a Gaussian
baseline correction was applied. A peak list was generated with a binning of 0.2 bandwidth and used for further data analysis. Multivariate analysis (i.e., unsupervised principal component analysis (PCA [25]) and probabilistic latent semantic analysis (pLSA [26]) were performed on the TIC-normalized spectra using SCiLS Lab software (version 2016b,
C1 C2 HC1 HC2 HT1 HT2
Brain Liver Duodenum Colon
(a)
(b)
Previous study
Plasma analysis
• Total cholesterol • Triglycerides • HDL • LDLMALDI-MSI
Feces analysis
• Bacterial qualification and counts • BA qualification and quantification through HPLC-MS/MSFigure 1. (a) Experimental design. A total of six rats (2× control [C], 2× hypercholesterolemic control [HC], and 2× hypercholester-olemic treated [HT]) were sacrificed. Four organs were collected from each rat (brain, liver, duodenum, and colon), sliced, and analyzed in triplicate. (b) The animals included in this paper are the same rats used for the paper from Micioni Di Bonaventura et al., where the listed analyses were performed. The images are meant for illustrative and explanatory purposes only. Images of the brain was created by Gill Brown [41]; other images were taken from SERVIER medical Art (CC) [https://smart.servier.com/]
Bremen, Germany). The PCA was used to find the highest variance and check the quality of the data, while the pLSA was employed to discover differences between groups and identify potential features responsible for these differences. For each PCA and pLSA, a total of 15 components were taken, and the score plots were studied to find components and m/z values which discriminate between groups C, HC, and HT.
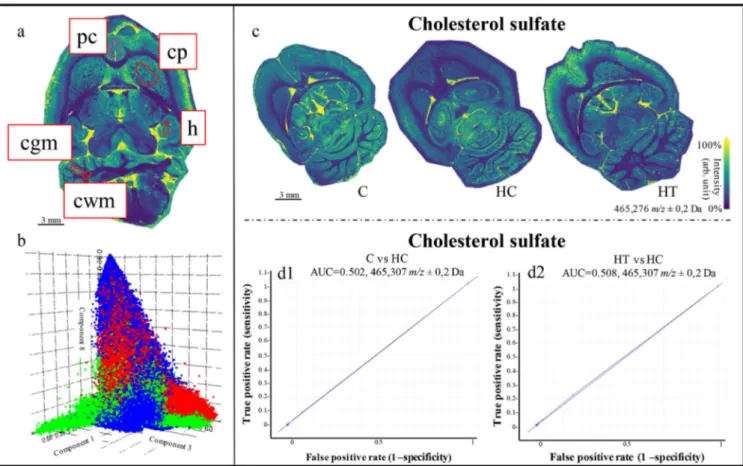
The brain samples were analyzed by comparing the whole tissue section at first, and then by comparing then-selected regions of interest of the brains (i.e., prelimbic cortex, caudate putamen, cerebellum, and hippocampus (Figure 6a). These areas were chosen as previous studies showed that hypercho-lesterolemia could induce changes in the hippocampal pheno-type and memory deficits [27, 28]. The liver samples were analyzed by comparing the whole tissue section and, for the intestines, the duodenum and the colon were analyzed independently.
A list containing peaks of interest related to bile acids, cholesterol, and steatotic liver-associated disease was created based on literature [5,16] (TableS1). The peaks belonging to the aforementioned peak list were visually and statistically examined. The most relevant components from the PCA and LSA were further analyzed by evaluating the receiver operating characteristic (ROC) plot of every discriminative (AUC≥ 0.75) peak obtained. Selected peaks with differences between groups or subgroups were then analyzed on a Synapt G2-Si using MS/ MS in order to obtain additional information to identify these peaks and confirmed using the exact mass from the FT-ICR.
Histological Staining
The matrix was removed from the tissue sections after MALDI-MSI analysis in a bath of 100% ethanol (2×) for 3 min and consecutively rehydrated in subsequent ethanol baths of 96% (2×) and 70% (2×), each for 2 min. The samples were stained with hematoxylin for 3 min, washed with deion-ized water, and stained with eosin for 30 s. The slides were subsequently washed under running tap water and placed in absolute ethanol for 1 min and fresh xylene for 30 s. Finally, the slides were coverslipped and fixed with Entellan. High-resolution optical images of the H&E-stained tissue microar-rays were obtained with the MIRAX Desk scanner (Zeiss, Jena, Germany).
Results and Discussion
Cholesterol, Bile Acid, and Lipid Modifications
in the Liver
In the previous study involving the same rats [5], LE was found to reduce the levels of cholesterol effect in plasma. Here, we focused our investigations on the levels of cholesterol in the liver. The control group was expected to contain the lowest cholesterol levels, followed by the hypercholesterolemic treat-ed group, and the hypercholesterolemic control group which displayed the highest levels. In the present study however, no
significant differences in cholesterol levels in the liver were found among the three groups (Figure2a).
Next, we investigated the bile acids (BA) produced from precursor cholesterol and secreted via the bile duct and lipid levels. The bile ducts were identified by localizing and visual-izing taurocholic acid ([M-H]−at m/z 514.25) (Figure2d). The peaks included in the generated peak list (TableS1) and related to BA and steatotic liver-associated disease were visually and statistically examined. The m/z values were then compared with those of the significant peaks from the pLSA. Molecular images of selected BA (TableS1) [5] did not show differences in the distribution of these molecules between the three groups. The cardiolipin at m/z 1465 was not detected in our samples.
With respect to lipids, pLSA of the whole liver sections displayed three components that distinguished the three differ-ent groups of treated mice (Figure2c). From the loading plot, a total of 218 peaks contributed to this discrimination, of which 11—related to lipid species—were found to be statistically relevant (AUC > 0.75) for the discrimination between two or all three groups. These peaks were identified with MS/MS and confirmed using the exact mass from the FT-ICR (Table 1, Table S2, Figure S1). PE (18:0_20:4), PE (18:0_22:4), PI (16:0_20:4), and PI (18:0_20:4) were mainly expressed in the control group in comparison with the other two groups and they mostly contain a chain of arachidonic acid. PI with a fatty acid chain of arachidonic acid (20:4) has been shown to be connect-ed with a healthy liver [16], in line with our observations. PE (16:0_18:2), PI (16:0_18:2), and PI (18:0_18:2) did not show noticeable differences between groups, but only differences between individual organs.
The last four identified lipids were PG (36:4), known to be associated with steatotic livers [16], PE (40:6), PG (38:5), and PI (16:0_22:6). These four lipids displayed higher levels in the HC group (Figure2b).
The cholesterol and BA expression in the liver were statis-tically relevant for discrimination between groups. On the other hand, the C groups showed a higher expression in PI with a fatty acid chain of arachidonic acid (20:4), fatty acid associated with healthy liver [16]. However, we showed that the HC group showed higher signals of a steatosis-associated lipid.
Cholesterol, lipid, and bile acid modifications
in the intestine (colon and duodenum)
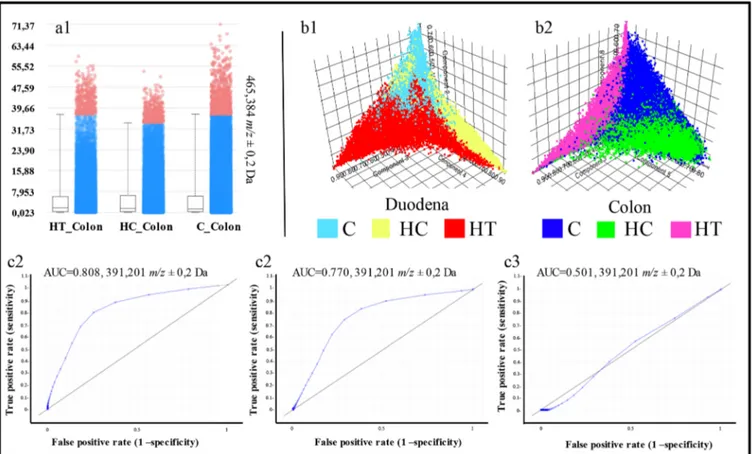
Next, we examined the differences in cholesterol levels in the intestines. In negative ionization mode, cholesterol can be detected as cholesterol sulfate, which is typically detected at m/z 465 and m/z 467 [29]. Both of these peaks were present in the obtained spectra, but they were not discriminating between the groups. Their distribution was similar for both the colon and the duodenum (Figure3a).
With respect to the lipid composition in the intestines, no significant differences were observed between groups (data not shown). A possible reason for this is that the LE treatment rich in soyasaponins only has an effect on the bile acid composition via the microbiota and might not directly affect the lipid
composition. We investigated the presence of soyasaponin I andβg, the cholesterol-lowering agents found in lentils, with m/z 941.5 and m/z 1067.0, respectively [30]. Additionally,
peaks related to the conjugation of soyasaponins and bile acids were also examined. However, no peaks were found, indicating that no soyasaponins could be detected in the intestines.
(a)
(c)
(b)
(d)
Control HC
HT
Blood vessel
(heme groupm/z 615.02 [M-H]-) Bile ducts
(taurocholic acidm/z 514.25 [M-H]-) Int en si ty (a rb. uni t) 100% 0% 465.243 m/z ± 0.2 Da 5 mm 4 mm Int ens ity (a rb. uni t) 100% 0% 769.503 m/z ± 0.2 Da
C
HC
HT
Figure 2. (a) Molecular distribution of the cholesterol sulfate. From the image, it is clear that there are no differences in regard to cholesterol expression in the three liver groups. (b) Molecular image of the mass peak corresponding to PG 36:4 (a marker for steatosis, as indicated by the white arrows). Results show that the signal measured for PG is relatively higher in the HC liver compared with that of the treated group and control. (c) Unsupervised statistical analysis (pLSA) showing a clear distribution of the three groups (green, control; red, hypercholesterolemic control; and blue, hypercholesterolemic treated). (d) Blood vessels and bile ducts highlighted using the heme group (m/z 615.02 [M-H]−) and the taurocholic acid (m/z 514.25 [M-H]−), respectively
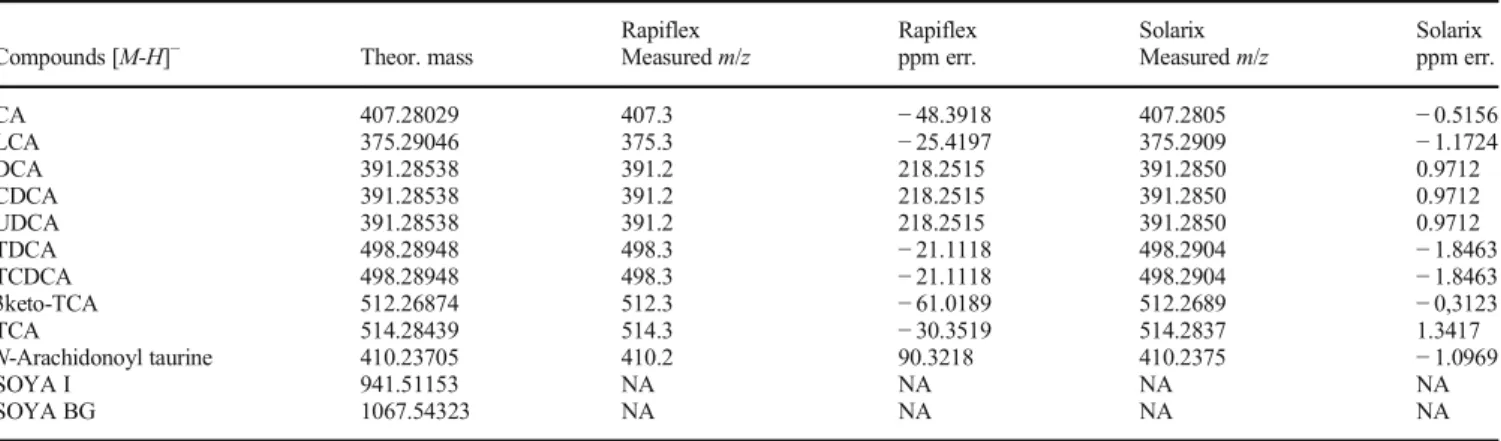
Table 1. List of Bile Acids, Soyasaponins, and N-Arachidonoyl Taurine, Confirmed with the Exact Mass. Starting from the Left Column, We Have the Compound Name, Theoretical Mass, Measured Mass, and Error Expressed in ppm from a Low-Mass Resolution (Rapiflex) and a High-Mass Resolution (Solarix) Instruments. Soyasaponins Were Not Found in the Analyzed Tissues
Rapiflex Rapiflex Solarix Solarix
Compounds [M-H]− Theor. mass Measured m/z ppm err. Measured m/z ppm err.
CA 407.28029 407.3 − 48.3918 407.2805 − 0.5156 LCA 375.29046 375.3 − 25.4197 375.2909 − 1.1724 DCA 391.28538 391.2 218.2515 391.2850 0.9712 CDCA 391.28538 391.2 218.2515 391.2850 0.9712 UDCA 391.28538 391.2 218.2515 391.2850 0.9712 TDCA 498.28948 498.3 − 21.1118 498.2904 − 1.8463 TCDCA 498.28948 498.3 − 21.1118 498.2904 − 1.8463 3keto-TCA 512.26874 512.3 − 61.0189 512.2689 − 0,3123 TCA 514.28439 514.3 − 30.3519 514.2837 1.3417 N-Arachidonoyl taurine 410.23705 410.2 90.3218 410.2375 − 1.0969 SOYA I 941.51153 NA NA NA NA SOYA BG 1067.54323 NA NA NA NA
Even though we did not find differences in the cholesterol and lipid distribution in the intestine and did not detect any soyasaponins, the PCA showed a different variance within both the duodenum (n = 3) and colon (n = 3) groups, analyzed inde-pendently (Figure3b). The HT and HC groups showed a clear separation, both overlapping the control group (Figure3b). We identified a total of 58 m/z values able to discriminate between HT and HC groups both in the duodenum and colon with an AUC≥ 0.75. Comparing these 58 peaks with the list of bile acids quantified from Micioni Di Bonaventura et al. [5], we identified chenodeoxycholic acid, deoxycholic acid, and ursodeoxycholic acid (UDCA, DCA, CDCA, m/z 391.2) to be significantly higher in the colon but not duodena of the HT group compared with the HC rats (Figure3c). This obser-vation suggests that the reuptake of these bile acids is inhibited by the LE diet, likely by soyasaponins. However, lithocholic acid (LCA, m/z 375.3) and cholic acid (CA, m/z 407.0) do not discriminate between the groups.
Taurodeoxycholic acid and/or taurochenodeoxycholic acid (TDCA, TCDCA, m/z 498.3), 3-keto-taurocholic acid (3keto-TCA, m/z 512.3), and taurocholic acid ((3keto-TCA, m/z 514.3) were all discriminative (AUC ≥ 0.748) between HC_Colon and HT_Colon, with higher levels in control animals (Figure4). These bile acids were also discriminative between the colon
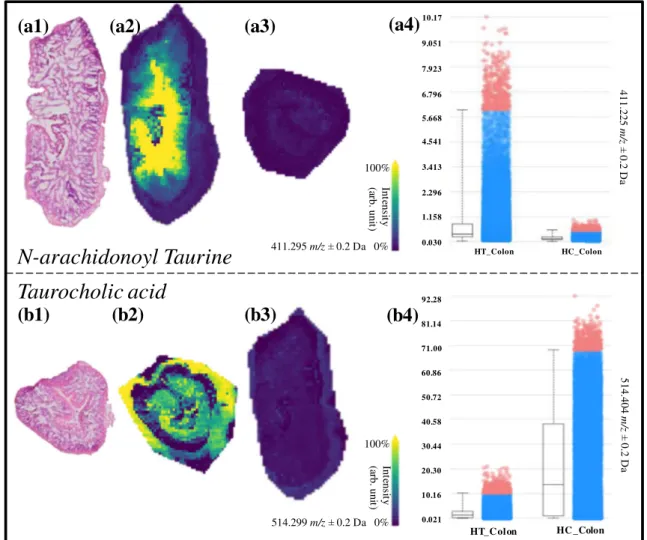
and duodenum of the HC group, suggesting that they undergo modifications while traveling through the digestive tract. As seen in Figure 4b, taurocholic acid (m/z 514.3) is mainly present in the HC_Colon group. It is clear that these three molecular species that are taurine-conjugated bile acids have a strong discrimination power between HC_Colon and HT_Colon and are with a higher amount present in the HC_Colon image (Figure 4b). N-Arachidonoyl taurine is a polyunsaturated fatty acid (PUFA) conjugated with a taurine group that acts in the brain as a neurotransmitter and plays a role in insulin secretion in the pancreas [31, 32]. N-Arachidonoyl taurine is discriminative (AUC > 0.750) between HT_Colon and HC_Colon (Figure4a), being prevalently pres-ent in the HT_Colon.
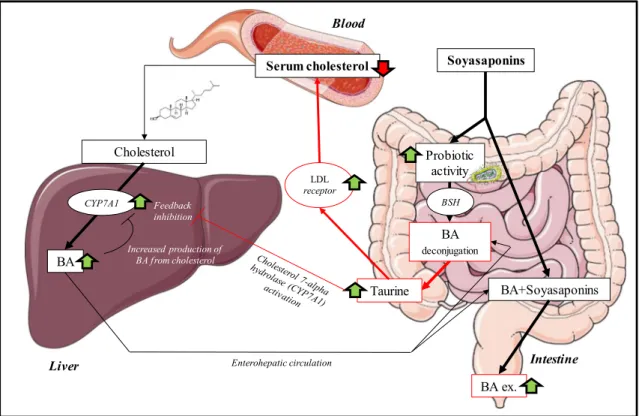
Deconjugation of taurine-conjugated bile acids is carried out by the gut microbiota, namely by the following bacterial gen-era: Bacteroides, Bifidobacterium, Clostridium, Lactobacillus, and Listeria [33]. Deconjugation occurs by bile salt hydrolase (BSH) enzymes, which are highly present in Bifidobacterium (Figure5). The end products of this reaction are free taurine and deconjugated bile acid [34] which were detected in the present study. Our results correlate with the work of Micioni Di Bon-aventura et al. who indicated an increase of the Bifidobacterium in the LE-treated group [5]. A previous study demonstrated that
Figure 3. (a) Cholesterol level in the three colon groups. No significant variations are shown. (b1, b2) Score plot from the pLSA between the three duodena groups (b1, C, light blue; HC, yellow; HT, red) and between the three colon groups (b2, C, blue; HC, green; HT, pink). Both the pLSA show differences between the groups, especially in the colon. (c1–c3) ROC plots for peak m/z 391.2 (CDCA/DCA/UDCA) which show significant differences in the expression of these BA in the (c1) HT_Colon vs C_Colon and (c2) HT_Colon vs HC_Colon and no differences in the (c3) HT_Duodenum vs HC_Duodenum
dietary taurine supplementation reduced serum cholesterol levels by increasing the activity of hepatic cholesterol 7a-hydroxylase (CYP7A1), which is involved in the process of converting cholesterol into bile acids and increases the fecal excretion of bile acids in hypercholesterolemic rats [35]. The deconjugation of the taurine-conjugated bile acids by the Bifidobacterium will act similarly to taurine supplementation, as more of the taurine will come free and will be reabsorbed before it reaches the colon by the taurine transporter [36] (Figure5). Taurine also plays a role in elevating LDL receptor levels, which results in lower cholesterol serum levels [37]. When the results of the increased bile acid excretion (CDCA, DCA, and/or UDCA) and the decreased taurine-conjugated bile acids (TDCA/TCDCA, 3keto-TCA, and TCA) in the HT group are combined with the findings from Micioni di Bona-ventura et al., we can conclude that the taurine-conjugated bile acids lost their taurine (TDCA/TCDCA) and that the other bile acids (DCA/CDCA) end in the feces. This can be attributed to the prebiotic activity of LE rich in soyasaponins. Although we d i d n o t d e t e c t t h e m o l e c u l e s r e s p o n s i b l e f o r t h e hypocholesterolemic effect (soyasaponin I and βg [5]), we
prove here that MALDI-MSI allowed the understanding of their effects in the intestines (Figure5).
Investigation of Cholesterol and Lipid
Modifica-tions Induced on the Brain by the LE Treatment
The pLSAs and PCAs for the whole brain sections and subsections of the three experimental groups (C, HC, HT) did not show statistically relevant differences (Figure6b). Additionally, the peak related to cholesterol sulfate and connected molecular images of the distribution of choles-terol in the brains showed differences between different animals but not related to different groups. (Figure6c, d). The caudate putamen, hippocampus, prelimbic cortex, and cerebellum (white and gray matter) were investigated due to their connection to memory deficit and possible changes in the hippocampal phenotype associated with hypercholester-olemia and obesity [27, 28]. Preliminary behavioral tests performed from Micioni Di Bonaventura et al. showed no significant behavioral change among the three experimental groups [5]. Here, no significant differences were found in
(a1)
(a2)
(a3)
(b1)
(b2)
(b3)
100% Int en sit y (a rb. uni t) 411.295 m/z ± 0.2 Da 0% 100% Int en sit y (a rb. uni t) 514.299 m/z ± 0.2 Da 0% 0.021 10.16 20.30 30.44 40.58 50.72 60.86 71.00 92.28 81.14 0.030 1.158 2.296 3.413 4.541 5.668 6.796 7.923 9.051 10.17 514.404 m/ z ± 0.2 D a 411.225 m/ z ± 0.2 D a HC_Colon HT_Colon HT_C olon(a4)
(b4)
N-arachidonoyl Taurine
Taurocholic acid
HC _ColonFigure 4. (a1–a4) Molecular images of N-arachidonoyl taurine in the HT_Colon (a2) and HC_Colon (a3). (a4) Boxplot of the intensity ofN-arachidonoyl taurine in the HT_Colon vs. the HC_Colon. (b1–b4) Molecular images of taurocholic acid in the HC_Colon (b2) and HT_Colon (b3). (b4) Boxplot of the intensity ofN-arachidonoyl taurine in the HT_Colon vs. the HC_Colon
cholesterol or lipid composition in these subregions. As previous studies have only shown an association between hypercholesterolemia, obesity, and memory deficits [28], it seems reasonable that there are no relevant results from the behavioral tests. These results indicate that neither the high-cholesterol diet nor LE treatment led to significant molecu-lar variations in the brain lipid composition and distribution in rats observable with MALDI-MSI.
The absence of lipid and cholesterol changes in the brain is due to various factors. Studies showed that a high-cholesterol diet could induce relevant increases in plasma and liver cho-lesterol, but not brain cholesterol levels [38], in line with our observations. Additionally, the duration of the high-cholesterol diet and the treatment was too short to lead to concrete changes in brain lipid composition. This speculation is based on previ-ous knowledge that total cholesterol absorption, synthesis, and turnover are strongly correlated with body fat composition and higher in obese subjects compared with non-obese subjects [39]. It is worth noting that the rats were sacrificed in non-obese conditions.
Furthermore, in healthy brains, the several mechanisms involved in the maintenance of brain homeostasis (e.g., apoli-poprotein E, ABC transporters) actively regulate the level of cholesterol in the brain by blocking its entrance and activating or blocking secondary pathways for cholesterol synthesis [40]. This led to conclude that the hypercholesterolemic treatment
did not affect the brain lipid composition and distribution within the timeframe of the study.
Conclusions
The present study employed MALDI-MSI to investigate modifications in cholesterol, lipid, and bile acid metabo-lism in rat liver and intestine as well as cholesterol and lipid composition in rat brain for a better understanding of the effect of a treatment with a cholesterol-lowering, hydro-alcoholic LE-containing soyasaponins. We demon-strated that the LE does not modify the cholesterol and lipidic content of the brain nor the cholesterol composi-tion in the liver. On the other hand, in the liver, we highlight the presence of a lipid (PG 36:4) connected with steatosis in untreated hypercholesterolemic rats.
The molecular tissue analysis results are found to be in line with previously reported observations by Micioni Di Bonaven-tura et al. demonstrating that some BA (UDCA, DCA, CDCA, m/z 391.2) are not reabsorbed in the intestine after LE treatment. Additionally, we discovered that the hypocholesterolemic effect of LE treatment rich in soyasaponins is not only due to the increased excretion of BA with the feces (which forces the animal to produce new BA from cholesterol), but also to the prebiotic effect of LE. This led to an increased hydrolization of
BA Serum cholesterol BA ex. Probiotic activity Soyasaponins BA deconjugation Taurine Feedback inhibition BSH Cholesterol CYP7A1 Increased production of BA from cholesterol BA+Soyasaponins
Liver Enterohepatic circulation Intestine
LDL
receptor
Blood
Figure 5. Overview of the duplex cholesterol-lowering mechanisms of soyasaponins by increasing the excretion of BA with the faces, which stimulates the production of new BA from cholesterol. Increased probiotic activity which results in an increased release of free taurine. Taurine both increases the activity of the cholesterol 7-alpha hydrolase enzyme in the liver (CYP7A1) and stimulates LDL receptors in the body, resulting in an overall reduction of serum cholesterol. The images are meant for illustrative and explanatory purposes only. Images were taken from SERVIER medical Art (CC) [23]
taurine-conjugated bile acids from the gut microbiota, resulting in free taurine. Taurine has an upregulating effect on hepatic cholesterol 7a-hydroxylase and LDL receptors leading to a reduction of the total cholesterol levels in the blood.
We here demonstrated that MALDI-MSI is a valuable tool to investigate and locate several molecular changes in different tissue types leading to a better understanding of the mecha-nisms behind the cholesterol-lowering treatments. Specifically, an untargeted technique such as MALDI-MSI led us to the discovery of the multi-organ/synergistic biological effects of LE providing a better insight into its cholesterol-lowering properties in rat models.
Acknowledgements
This research was carried out at the M4I Institute that was financially supported by the Dutch Province of Limburg as part of the LINK program. The authors acknowledge receipt of a European Commission–funded H2020 MSCA-ETN grant under proposal number 675743 (project acronym: ISPIC). All the authors are extremely grateful to Lennart Huizing and Bryn Flinders (M4I) for their support with the MS/MS identification and fruitful discussions.
Open Access
This article is distributed under the terms of the Creative Commons Attribution 4.0 International License (http:// creativecommons.org/licenses/by/4.0/), which permits unre-stricted use, distribution, and reproduction in any medium, provided you give appropriate credit to the original author(s) and the source, provide a link to the Creative Commons license, and indicate if changes were made.
References
1. Jimenez-Chillaron, J.C., Diaz, R., Martinez, D., Pentinat, T., Ramon-Krauel, M., Ribo, S., Plosch, T.: The role of nutrition on epigenetic modifications and their implications on health. Biochimie.94, 2242– 2263 (2012)
2. Kilonzo-Nthenge, A.K, S.N Nahasnon..: Soybean in monogastric nutri-tion: modifications to add value and disease prevention properties. (2013) 3. Ganesan, K., Xu, B.: Polyphenol-rich lentils and their health promoting
effects. Int. J. Mol. Sci.18, 2390 (2017)
4. Johnson, C.R., Thavarajah, D., Combs, G.F., Thavarajah, P.: Lentil (Lens culinaris L.): a prebiotic-rich whole food legume. Food Res. Int.51, 107– 113 (2013)
Figure 6. (a) Molecular images of the brain highlighted in red; the regions of interest (ROIs) delineated for the analysis: prelimbic cortex (pc), caudate putamen (cp), hippocampus (h), white (cwm) and gray (cgm) matter in the cerebellum. (b) 3D loading plot for the pLSA of the whole brains of the three groups. Blue represents the control group (C), green the hypercholesterolemic control (HC), and red the hypercholesterolemic treated group (HT). Results display no separation among the different groups. (c) Molecular images based on the distribution of cholesterol sulfate (m/z 465.3) over the whole brain for the C, HC, and HT groups. (d1, d2) ROC plots of them/z 465.3 (cholesterol sulfate) from the comparison between (d1) C and HC, and between (d2) HT and HC
5. Micioni Di Bonaventura, M.V., Cecchini, C., Vila-Donat, P., Caprioli, G., Cifani, C., Coman, M.M., Cresci, A., Fiorini, D., Ricciutelli, M., Silvi, S., Vittori, S., Sagratini, G.: Evaluation of the hypocholesterolemic effect and prebiotic activity of a lentil (Lens culinaris Medik) extract. Mol. Nutr. Food Res.61, (2017)
6. Lee, S.-O., Simons, A.L., Murphy, P.A., Hendrich, S.: Soyasaponins lowered plasma cholesterol and increased fecal bile acids in female golden Syrian hamsters. Exp. Biol. Med.230, 472–478 (2005) 7. Zhang, W., Teng, S.P., Popovich, D.G.: Generation of group B
soyasaponins I and III by hydrolysis. J. Agric. Food Chem.57, 3620– 3625 (2009)
8. Zhang, W., Popovich, D.G.: Group B oleanane triterpenoid extract con-taining soyasaponins I and III from soy flour induces apoptosis in Hep-G2 cells. J. Agric. Food Chem.58, 5315–5319 (2010)
9. Gurfinkel, D.M., Rao, A.V.: Determination of saponins in legumes by direct densitometry. J. Agric. Food Chem.50, 426–430 (2002) 10. Li, D., Chen, H., Mao, B., Yang, Q., Zhao, J., Gu, Z., Zhang, H., Chen,
Y.Q., Chen, W.: Microbial biogeography and core microbiota of the rat digestive tract. Sci. Rep.7, (2017)
11. Martínez-Augustin, O., Medina, F.S.d.: Intestinal bile acid physiology and pathophysiology. World J. Gastroenterol.14, 5630 (2008) 12. Chiang, J.Y.L.: Bile Acid Metabolism and Signaling. John Wiley & Sons,
Inc. (2013)
13. Suzuki, Y., Kaneko, R., Nomura, M., Naito, H., Kitamori, K., Nakajima, T., Ogawa, T., Hattori, H., Seno, H., Ishii, A.: Simple and rapid quanti-tation of 21 bile acids in rat serum and liver by UPLC-MS-MS: effect of high fat diet on glycine conjugates of rat bile acids. Nagoya J. Med. Sci. 75, 57–71 (2013)
14. Singhal, N., Kumar, M., Kanaujia, P.K., Virdi, J.S.: MALDI-TOF mass spectrometry: an emerging technology for microbial identification and diagnosis. Front. Microbiol.6, (2015)
15. Patel, R.: MALDI-TOF MS for the diagnosis of infectious diseases. Clin. Chem.61, 100–111 (2014)
16. Ščupáková, K., Soons, Z., Ertaylan, G., Pierzchalski, K.A., Eijkel, G.B., Ellis, S.R., Greve, J.W., Driessen, A., Verheij, J., De Kok, T.M., Olde Damink, S.W.M., Rensen, S.S., Heeren, R.M.A.: Spatial systems lipidomics reveals nonalcoholic fatty liver disease heterogeneity. Anal. Chem.90, 5130–5138 (2018)
17. Flinders, B., Huizing, L.R.S., van Heerden, M., Cuyckens, F., Neumann, U.P., van der Laan, L.J.W., Olde Damink, S.W.M., Heeren, R.M.A., Schaap, F.G., Vreeken, R.J.: Cross-species molecular imaging of bile salts and lipids in liver: identification of molecular structural markers in health and disease. Anal. Chem.90, 11835–11846 (2018)
18. Gessel, M.M., Norris, J.L., Caprioli, R.M.: MALDI imaging mass spec-trometry: spatial molecular analysis to enable a new age of discovery. J. Proteome.107, 71–82 (2014)
19. Zavalin, A., Todd, E.M., Rawhouser, P.D., Yang, J., Norris, J.L., Caprioli, R.M.: Direct imaging of single cells and tissue at sub-cellular spatial resolution using transmission geometry MALDI MS. J. Mass Spectrom.47, 1473–1481 (2012)
20. Gustafsson, J.O.R., Oehler, M.K., Ruszkiewicz, A., McColl, S.R., Hoffm ann, P.: MALDI iHoffmagi ng Hoffmass s pec t roHoffme try (M A LDI -IMS)―application of spatial proteomics for ovarian cancer classification and diagnosis. Int. J. Mol. Sci.12, 773–794 (2011)
21. Vaysse, P.M., Heeren, R.M.A., Porta, T., Balluff, B.: Mass spectrometry imaging for clinical research - latest developments, applications, and current limitations. Analyst.142, 2690–2712 (2017)
22. Lennart R.S. Huizing, S.R.E., Bart W.A.M.M Beulen, Florian P.Y Barré, Paul B. Kwant, Rob J. Vreeken, Ron M.A. Heeren: Matching sample
preparation speed to high throughput mass spectrometry imaging. Sub-mitted to Clinical Mass Spectrometry (2018). (2018)
23. Sladkova, K., Houska, J., Havel, J.: Laser desorption ionization of red phosphorus clusters and their use for mass calibration in time-of-flight mass spectrometry. Rapid Commun. Mass Spectrom.23, 3114–3118 (2009)
24. Niedermeyer, T.H.J., Strohalm, M.: mMass as a software tool for the annotation of cyclic peptide tandem mass spectra. PLoS One.7, (2012) 25. Wold, S., Esbensen, K., Geladi, P.: Principal component analysis.
Chemometr Intell Lab.2, 37–52 (1987)
26. Hanselmann, M., Kirchner, M., Renard, B.Y., Amstalden, E.R., Glunde, K., Heeren, R.M., Hamprecht, F.A.: Concise representation of mass spectrometry images by probabilistic latent semantic analysis. Anal. Chem.80, 9649–9658 (2008)
27. Ettcheto, M., Petrov, D., Pedrós, I., de Lemos, L., Pallàs, M., Alegret, M., Laguna, J.C., Folch, J., Camins, A.: Hypercholesterolemia and neurode-generation. Comparison of hippocampal phenotypes in LDLr knockout and APPswe/PS1dE9 mice. Exp. Gerontol.65, 69–78 (2015)
28. Ullrich, C., Pirchl, M., Humpel, C.: Hypercholesterolemia in rats impairs the cholinergic system and leads to memory deficits. Mol. Cell. Neurosci. 45, 408–417 (2010)
29. Sandhoff, R., Brugger, B., Jeckel, D., Lehmann, W.D., Wieland, F.T.: Determination of cholesterol at the low picomole level by nano-electrospray ionization tandem mass spectrometry. J. Lipid Res.40, 126–132 (1999)
30. Sagratini, G., Zuo, Y., Caprioli, G., Cristalli, G., Giardinà, D., Maggi, F., Molin, L., Ricciutelli, M., Traldi, P., Vittori, S.: Quantification of soyasaponins I andβg in Italian lentil seeds by solid-phase extraction (SPE) and high-performance liquid chromatography−mass spectrometry (HPLC-MS). J. Agric. Food Chem.57, 11226–11233 (2009)
31. Waluk, D.: Biosynthesis and physiological functions of N-acyl amino acids. Microbiology and Toxicology. (2012)
32. Connor, M., Vaughan, C.W., Vandenberg, R.J.: N-Acyl amino acids and N-acyl neurotransmitter conjugates: neuromodulators and probes for new drug targets. Br. J. Pharmacol.160, 1857–1871 (2010)
33. Gérard, P.: Metabolism of cholesterol and bile acids by the gut microbi-ota. Pathogens.3, 14–24 (2013)
34. Begley, M., Hill, C., Gahan, C.G.M.: Bile salt hydrolase activity in probiotics. Appl. Environ. Microbiol.72, 1729–1738 (2006)
35. Murakami, S., Fujita, M., Nakamura, M., Sakono, M., Nishizono, S., Sato, M., Imaizumi, K., Mori, M., Fukuda, N.: Taurine ameliorates cholesterol metabolism by stimulating bile acid production in high-cholesterol-fed rats. Clin. Exp. Pharmacol. Physiol.43, 372–378 (2016) 36. Merheb, M., Daher, R.T., Nasrallah, M., Sabra, R., Ziyadeh, F.N.,
Barada, K.: Taurine intestinal absorption and renal excretion test in diabetic patients: a pilot study. Diabetes Care.30, 2652–2654 (2007) 37. Murakami, S., Kondo, Y., Toda, Y., Kitajima, H., Kameo, K., Sakono,
M., Fukuda, N.: Effect of taurine on cholesterol metabolism in hamsters: up-regulation of low density lipoprotein (LDL) receptor by taurine. Life Sci.70, 2355–2366 (2002)
38. Kálmán, J., Kudchodkar, B.J., Krishnamoorthy, R., Dory, L., Lacko, A.G., Agarwal, N.: High cholesterol diet down regulates the activity of activator protein-1 but not nuclear factor-kappa B in rabbit brain. Life Sci. 68, 1495–1503 (2001)
39. Nestel, P.J., Schreibman, P.H., Ahrens, E.H.: Cholesterol metabolism in human obesity. J. Clin. Investig.52, 2389–2397 (1973)
40. Zhang, J., Liu, Q.: Cholesterol metabolism and homeostasis in the brain. Protein Cell.6, 254–264 (2015)