2021-01-08T16:05:16Z
Acceptance in OA@INAF
ALMA captures feeding and feedback from the active galactic nucleus in NGC 613
Title
Audibert, A.; Combes, F.; García-Burillo, S.; HUNT, Leslie Kipp; Eckart, A.; et al.
Authors
10.1051/0004-6361/201935845
DOI
http://hdl.handle.net/20.500.12386/29623
Handle
ASTRONOMY & ASTROPHYSICS
Journal
632
Number
https://doi.org/10.1051/0004-6361/201935845 c A. Audibert et al. 2019
Astronomy
&
Astrophysics
ALMA captures feeding and feedback from the active galactic
nucleus in NGC 613
?
A. Audibert
1, F. Combes
1,2, S. García-Burillo
3, L. Hunt
4, A. Eckart
5, S. Aalto
6, V. Casasola
7, F. Boone
8,
M. Krips
9, S. Viti
10, S. Muller
6, K. Dasyra
11,12, P. van der Werf
13, and S. Martín
14,151 Observatoire de Paris, LERMA, CNRS, PSL Univ., Sorbonne University, UPMC, Paris, France
e-mail: [email protected]
2 Collège de France, 11 Pl. Marcelin Berthelot, 75231 Paris, France
3 Observatorio Astronómico Nacional (OAN-IGN)-Observatorio de Madrid, Alfonso XII, 3, 28014 Madrid, Spain 4 INAF – Osservatorio Astrofisico di Arcetri, Largo E. Fermi, 5, 50125 Firenze, Italy
5 I. Physikalisches Institut, Universität zu Köln, Zülpicher Str. 77, 50937 Köln, Germany
6 Department of Space, Earth and Environment, Chalmers University of Technology, Onsala Space Observatory, 43992 Onsala,
Sweden
7 INAF – Isitituto di Radioastronomia, via Piero Gobetti 101, 40129 Bologna, Italy 8 CNRS, IRAP, 9 Av. colonel Roche, BP 44346, 31028 Toulouse Cedex 4, France
9 IRAM, 300 rue de la Piscine, Domaine Universitaire, 38406 Saint Martin d’Hères, France 10 Dep. of Physics and Astronomy, UCL, Gower Place, London WC1E 6BT, UK
11 Dep. of Astrophysics, Astronomy & Mechanics, Faculty of Physics, National and Kapodistrian University of Athens, 15784
Panepistimiopolis Zografou, Greece
12 National Observatory of Athens, Institute for Astronomy, Astrophysics, Space Applications and Remote Sensing, Penteli 15236,
Athens, Greece
13 Leiden Observatory, Leiden Univ., PO Box 9513, 2300 RA Leiden, The Netherlands
14 European Southern Observatory, Alonso de Córdova, 3107, Vitacura, Santiago 763-0355, Chile 15 Joint ALMA Observatory, Alonso de Córdova, 3107, Vitacura, Santiago 763-0355, Chile
Received 4 May 2019/ Accepted 1 August 2019
ABSTRACT
We report ALMA observations of CO(3–2) emission in the Seyfert/nuclear starburst galaxy NGC 613, at a spatial resolution of 17 pc, as part of our NUclei of GAlaxies (NUGA) sample. Our aim is to investigate the morphology and dynamics of the gas inside the central kiloparsec, and to probe nuclear fueling and feedback phenomena. The morphology of CO(3–2) line emission reveals a two-arm trailing nuclear spiral at r . 100 pc and a circumnuclear ring at a radius of ∼350 pc that is coincident with the star-forming ring seen in the optical images. Also, we find evidence for a filamentary structure connecting the ring and the nuclear spiral. The ring reveals two breaks into two winding spiral arms corresponding to the dust lanes in the optical images. The molecular gas in the galaxy disk is in a remarkably regular rotation, however the kinematics in the nuclear region are very skewed. The nuclear spectrum of CO and dense gas tracers HCN(4–3), HCO+(4–3), and CS(7–6) show broad wings up to ±300 km s−1, associated with a molecular
outflow emanating from the nucleus (r ∼ 25 pc). We derive a molecular outflow mass Mout = 2 × 10⁶M and a mass outflow rate
of ˙Mout = 27 M yr−1. The molecular outflow energetics exceed the values predicted by AGN feedback models: the kinetic power of
the outflow corresponds to PK,out= 20%LAGNand the momentum rate is ˙Moutv ∼ 400LAGN/c. The outflow is mainly boosted by the
AGN through entrainment by the radio jet, but given the weak nuclear activity of NGC 613, we might be witnessing a fossil outflow resulting from a previously strong AGN that has now faded. Furthermore, the nuclear trailing spiral observed in CO emission is inside the inner Lindblad resonance ring of the bar. We compute the gravitational torques exerted in the gas to estimate the efficiency of the angular momentum exchange. The gravity torques are negative from 25 to 100 pc and the gas loses its angular momentum in a rotation period, providing evidence for a highly efficient inflow towards the center. This phenomenon shows that the massive central black hole has significant dynamical influence on the gas, triggering the inflowing of molecular gas to feed the black hole.
Key words. galaxies: active – galaxies: kinematics and dynamics – submillimeter: ISM – ISM: jets and outflows – galaxies: evolution – galaxies: individual: NGC 613
1. Introduction
The energy of active galactic nuclei (AGN) is well understood as being due to gas accretion onto the supermassive black hole (SMBH;Antonucci 1993). Gas inflows into the center of galax-ies can fuel the SMBH and the energy input by the AGN can
trig-? Reduced datacubes and images are only available at the CDS via
anonymous ftp to cdsarc.u-strasbg.fr (130.79.128.5) or via
http://cdsarc.u-strasbg.fr/viz-bin/cat/J/A+A/632/A33
ger subsequent feedback. The feedback can in turn regulate the SMBH growth and suppress star formation (e.g.,Croton et al. 2006; Sijacki et al. 2007). Feeding and feedback are key pro-cesses in the co-evolution of black holes (BH) and their host galaxies, which is now well established by the tight M-σ relation (e.g., Magorrian et al. 1998; Gültekin et al. 2009;McConnell & Ma 2013). It is important to study the efficiency of angular momentum transport in galaxy disks in order to understand how the star formation and nuclear activity are fueled and to elucidate A33, page 1 of19
the timescales involved, since both feeding processes rely on a common cold gas supply, but in different periods of time (∼105yr for BH growth and ∼107−9yr for star formation, García-Burillo et al. 2016). These timescales are related to the mecha-nisms that drive the gas from galactic scales (∼10 kpc) to nuclear scales (a few pc), through removal of angular momentum; large nonaxisymmetric perturbations, such as bars or spirals, represent one of these mechanisms, but so far no unique physical process associated with inward transport of gas in galaxy disks has been identified.
On large scales, cosmological simulations show that merg-ers and galaxy interactions are able to produce strong nonax-isymmetries (e.g.,Hopkins et al. 2006;Di Matteo et al. 2008). On kiloparsec scales, bar instabilities, either internally driven by secular evolution or triggered by companions, can first feed a central starburst and then fuel the BH (García-Burillo et al. 2005). On the other hand, gas inflow is impeded by the inner Lindblad resonance (ILR), where the gas is trapped in a nuclear ring (see Piner et al. 1995; Regan & Teuben 2004). On scales of a few hundred parsecs, the “bars within bars” scenario (e.g.,
Shlosman et al. 1989), together with m = 1 instabilities and nuclear warps (Schinnerer et al. 2000), takes over as a dynamical mechanism (see e.g.,Hunt et al. 2008). Observations of nearby low-luminosity AGN (LLAGN) with the NUGA program have revealed smoking-gun evidence of AGN fueling in one third of galaxies (García-Burillo & Combes 2012). This result sug-gests that galaxies alternate periods of fueling and starvation, and might be found in a feeding phase at 300 pc scales only one third of the time.
As we approach the center of galaxies, other mechanisms can contribute to the fueling: viscous torques, from dense gas in regions of large shear, or dynamical friction can drive massive clouds to the nucleus (e.g., Combes 2003; Jogee et al. 2006). Simulations suggest that fueling involves a series of dynami-cal instabilities (m = 2, m = 1) on scales of ∼10 pc, and also predict the formation of a thick gas disk similar to the putative torus invoked to explain obscured AGN (Hopkins & Quataert 2010;Hopkins et al. 2012). These fueling episodes are eventu-ally quenched by either nuclear star formation winds or AGN feedback.
The recent discovery of many massive (a few 107M )
molecular outflows in nearby AGN (e.g., Fischer et al. 2010;
Feruglio et al. 2010,2017;Alatalo et al. 2011;Sturm et al. 2011;
Veilleux et al. 2013;Cicone et al. 2014;Sakamoto et al. 2014;
García-Burillo et al. 2014;Dasyra & Combes 2012;Dasyra et al. 2014) has promoted the idea that winds may be major actors in sweeping gas out of galaxies. It has already been established that mass-outflow rates increase with AGN luminosity, supporting the idea of a luminous AGN pushing away the surrounding gas through a fast wind. Observational works (Cicone et al. 2014;
Fiore et al. 2017;Fluetsch et al. 2019) have shown that molecular outflow properties are correlated with AGN luminosity, where the outflow kinetic power corresponds to about 5%LAGN and
the momentum rate is ∼20LAGN/c, in agreement with theoretical
models of AGN feedback (Faucher-Giguère & Quataert 2012;
Zubovas & King 2012,2014). Outflows have been traced for a long time in ionized or atomic gas (Rupke et al. 2005a;Riffel & Storchi-Bergmann 2011), making it now possible to compare the different gas phases.Carniani et al.(2015) found that ionized gas only traces a small fraction of the total gas mass, suggesting that the molecular phase dominates the outflow mass. This trend is also found byFiore et al.(2017), but the ratio between molecu-lar and ionized mass-outflow rates is reduced at the highest AGN bolometric luminosities.
Probing AGN feeding and feedback phenomena through the kinematics and morphology of the gas inside the central kilo-parsec has only recently been possible due to the unprecedented spatial resolution and sensitivity of the Atacama Large Millime-ter/submillimeter Array (ALMA). Evidence of AGN feeding was found in NGC 1566, where a molecular trailing spiral struc-ture from 50 to 300 pc was detected with ALMA Cycle 0 obser-vations, and according to its negative gravity torques, is found to be contributing to the fueling of the central BH (Combes et al. 2014). Again using Cycle 0 observations, a molecular outflow is also seen in the LLAGN in the Seyfert 2 NGC 1433. It is the least massive molecular outflow (∼4 × 10⁶M
) ever detected
around galaxy nuclei (Combes et al. 2013). Furthermore, a fast and collimated outflow has been detected in HCN(1–0) and CO(1–0) emission in the nucleus of Arp 220, extending up to 120 pc and reaching velocities up to ±840 km s−1 (
Barcos-Muñoz et al. 2018).
In the prototypical Seyfert 2 NGC 1068, a clear molecular ouflow has also been detected, entrained by the AGN radio jets (Krips et al. 2011; García-Burillo et al. 2014). NGC 1068 is also the first case where the molecular torus is resolved, using the continuum and the CO(6–5), HCN(3–2), and HCO+(3–2) emission lines observed with ALMA (Gallimore et al. 2016;
García-Burillo et al. 2016; Imanishi et al. 2016). The dynam-ics of the molecular gas in the NGC 1068 torus revealed strong noncircular motions and enhanced turbulence superposed on a slow rotation pattern of the disk. The AGN is clearly off-center with respect to the torus, implying an m = 1 perturbation (García-Burillo et al. 2016). Recently, we reported observations of molecular tori around massive BHs in a sample of seven nearby LLAGN (Seyfert/ Low Ionization Nuclear Emission-line Regions- LINERs), at the unprecedented spatial resolution of 3–10 pc (Combes et al. 2019, hereafter Paper I). The ALMA observations bring a wealth of new information on the decou-pled molecular tori, which are found to have radii ranging from 6 to 27 pc, to be unaligned with the orientation of the host galaxy, and to frequently be slightly off-center with regards to the AGN position. The kinematics of the gas inside the sphere of influ-ence (SoI) of the central BH also allowed us to estimate the BH masses (MBH∼ 107−8M ).
In this paper, we present the combined ALMA cycle 3 and 4 observations in the CO(3–2) line of the Seyfert galaxy NGC 613, with a spatial resolution of 17 pc. These observations were part of the sample presented in Paper I, but the data ana-lyzed here have a higher sensitivity, allowing faint broad wings to be detected that are usually associated to outflows. This object presents a nuclear trailing spiral and we discovered a molecu-lar outflow in its nuclear region. Therefore, NGC 613 is a spe-cial case allowing us to study the complexity of fuelling and feedback mechanisms in AGN, and to perform a detailed anal-ysis of the gas flow cycle in AGN. All relevant characteristics of NGC 613 are described below. Observations are detailed in Sect. 2 and results are presented in Sect. 3. The properties of the nuclear molecular outflow discovered in the very center of NGC 613 are discussed in Sect.4. The interpretation of inflow-ing gas in terms of gravitational torques is discussed in Sect.5, and conclusions are drawn in Sect.6.
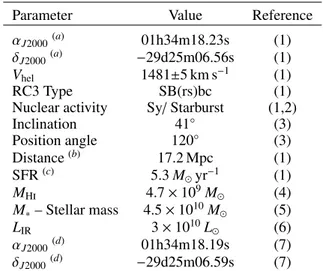
NGC 613 is a nearby barred SB(rs)bc galaxy (de Vaucouleurs et al. 1991) at a distance of 17.2 Mpc (100 = 83 pc). It has a
large-scale bar of rbar ∼ 9000with a position angle (PA) of 127◦and a
secondary nuclear bar with PA= 122◦ (Jungwiert et al. 1997;
Seigar et al. 2018). Judging from NED, NGC 613 is only moder-ately inclined, with inclination ∼38◦(see also Sect.3.4). Promi-nent dust lanes are visible along the large-scale bar and the
Fig. 1.WFC/F814W HST image in the left panel, showing the nuclear
ring and the sets of spiral arm structures at large scales. The scale is indicated in the upper-left corner. Right: 1400
square zoom showing the CO(3–2) contours overlaid on the same image. The HST image has been aligned to match the ALMA astrometry.
Table 1. Properties of NGC 613.
Parameter Value Reference
αJ2000(a) 01h34m18.23s (1)
δJ2000(a) −29d25m06.56s (1)
Vhel 1481±5 km s−1 (1)
RC3 Type SB(rs)bc (1)
Nuclear activity Sy/ Starburst (1,2)
Inclination 41◦ (3) Position angle 120◦ (3) Distance(b) 17.2 Mpc (1) SFR(c) 5.3 M yr−1 (1) MHi 4.7 × 10⁹M (4) M∗– Stellar mass 4.5 × 10¹⁰M (5) LIR 3 × 10¹⁰L (6) αJ2000(d) 01h34m18.19s (7) δJ2000(d) −29d25m06.59s (7) Notes.(a)(α
J2000, δJ2000) is the phase tracking center of our
interferomet-ric observations. (b)Distances are the median values of z-independent
distances from NEDSteer et al.(2017).(c)Star formation rate (SFR) is
derived from infrared luminosities (NED).(d)The RA–Dec positions are
the new adopted center, derived from the central continuum peak in this work, with an uncertainty of ∼0.100
(see Sect.3.1).
References. (1) NASA/IPAC Extragalactic Database (NED); (2) Veron-Cetty & Veron(1986); (3) (de Vaucouleurs et al. 1991); (4)Gadotti et al.
(2019); (5)Combes et al.(2019); (6) (Sturm et al. 2002); (7) this work.
presence of multiple spirals arms gives NGC 613 a “tentacular” appearance. NGC 613 has a typical inner Lindblad resonance (ILR) nuclear ring of ∼3.500(300 pc) in radius just inside the two characteristic leading dust lanes of the bar (Fig.1).
This galaxy hosts a LLAGN, that was first classified as a composite Seyfert/H
ii
object byVeron-Cetty & Veron (1986) based on its low-resolution optical spectrum, and later confirmed through MIR spectroscopy (Goulding & Alexander 2009) and X-ray observations using the ROSAT and XMM-Newton (Liu & Bregman 2005; Castangia et al. 2013, respectively). Water masers have been detected in the nucleus by Kondratko et al.(2006).
NGC 613 shows clear evidence of star formation, shock exci-tation, and AGN activity (Davies et al. 2017). Radio contin-uum observations show evidence for a collimated jet from the AGN and a nuclear ring with a moderate inclination of i ∼ 55◦
(Hummel et al. 1987;Hummel & Jorsater 1992). The presence of the outflow has already been suggested by the high-velocity dis-persion of the [Fe
ii
] line along the radio jet (Falcón-Barroso et al. 2014). The ring-like structure in Brγ emission in NGC 613, com-prising “hot spots” of current massive star formation (Böker et al. 2008; Falcón-Barroso et al. 2014), indicates an ongoing star-forming episode. We collect the main properties of NGC 613 in Table1.2. Observations
We report the combined ALMA Cycle 3 and Cycle 4 obser-vations of CO(3–2), CS(7–6), HCN(4–3), and HCO+(4–3) and continuum in band 7, at rest frame frequencies νrest of 345.8,
342.9, 354.5, 356.7, and 350 GHz, respectively. The observa-tions of the NUGA sample are described in Paper I; here we include additional details for NGC 613.
In Cycle 3, NGC 613 was observed (project ID: #2015.1.00 404.S, PI F. Combes) simultaneously in CO(3–2), HCO+(4–3), and HCN(4–3) for both the compact (TC, baselines 15 to 630 m) and the extended (TE, baselines 15 to 1400 m) configurations. The largest recoverable angular scale corresponding to the short-est baseline is about 1200. The TC configuration was observed
in April 2016 with 40 antennas and an integration time, includ-ing calibration and overheads, of 20 min, providinclud-ing a synthe-sized beam of ∼000. 38. The TE configuration was observed in
August 2016 with 41 antennas, total integration of 40 min and a synthesized beam of ∼000. 14. The correlator setup, designed
to simultaneously observe three lines, provided a velocity range of 1600 km s−1for each line, but did not center the HCO+(4–3)
and HCN(4–3) lines (200 km s−1 on one side and 1400 km s−1 on the other, which is adequate for a nearly face-on galaxy), and 1800 MHz bandwidth in the continuum.
The Cycle 4 observations were carried out in November 2016 and July 2017 (project ID: #2016.1.00296.S, PI F. Combes) at higher spatial resolution (∼6.5 pc) aiming at resolving the molecular torus. The tuning configuration of Band 7 was in the CO(3–2) and HCO+(4–3) lines and the continuum to avoid a restricted velocity range in the expected broader spectral lines towards the nucleus. The correlator setup was selected to cen-ter the CO(3–2) and the HCO+ lines in the 2 GHz bandwidth. The compact configuration (TM2, baselines 19 to 500 m) was observed with 44 antennas for an integration time of 14 min and a synthesised beam of 000. 31 and the extended (TM1, baselines
19 to 3100 m) was observed with 43 antennas for 1.2 h and a synthesised beam of ∼000. 08.
The phase center of the observations was that of the nucleus (Table1), with a single pointing covering a field of view (FoV) of 1800. The galaxy was observed in dual polarization mode with 1.875 GHz total bandwidth per spectral window, and a chan-nel spacing of 0.488 MHz corresponding to ∼0.8 km s−1, after Hanning smoothing. The flux calibration was done with radio quasars close to the position of the target in the sky, which are regularly monitored at ALMA, and resulted in 10% accuracy.
The data from Cycles 3 and 4 were calibrated and concate-nated with the
CASA
software (version from 4.5.3 to 4.7.2, (McMullin et al. 2007), and the imaging and cleaning were performed with theGILDAS
software (Guilloteau & Lucas 2000). In Paper I, we used only the most extended configurations (TM1+TE), but in this work we have combined all the configu-rations to improve the sensitivity. The analysis was performed inGILDAS
together withpython
packages (radio-astro-tools,APLpy, PySpecKitGinsburg et al. 2015;Robitaille & Bressert 2012;Ginsburg & Mirocha 2011). The
clean
ing was performedusing the Hogbom method and a natural weighting in order to achieve the best sensitivity, resulting in a synthesised beam of 000. 21 × 000. 19 for the concatenated data cube. The spectral line
maps were obtained after subtraction of the continuum in the uv-plane using the tasks
uv_continuum
anduv_subtract
. The data cubes were then smoothed to 10 km s−1 (11.5 MHz). The total integration time provided an rms of 87 µJy beam−1inthe continuum, and 0.43 mJy beam−1 in the line channel maps per channel of 10 km s−1(corresponding to ∼1 K, at the obtained
spatial resolution). The final maps were corrected for primary beam attenuation. Very little CO(3–2) emission was detected outside the full width at half power (FWHP) primary beam.
Due to a lack of very short baselines (<15 m), extended emis-sion was filtered out at scales larger than 1200 in each channel
map. Since the velocity gradients are high in galaxy nuclei, the line measurements are not significantly affected; indeed the size in each velocity channel is not expected to be extended.
3. Results
3.1. Continuum emission
Previous ALMA band 3 and 7 observations byMiyamoto et al.
(2017) detect continuum emission from both the circumnuclear disk (CND) and the star-forming ring (250 < r < 340 pc). At 95 GHz with a ∼000. 6 resolution, these latter authors found a
con-tinuum jet with PA= 20◦, which corresponds to the 4.9 GHz and 14.9 GHz jets (Hummel & Jorsater 1992), close to the minor axis of the ring. In the nucleus, the negative spectral index, α ∼ −0.6, is compatible with synchrotron emission, with a small fraction of free-free emission, while the index α ∼ −0.2 along the star-forming ring could be from free-free emission (Miyamoto et al. 2017).
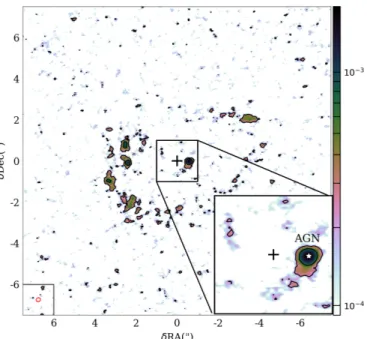
At our resolution of 000. 2 (∼17 pc), the central continuum is
resolved at 350 GHz, with some compact emission along the star-forming ring, as display in Fig.2. The ∼2.2 mJy peak emis-sion is detected at 25σ significance. We determine the peak of the continuum emission by fitting a circular Gaussian source in the uv-plane using the GILDAS
uv_fit
task. The fitted results in the central continuum emission for the flux is 2.4 ± 0.1 mJy and for the RA and Dec relative to the phase center are∆RA = −000. 587 and ∆Dec = −000. 03219, with a relative uncertaintyof ±000. 003. These values are listed as references of the new
adopted center and AGN position in Table1. Within the error bar, the AGN position is consistent with the positions derived byMiyamoto et al.(2017) and from X-ray observations (Liu & Bregman 2005).
3.2. Molecular gas distribution and morphology
Figure 3 displays the CO(3–2) channel maps, with a velocity range of 450 km s−1and a velocity resolution of 10 km s−1. The channels show evidence for a regular velocity field in a ring at a radius ∼3.500(300 pc), with two winding-arm structures com-ing from the NW and SE directions. These spiral arms coincide with the beginning of the dust lanes along the bar seen in the HST/F814W image (Fig.1); they are the contact points between the tangent dust lanes and the ring.
At small radii, there is a spiral structure in the central chan-nels (±100 km s−1) that can be more clearly seen in Fig.4. The two-arm nuclear gas spiral at r . 100 pc is trailing toward the center; this is discussed further in Sect.5. Additionally, the velocity distribution is perturbed for channels in the range ±50– 100 km s−1for r ∼ 150 pc, and the morphology shows evidence
Fig. 2. Continuum emission at 0.87 mm. The central 1500
× 1500
are shown in the main panel, the zoom-in of the central 200
× 200
is shown in the bottom right corner. The cross indicates the phase center, while the white star indicates the new center adopted in Table1. The color scale is in Jy/beam. The beam size (0.2100
× 0.1900
) is shown in the red ellipse in the bottom left corner.
for a filamentary structure connecting the ring and the nuclear spiral.
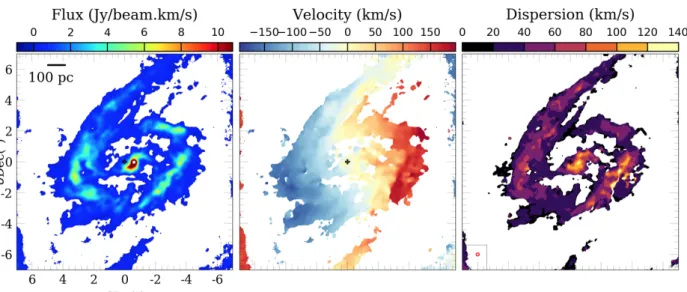
We constructed the moment maps of the CO(3–2) line, clip-ping the emission at <5σrms. The integrated intensity
(zero-moment) map in the left panel of Fig. 4 shows that the CO emission follows the ∼300 pc star-forming circumnuclear ring.
Miyamoto et al. (2017) mapped the ring in CO(1–0) and CO(3–2) with ALMA at 000. 7 and 000. 4, respectively, and found
a clumpy ring that is globally regular but has spots of active and efficient star formation. In our maps at higher resolution, we find that the molecular emission in the ring is clumpy and incomplete, and coincides with the same star forming clumps observed in Br γ in the near-infrared (NIR; seeFalcón-Barroso et al. 2014, and Sect. 3.6). The CO(3–2) emission peak of 25 Jy km s−1beam−1 corresponds to the AGN position reported in Table 1. Within the CND, there is a clear trailing two-arm spiral structure. The ring reveals two breaks into two winding spiral arms, at NW and SE. The main morphological features are shown in the sketch of the galaxy in Fig.5.
We superposed the CO(3–2) contours onto the HST maps in the F814W filter1shown in Fig.1. This reveals a remarkable
sim-ilarity in morphology: the molecular ring seen in the CO emis-sion coincides with the dusty nuclear ring in the HST image, and the winding arms are the beginning of the characteristic dust lanes along the bar. At the very center (.100 pc) however, the stellar and molecular morphologies are dissimilar.
In the middle panel of Fig.4, the intensity-weighted velocity (first-moment) map shows a clear rotation pattern in the galaxy plane, with velocities peaking in the range ∼±200 km s−1 from the systemic velocity (vsys1481 km s−1; see discussion below).
The velocity distribution and morphology in the central 200 pc are more perturbed due to the filamentary streams and the
1 The HST image was aligned to the ALMA astrometry, and the peak
emission in the HST image was recentered to the AGN position in Table1.
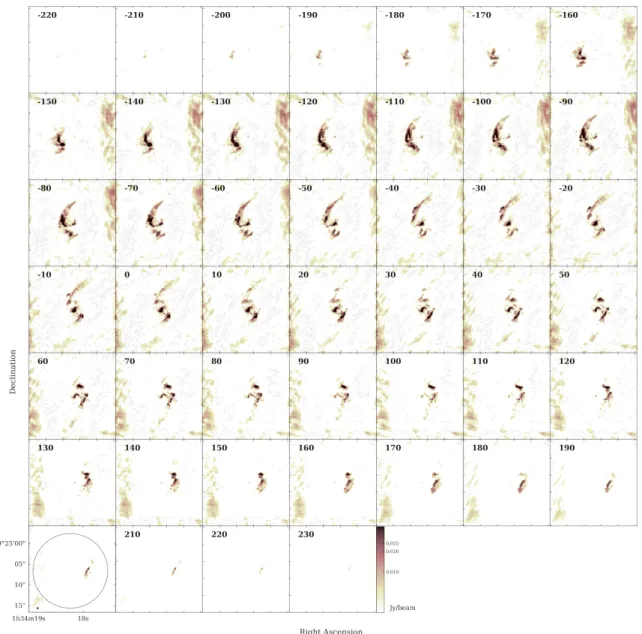
Fig. 3.Channel maps of CO(3–2) emission in the center of NGC 613 using the combined observations from ALMA Cycles 3 and 4. We present the channel maps from −220 (top left) to+230 km s−1(bottom right) relative to the v
sys= 1471 km s−1, in steps of 10 km s−1. Each of the 46 square
boxes is 2100
× 2100
in size, while the primary beam is 1800
in diameter and is indicated in the dashed circle on the bottom left panel. The synthesized beam (000.21 × 000.19, PA = −69◦
) is shown in the black ellipse in the bottom left corner. The center of the maps is the phase center of the interferometric observations given in Table1. The color scale is in power stretch (with a power index of 0.5) ranging between 2 and 38 mJy beam−1.
nuclear spiral. The NW winding arm is mostly blueshifted and the SE redshifted, indicating that rotation and possibly gas pile-up are taking place; this is discussed further in Sect.5.
Close to the AGN, the velocity dispersion is high (σ ∼ 130 km s−1), as displayed in the right panel of Fig. 4
(second-moment map). In the nuclear spiral the velocity dispersion ranges from 70 ∼ 120 km s−1 and the average dispersion along the ring is ∼40 km s−1, with more elevated values in the clumpy
regions. Furthermore, we can distinguish a disturbance in the overdense region in the west part of the ring, with an increased dispersion of &150 km s−1. This region also corresponds to an enhanced spot observed in [Fe
ii
] with SINFONI, suggesting a strongly shocked medium (see also Sect.3.6).3.3. Carbon monoxide luminosity and H2mass
The mean intensity map is plotted in Fig. 4 (left). Since the galaxy is more extended than the primary beam, it is difficult to quantify the missing flux. We compare it to the central spectrum
obtained with the 15 m single dish of the Swedish-ESO Sub-millimeter Telescope (SEST) in CO(1–0) and CO(2–1) over a 4300 and 2200 FoV, respectively. In Fig.6, we display the total CO(3–2) spectrum integrated over the 1800 FoV. Towards the
central position,Bajaja et al.(1995) found a CO(2–1) spectrum peaking at T∗
A = 200 mK with FWHM = 300 km s
−1, yielding a
total integrated flux of 1504 Jy km s−1, in a beam of 2200. Their
beam is very similar to our FoV of 1800. The flux comparison is relevant, since our FoV encompasses the entire nuclear ring, and the emission in this nuclear region corresponds to the strongest surface density at different wavelengths (Comerón et al. 2010;
Ho et al. 2011;Li et al. 2011), as already discussed byCombes et al.(2014).
We assume a ratio of r31 = T3−2/T1−0 of 0.82, typical for
Seyfert galaxies (Mao et al. 2010) and a ratio r21 = T2−1/T1−0
compatible with 1 within the error bars. The latter is derived from the SEST CO(2–1)/CO(1–0) observations in the galaxy center, by convolving the beam of CO(2–1) to 4300, implying a
Fig. 4.CO(3–2) moment maps of NGC 613 in the central 1400
(∼1.2 kpc) FoV. We show the integrated intensity map (0th moment, left), intensity-weighted velocity map (first-moment, middle), and the intensity-intensity-weighted velocity dispersion map (second-moment, right). The black cross indi-cates the phase center and the white star the new adopted AGN position (in Table1). The synthesised beam of 000.21 × 000.19 is shown in red in the
bottom left cornerof the second-moment map.
Fig. 5. Sketch of the main morphological features observed in the CO(3–2) emission in NGC 613. The orientation of the dust lanes fol-lows the large scale bar. The filaments are shown as dashed lines between the ILR star-forming nuclear ring and the nuclear trailing spi-ral. The radio jet is also shown for comparison.
higher CO excitation at the center of NGC 613. This is expected for thermalized excitation and a dense molecular medium. In that case, the CO(3–2) flux should be higher than the CO(2–1), as we could presume the flux Sν ∝ ν2 in the Rayleigh-Jeans approximation for gas at greater temperatures than 25 K and den-sities greater than 104cm−3. Using these values, the expected CO(3–2) intensity is ∼2266 Jy km s−1in a 2200beam. When
inte-grated over the spectral range (FW H M ∼ 250 km s−1), the inte-grated emission in our ALMA FoV of 1800, shown in Fig. 6
is 1307 Jy km s−1. Therefore, we should expect some missing
flux by a factor up to ∼40–50%, taking into account the uncer-tainties of the r31 and r21 ratios. We thus find a molecular
Fig. 6.Total CO(3–2) emission line profile integrated over the observed map, with a FoV of 1800
, after correction for primary beam attenuation. The light blue line is the result of the Gaussian fit with three velocity components (in dark blue); see Table2.
mass of 5.6 × 10⁸M
in our FoV, assuming thermally excited
gas and a Milky-Way-like CO-to-H2 conversion factor of 2 ×
1020cm−2/(K km s−1); see for exampleBolatto et al.(2013).
In comparison, the SEST CO(1–0) observations of Bajaja et al.(1995) give a total molecular mass of 3.8 × 10⁹M
inte-grated over 33 pointing positions covering ∼12000 along the galaxy, and MH2 ≈ 1.5 × 10⁹M . in the central 4300 beam. In
the 2200 beam, the SEST CO(2–1) spectrum, together with the CO(2–1)/CO(1–0) ratio of 1, gives a mass of 1.2 × 10⁹M
.
The total CO(3–2) emission line profile integrated over the observed map (FoV of 1800) is shown in Fig. 6. We decom-posed the spectrum in three components, C1, C2, and C3, and
Table 2. Line fluxes.
Line SCO(3−2) V FW H M Speak(a)
(Jy km s−1) (km s−1) (km s−1) (Jy)
C1 541.1 ± 54.7 −126.3±1.7 95.0 ± 3.6 5.4
C2 654.0 ± 90.7 5.2±5.0 175.5 ± 20.8 3.5
C3 109.1 ± 27.7 146.2±2.8 68.0 ± 8.4 1.5
Notes. Results of the Gaussian fits for the three velocity components (C1, C2 and C3) shown in Fig.6.(a)Peak flux.
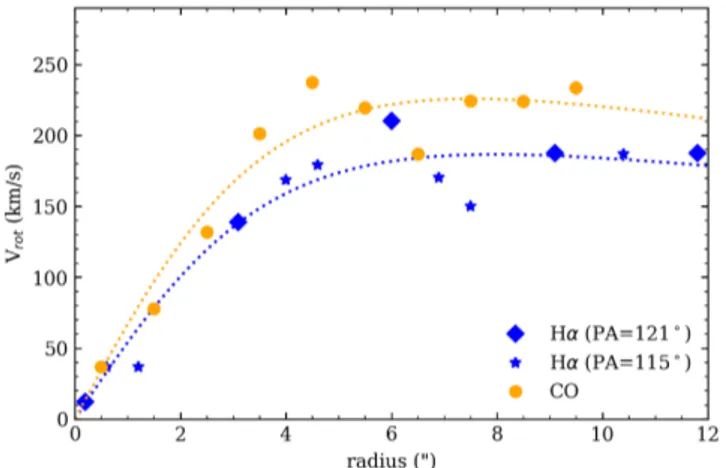
Fig. 7.Rotation curve of NGC 613. The orange circles represent the CO kinematics from our ALMA observations and the blue diamonds and stars are the Hα measurements byBurbidge et al.(1964), for a PA of 121◦
and 115◦
, respectively. The dotted lines are the best fit assuming the gas to be on circular orbits in a plane, vc= Ar/(r2+ c2)p/2.
the results of the Gaussian fits for each component are displayed in Table2. The total flux is SCO(3−2)= 1307 ± 121 Jy km s−1.
3.4. CO(3–2) kinematics
In Fig. 7 we show the rotation velocities deduced from the CO kinematics and the Hα rotation curve taken fromBurbidge et al. (1964). As already pointed out, the dominant feature in the velocity field of the molecular gas appears to be due to circular rotation in the disk (middle panel of Fig. 4), and is consistent with the Hα kinematics. We find good agreement with the PA and inclination from optical studies, in the range of PA= 111 ∼ 124◦ and i= 36 ∼ 47◦ (Burbidge et al. 1964;
Blackman 1981;de Vaucouleurs et al. 1991), and therefore we adopted the values of PA= 120◦ and i= 41◦ listed in Table 1.
We assume a simple model proposed by Bertola et al.(1991) for the rotation curve, assuming the gas is on circular orbits in the plane vc= Ar/(r2+ c2)p/2, where A, c, and p are parameters
of the model, and for p= 1 the velocity curve is asymptotically flat and for p= 3/2 the system has a finite total mass, and there-fore we expect 1 ≤ p ≤ 3/2. Figure7shows the result of fitting the radially averaged velocities to this model; the dotted lines represent the best fit for circular velocity, vc.
We can refine the above fit of the radially averaged velocities by fitting the entire velocity field with the same model byBertola et al.(1991). The observed radial velocity at a position (R,Ψ) on the plane of the sky can be described as
v(R, Ψ) = vsys+
ARcos(Ψ − Ψ0) sin(θ) cosp(θ)
n
R2hsin2(Ψ − Ψ
0)+ cos2(θ) cos2(Ψ − Ψ0)i + c2cos2(θ)
op/2, (1)
where θ is the inclination of the disk (with θ = 0 for a face-on disk),Ψ0is the PA of the line of nodes, vsysis the systemic
veloc-ity, and R is the radius. We used the tilted-ring model (Rogstad et al. 1974), which consists in dividing the velocity field into con-centric rings in radii∆r, with each ring being allowed to have an arbitrary vc, i, and PA. For each radius, we can independently fit
the parameters of Eq. (1) to the observed velocity field.
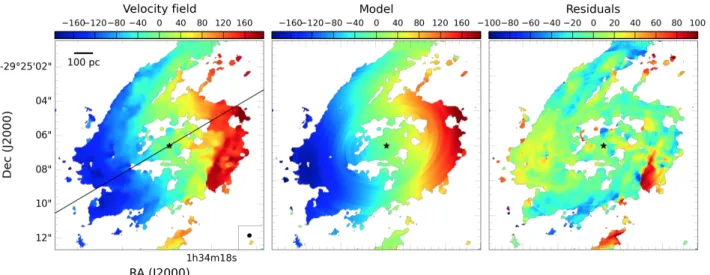
We show the results of the fitting of the tilted-ring to the velocity map in Fig.8. We adopted a∆r = 000. 3, which
corre-sponds to the deprojected resolution of our observations in the galaxy plane. In the right panel, we display the residuals after subtracting the Bertola et al. (1991) model from the velocity field. As can be seen, the model represents the observed veloc-ity field relatively well, with no significant amplitudes in the residuals along the galaxy disk, except in the west part of the ring where there is an important contribution from noncircular motions. This region coincides with the contact point between the ring and the SE winding arm, and it is also probably per-turbed by shocks, as suggested by the high-velocity dispersions in the molecular gas and an enhancement in the [Fe
ii
] emission (Fig.13). These noncircular motions along the minor axis and on the winding spiral indicate streaming motions associated with inflow, if we assume both trailing perturbations and that the north side is the far side of the galaxy, as the NW arm is blueshifted and the SE arm is redshifted.An additional method was used to derive the CO kinemat-ics using the “3D-Based Analysis of Rotating Objects from Line Observations” (3DBAROLO) software by Di Teodoro &
Fraternali(2015).3DBAROLO performs a 3D tilted-ring mode-ling of the emission line data cubes to derive the parameters that best describe the kinematics of the data. We ran 3DBAROLO on the CO(3–2) data-cube in order to investigate non circular motions, since the code allows us to infer radial velocities in the fit of the rotation curves. We performed several tests run-ning the code, varying the fixed and free parameters of the disk model, and the results that better reproduce the observed velocity field are found when fixing the PA, the inclination, and the cen-tral position to 120◦, 41◦, and the position of the AGN, respec-tively. The best fit reveals radial components of the order of vrad ∼20 km s−1 in the nuclear region and vrad ∼20–100 km s−1
from the end of the circumnuclear ring at 400up to r ∼ 700,
corre-sponding to the streaming motions of the winding arms. Overall, we find that in the case of high-resolution ALMA observations, the results using3DBAROLO are relatively coherent with the 2D
approach described above.
The position–velocity diagrams (PVDs) along the major (PA= 120◦) and minor axis (210◦) of NGC 613 are shown in Fig.9. The best fit obtained with3DBAROLO including radial
velocity components is shown in dashed lines. We notice highly skewed kinematics in the center, with velocities &200 km s−1
that cannot be described only by co-planar circular motions in the galaxy disk. Since the velocities in the very center (.0.500) strongly deviate from the rotation curve pattern, we believe this is the signature of an outflow emanating from the AGN. We dis-cuss the detection and properties of the molecular outflow in Sect.4.
3.5. Dense gas: HCO+, HCN, and CS emission
In ALMA band 3, dense gas is detected in various lines, namely HCN(1–0), HCO+(1–0) and CS(2–1), while SiO(2–1) was marginally detected at the edges of the radio jets, probably indicating the existence of shock regions related to the jets, as reported byMiyamoto et al.(2017). Along with CO(3–2), our
Fig. 8.Left: velocity map of NGC 613 clipped at >5σ. Middle: best-fit model using the tilted-ring approach for theBertola et al.(1991) model. Right: residuals after subtracting the model from the data. The line in the left panel indicates the average estimated major axis PA= 120◦
and the black stars are the central positions adopted as the AGN position. The synthesized beam is shown as a black ellipse in the bottom right corner of the left panel.
Fig. 9.Position–velocity diagrams of NGC 613 for the CO(3–2) emis-sion along the major axis at a PA= 120◦
(top panel) and minor axis (PA= 210◦
, bottom). We used a 000.2 slit width. The blue contours are
from 1σ to 64σ, and follow each other by factor-two multiplication. The red dashed lines are the best fit from3DBAROLO. The emission
around v ∼ 400 km s−1corresponds to the isotope H13CN(4–3).
band 7 observations detected the HCO+(4–3), HCN(4–3), and CS(7–6) emission lines. The corresponding maps are displayed in Fig.10, and the integrated spectra in Fig. 11. The CS(7–6)
line is mainly detected in the center of the galaxy, while for HCO+(4–3) and HCN(4–3), we detect stronger emission in the center but also some clumps along the star-forming ring. The dense gas tracers detected in the very center are interpreted as a molecular torus, as discussed in Paper I. The HCN line is about twice brighter than the HCO+line in the nuclear region, which is the typical value expected for an AGN (e.g.,Kohno et al. 2005;
Krips et al. 2008;Imanishi et al. 2016). The detection of these lines reveals the presence of dense gas, since the critical densi-ties of the HCO+(4−3), HCN(4–3), and CS(7–6) transitions are 2.6 × 10⁶, 1.4 × 10⁷, and 3.4 × 106cm−3, respectively.
As already mentioned, NGC 613 exhibits different ionization mechanisms. Recently, spatially resolved Baldwin, Phillips, & Terlevich (BPT) diagrams (Baldwin et al. 1981) were able to isolate the contributions from star formation, shock excitation, and AGN activity using optical line ratios, as studied with the Siding Spring Observatory Wide-Field Spectrograph (WiFeS) by Davies et al. (2017) and the European Southern Observa-tory Multi-unit Spectroscopic Explorer (MUSE) inGadotti et al.
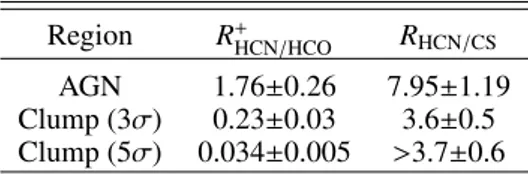
(2019). Likewise, in the submillimeter domain, multi-line obser-vations of higher J transitions are fundamental for the derivation of the chemical conditions of the molecular gas and the heating mechanisms (Viti et al. 2014;Imanishi et al. 2018). One useful extinction-free energy diagnostic tool in the centers of galaxies is the submillimeter–HCN diagram (Fig.12) proposed byIzumi et al.(2016). The diagram uses the HCN(4–3)/HCO+(4–3) and HCN(4–3)/CS(7–6) ratios to distinguish the dominant energy source exciting the molecular gas in galaxies, whether by an AGN (XDR or X-ray-dominated region) or star formation (PDR or photodissociation region). The authors suggest enhanced inte-grated intensity ratios in circumnuclear molecular gas around AGN compared to those in starburst galaxies (submillimeter HCN enhancement).
Thanks to our high-resolution ALMA observations, we are able to disentangle the emission coming from the nuclear region within the spiral trailing feature observed in the central ∼100 pc and the contribution from a star-forming clump observed in all three molecular tracers at ∼250 pc from the nucleus. The clump is indicated as a circle in Fig.10. We measured the line intensity ratios R+HCN/HCOand RHCN/CSin these two regions (CND/AGN,
Fig. 10.Integrated intensity maps of the dense gas tracers HCN(4–3), HCO+(4–3), and CS(7–6) in the panels from left to right, with the CO contours overplotted. HCN and HCO+present clumpy emissions along a radius of ∼300
, coinciding with the star-forming ring. All the dense gas tracers are detected in the very center as nuclear compact decoupled disks, or molecular tori as discussed in Paper I. The purple circles indicate the position of a clump detected in the HCN, HCO+, and CS emission and used to calculate the ratios in the submillimeter diagram in Fig.12. The synthesized beam sizes are shown in red in the bottom left corner of each panel.
Fig. 11.HCN(4–3), HCO+(4–3), and CS(7–6) emission line profiles (from left to right) integrated along our FoV, using the mask from the zero-moment map in Fig.10. The integrated values fitting a Gaussian are listed in Table2.
Fig. 12.Submillimeter–HCN diagram proposed byIzumi et al.(2016) for the high-resolution observations (spatial resolution <500 pc) using the line intensity ratios R+HCN/HCOand RHCN/CS. The red circles represent
the measurements of galaxies hosting an AGN and the blue squares indicate the ratios found in starburst galaxies. We include the line ratios of NGC 613 (diamonds) measured in the CND, referred to here as AGN and in a clump detected ∼250 pc northeast of the central position in all the dense tracers shown in Fig.10.
Table 3. Line ratios: R+HCN/HCOand RHCN/CS.
Region R+HCN/HCO RHCN/CS
AGN 1.76±0.26 7.95±1.19
Clump (3σ) 0.23±0.03 3.6±0.5
Clump (5σ) 0.034±0.005 >3.7±0.6
Notes. Ratios of the HCN, HCO+, and CS lines in the CND region and in the clump shown in Fig.10.
For a 5σ threshold, the clump is barely detected in CS(7–6) emission, and we present the line ratios for a 3σ clump detec-tion and an upper limit for the RHCN/CS.
The line ratios are plotted on the submillimeter diagram of
Izumi et al.(2016), as displayed in Fig.12. We find that the CND region lies in the AGN-dominated part of the diagram, while the clump in the star-forming ring of NGC 613 is indeed dominated by star formation. Ultimately, we do find that the nuclear region of NGC 613 presents line ratios that indicate excitation condi-tions typical of XDRs in the vicinity of AGN. However, the line ratios in the center could also be explained by shocks driven by the radio jet entraining the gas, as HCN can become enhanced in
Fig. 13.Comparison between the CO(3–2) emission, shown in contours, with the [Fe
ii
] (left), Brγ (middle), and H2λ2.12µm (right) emission inthe 800
× 800
FoV of the SINFONI observations (Falcón-Barroso et al. 2014). The black and white star represents the AGN position listed in Table1.
shocks and this scenario is also suggested by the [Fe
ii
] enhance-ment discussed in Sect.3.6.3.6. Comparison to the warm molecular and ionized gas In order to compare the CO(3–2) morphology with the ionized material and the warm molecular gas, we superposed the CO contours onto the NIR maps of [Fe
ii
], Brγ, and H2λ2.12µmpre-sented inFalcón-Barroso et al.(2014), shown in Fig.13. There is a remarkable resemblance between the ionized and warm molec-ular gas and the CO emission along the star forming ring. The positions and ages of the hot spots in the ring suggest a “pearls on a string” scenario of evolution of star formation as proposed by Böker et al. (2008). In this scenario, star formation only occurs in particular overdense regions and the young clusters move along the ring, following the gas movement, and simul-taneously age, resulting in an age gradient along the ring. The expected sequence of star formation was indeed observed in the southern part of the ring: the hottest stars are found near the con-tact point of the dust lanes, and then fewer hot stars are found along the ring (see Fig. 8 ofBöker et al. 2008).
The CO(3–2) emission presents lower intensities in the star-forming hot spots at the contact points of the winding arms and the ring, corresponding to the hottest and youngest star-clumps traced by the HeI emission in Fig. 8 ofBöker et al.(2008). This anti-correlation can be expected between the SFR and the gas sur-face density on small scales (<200 pc), since the gas has probably been consumed in the formation of new stars and the Kennicutt-Schimidt law (Schmidt 1959;Kennicutt 1998a) breaks down on scales of giant molecular clouds (Onodera et al. 2010). However, we do observe some dense clumps in HCO+and HCN emission, corresponding to other less hot regions of HeI emission (blue regions in their Fig. 8), indicating that some dense material is still being consumed in the southeast and northern part of the ring.
At the center, the nuclear spiral corresponds to the massive reservoir of the bright warm H2 and [Fe
ii
], while contrastingwith the weak emission in Brγ. Indeed, as discussed by Falcón-Barroso et al.(2014), the high [Fe
ii
]/Brγ ratio in the center indi-cates that excitation is dominated by shocks and photoionization in the nucleus, and follows the correlation between the strength of the [Feii
] and 6 cm radio emission in Seyfert galaxies (Forbes & Ward 1993).The high values of the ratio [Fe
ii
]/Brγ = 17.7 in the nucleus of NGC 613 are not typical of starburst galaxies, where we expect the ratio to be in the range 0.5–2 (Colina et al. 2015) and the [Feii
]Fig. 14.Diagnostic diagram with the NIR emission line ratios H2(1–0)
S(1)λ2.122 µm/Brγ and [Fe
ii
] λ1.644 µm/Brγ proposed byColina et al.(2015). Apertures in the circumnuclear ring are shown with blue cir-cles and the aperture from the nuclear region is shown by a gray dia-mond. Contours denote regions for young star formation, supernovae, and compact AGN, while solid lines denote upper limits for young star formation and AGN, both derived from integral field spectroscopy data (Colina et al. 2015). Dashed lines denote upper limits for star formation and AGN derived from slit spectroscopy (Riffel et al. 2013).
emission originates in supernova-driven shocks. Indeed, the large ratio in the nucleus is similar to those found in AGN, indicat-ing that the most likely mechanism for the production of [Fe
ii
] emission is shock excitation from the radio jets and/or super-nova remnants typical of Seyfert galaxies (Rodríguez-Ardila et al. 2004). It is well-known that X-ray emission, which is dominant in Seyferts, can penetrate deeply into atomic gas and create extended partly ionized regions where [Feii
] can be formed. Models pre-sented byAlonso-Herrero et al.(1997) show that X-rays are able to explain [Feii
]/Brγ ratios of up to ∼20, in agreement with the values observed in the NGC 613 nucleus.Colina et al.(2015) developed a 2D diagnostic diagram using integral field spectrograph data to characterize line-emitting regions. The diagnostic uses the line ratios H2(1–0)S(1)
λ2.122 µm/Brγ and [Fe
ii
] λ1.644 µm/Brγ. Using this method, these latter authors found that young star-forming regions, older supernova-dominated regions, and the compact AGN-dominatedregion occupy different areas in the line-ratio space. We show the NIR diagnostic diagram proposed by Colina et al. (2015) in Fig. 14. We use the line emission listed in Tables 1 and 2 of Falcón-Barroso et al.(2014) for different apertures: one in the nucleus, seven along the circumnuclear ring (spots 1 to 7), and one aperture between the ring and the nucleus (spot 8; see Fig. 1 ofFalcón-Barroso et al. 2014). Placing the line ratios for the different apertures in the diagrams, we note that all spots in the circumnuclear ring are located in the regions of young star formation or SNe-dominated stellar populations. The spot in the intermediate region has higher line ratios, and is shifted into the compact AGN region. On the other hand, the nucleus of NGC 613 takes its place in the shock ionized LINER regime, where we expect H2/Brγ ratios greater than six (Mazzalay et al.
2013;Riffel et al. 2013). As suggested byFalcón-Barroso et al.
(2014), the enhancement of the H2 emission in the nucleus is
possibly due to the interaction with the radio jet. The high value of H2/Brγ measured in the nucleus of NGC 613 is consistent
with a LLAGN Seyfert/LINER composite, which is strongly influenced from shock heating.
4. Molecular outflow
4.1. The CO(3–2) kinematics of the outflow
The PVDs along the major and minor axes of the galaxy shown in Fig. 9 illustrate the highly skewed kinematics in the cen-tral part of NGC 613. The nuclear region contains gas reaching velocities up to ∼±300 km s−1 in projection, which is much higher than the rest of the nuclear disk gas, as we can see in the middle panel of Fig.4.
Examination of the individual spectra at pixels around the AGN position reveals conspicuous blue- and redshifted wings in all the spectra within a radius of r ∼ 0.300. These broad line
wings are characteristic of gas ejection out of equilibrium; in this case an indication of a molecular outflow. The integrated spec-trum extracted in a central circular aperture of 0.2800 (∼23 pc)
is shown in Fig.15. We can see a bump in the emission around v ∼ 400 km s−1, which corresponds to the isotope H13CN(4–3).
One might question whether the outflow signature could instead arise from a central mass able to induce such fast rotation in the center. If we assume that these high-velocity components are within the SoI, in a radius equivalent to our nuclear aper-ture of ∼0.300 = 25 pc, or about r = 38 pc in the galaxy plane, a
massive black hole located in the center should have a mass of at least MBH= v2R/G for the rotational velocity in the galaxy plane
v = 460 km s−1(corresponding to ±300 km s−1projected
veloci-ties), or MBH = 1.9 × 10⁹M . This value is about two orders of
magnitude higher than the values reported in the literature; for example, MBH = 7.4 × 10⁶M derived byDavis et al. (2014)
using the spiral pitch angle and MBH = 4 × 10⁷M using the
central stellar velocity dispersion by van den Bosch(2016). In Paper I, we derived a BH mass of MBH = 3.7 × 10⁷M within
the SoI of 50 pc, and for the whole NUGA sample the values derived tend to follow the pseudo-bulge region in the MBH−σ
plane (Ho & Kim 2014).
Furthermore, if these high-velocity features were due to the rotation, they would not be observed along the minor axis of the galaxy; however, the PVDs in Fig. 9 clearly show a gra-dient of high-velocity emission along the minor axis that can-not be explained as being due to co-planar rotation. Could these features be a signature of inflowing gas? We cannot exclude a priori that the high-velocity components are due to a coplanar inflow, since the blueshifted gas is observed in the north and the
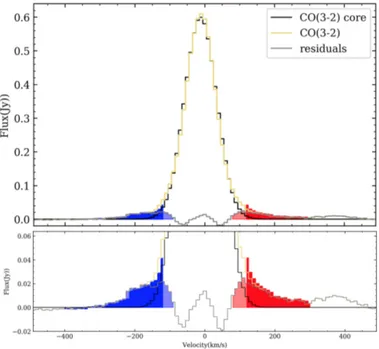
Fig. 15.Top panel: nuclear CO(3–2) spectrum in yellow, extracted in a 000.28 region. We fit a Gaussian that takes into account the main disk
(or “core”) contribution to the CO emission and subtract this from the observed spectrum (residuals in gray). The regions considered in the computation of the molecular outflow properties in the blue and red wings are shown in color. Bottom panel: zoom view of the blue (−400 to −120 km s−1) and red (120 to 300 km s−1) wings. The red wing is
integrated only up to+300 km s−1to avoid the contamination from the
H13CN emission at ∼400 km s−1.
redshifted gas is seen in the south. If the far side of the galaxy is the north side, this gradient could be explained as an inflow. However, the deprojected velocities onto the galaxy disk would be v ∼ 300/sin(i) ∼ 460 km s−1; the order of magnitude of the co-planar inflow would thus be too large, and therefore we can exclude this hypothesis.
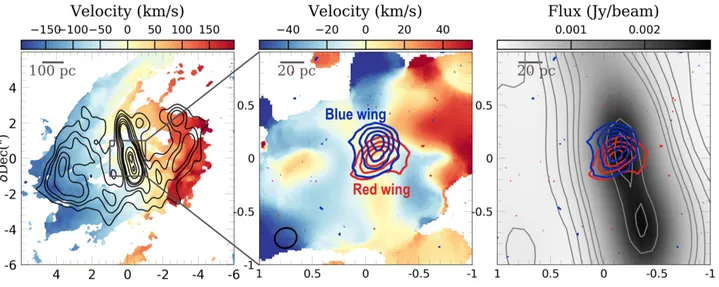
Additionally, in Fig. 16we show the contours for the blue and red wing emission, and we see that the contours overlap, the blue component arises in the northern part of the nucleus, and the red component in the south. Due to the small size of the outflow, we can barely resolve each wing contribution. However, there is an indication that they do not follow the rotation pattern of the mean velocity field. The direction of velocities are also opposite to what is found in the molecular torus (cf. Paper I).
We compare the molecular to the radio emission observed with the Karl G. Jansky Very Large Array (VLA) at 4.86 GHz (Hummel & Jorsater 1992) in Fig.16. The VLA radio jet emis-sion is shown in the right panel with the molecular outflow blue and red wing emission contours overplotted. The molecular out-flow emission coincides with the central blob of the radio jet and appears to be aligned with the orientation of the radio jet at PA= 12◦.
In order to derive conservative values for the flux related to the outflow in the broad emission, instead of fitting one Gaus-sian component for the “core” and one broad component for the outflow (including some low-velocity emission that might not be associated with the outflowing material), we have taken two different approaches. First, we fitted a Gaussian to the nuclear spectrum to take into account the contribution of the main rotat-ing disk (black line in Fig.15). The residual spectrum is shown by the gray line, after subtracting the core contribution from the CO spectrum. We then integrated the contribution of the blue and
Fig. 16.Left: velocity distribution of the CO(3–2) emission, as presented in Fig.4, with the VLA radio contours at 4.86 GHz over-plotted. Middle: 200
× 200
zoom of the velocity distribution and the emission contours of the blue and red wings shown in Fig.15. The synthesized beam is shown in black in the bottom left corner. Right: grayscale and contours of the 4.86 GHz radio emission and the contours of the blue and red wings. The direction of molecular outflow is aligned with the radio jet, and spatially corresponds to the central blob of the radio map.
Table 4. Gaussian fit in the nuclear spectrum.
Component SCO Position FW H M Speak
(Jy km s−1) (km s−1) (km s−1) (mJy)
Core(a) 68.5 ± 1.1 −11.8 ± 0.4 107.2 ± 0.9 600
SCO Velocity range Speak
(Jy km s−1) (km s−1) (mJy)
I
ntegrated
Residual
Wings
Blue 2.63 ± 0.8 [−400,−90] 21.8
Red 2.62 ± 0.9 [+80,+300] 24.9
I
ntegrated
Residual
Wings
Blue 2.3 ± 0.8 [−400,120] 41.5(b)
Red 2.3 ± 0.9 [+120,+300] 41.7(b)
Notes.(a)Results of the Gaussian fit for the main disk contribution of
the nuclear spectrum extracted in a r= 0.2800
aperture shown in Fig.15.
(b)In this case we assumed that S
peakis the maximum flux in the nuclear
spectrum within the selected velocity range of the blue and red wings.
red regions in the residual spectrum. The results of the fit of the main core and blue and red wings in the residuals are listed in Table4. The derived molecular mass corresponding to the main disk component inside the radius of 23 pc is 4.8 × 10⁷M
, which
agrees with the mass of the 14 pc molecular torus of 3.9×10⁷M
found in Paper I (using the same conversion factor and r31as in
Paper I).
The second approach consists in creating moment maps only taking the velocity channels from −400 to −120 km s−1for the
blue component and from+120 km s−1to 300 km s−1for the red wing. We try to avoid the contribution from the H13CN by
limit-ing the velocity channels up to 300 km s−1. We display the blue and red wing contour maps in Fig. 16, superimposed over the intensity weighted velocity map of the original CO map, which represents the mean velocity pattern. The integrated fluxes cor-responding to velocity intervals of the red and blue maps are also listed in Table4. The peak temperatures of the blue and red wings represent ∼5% of the peak of the main core component,
however they are still detected with a 50σ significance in the case of the wings in the residuals.
The maximal velocities of the red and blue components are up to about ±300 km s−1 in projection (∼460 km s−1 if in the
galaxy plane, i= 41◦). Given their location near the nucleus, we tentatively interpret these high-velocity features as the two sides of an outflow. Globally, these features represent as much as.8% of the total molecular emission in the nuclear ring region. 4.2. CO-to-H2conversion in the nuclear region of NGC613
From the integrated flux, SCO∆V(Jy km s−1), listed in Table4,
we can derive the molecular mass involved in the outflow using the equation fromSolomon & Vanden Bout(2005):
L0CO(K km s−1pc−2)= 3.25 × 10⁷SCO∆V 1+ z DL νrest !2 , (2)
where νrest = 345.796 GHz, and DL is the luminosity
dis-tance in Mpc. The molecular mass, including helium, is then derived from M(H2) = αCOL0COr13 (Tacconi et al. 2013). This
implies a molecular mass of Mout = 1.9−2.2 × 10⁶M . This
mass was obtained using r31 = 0.82, a luminosity distance of
17.2 Mpc, and the standard Galactic CO-to-H2conversion factor
(αCO,MW = 4.36 M (K km s−1pc2)−1 Dame et al. 2001;Bolatto
et al. 2013). However, this mass could be an upper limit if the flow is made of more diffuse optically thin gas.
The standard αCO = 4.36 for the Milky Way is the
recom-mended value to use in the inner disks of galaxies. However, sev-eral observational works (e.g.,Israel 2009a,b;Sandstrom et al. 2013) found that in the center of galaxies (R. 1 Kpc) the con-version XCOcan be up to three to ten times lower than XCO,MW.
As pointed out byBolatto et al.(2013), the recommended value to be applied in galaxy centers is αCO,cen ∼ 14αCO,MW, with a
0.3 dex uncertainty. In our case, the masses involved in the out-flow would be four times lower, that is, in the range of Mout =
4.8−5.5 × 10⁵M
, providing a more conservative estimative of
the mass.
The assumption of a smaller αCOhas already been discussed
1
4αCO,MW factor was also assumed (García-Burillo et al. 2014),
in agreement with the Large Velocity Gradient (LVG) approx-imation analysis of the CO line ratios in the central region of this galaxy (Usero et al. 2004). Another example is the molecu-lar outflow detected in M 51, where the authors assumed αCO=
1
2αCO,MW (Querejeta et al. 2016; Matsushita et al. 2007). In
a study of molecular gas excitation in the jet-driven winds of IC 5063,Dasyra et al.(2016) found that the outflowing molecu-lar gas is partly optically thin, implying a αCOthat is one order
of magnitude smaller than that of the Galaxy.
Most molecular outflows are detected in ultra-luminous infrared galaxies (ULIRGs; Cicone et al. 2014). Therefore, the CO-to-H2 conversion factor usually assumed in the literature is
αCO = 0.8, approximately five times lower than the Milky Way
factor αCO,MW. Since NGC 613 has a rather moderate IR
lumi-nosity (LIR= 3×10¹⁰L ), there is no reason a priori to adopt the
lower factor applied to ULIRGs. In fact, we would like to high-light that uncertainties in αCOimpact the comparison of scaling
factors between outflows and host galaxies properties (e.g.,Fiore et al. 2017;Fluetsch et al. 2019) by a factor of approximately five.
4.3. Mass outflow rate
To estimate the mass outflow rate, along with the observational quantities (outflow mass Mout, size Rout and velocity vout), we
need to assume a certain geometry. FollowingFiore et al.(2017) andCicone et al.(2014), for a spherical or multi-conical geom-etry, in which the outflowing clouds are uniformly distributed along the flow, the mass outflow rate ˙Mout can be calculated
as: ˙
Mout = 3vout(Mout/Rout). (3)
If instead we assume a time-averaged thin expelled shell geometry (Rupke et al. 2005b), also adopted in the study of molecular outflows in the local Universe (Veilleux et al. 2017;
Fluetsch et al. 2019), we have ˙
Mout = vout(Mout/Rout), (4)
which corresponds to the outflow mass averaged over the flow timescale, tflow = Rvout
out. The difference in the mass loading
fac-tor between the two proposed scenarios for the outflow geom-etry is a factor three times larger in the multi-conical/spherical description.
In the following estimates, we use Eq. (4) to derive more conservative outflow energetics, since the observations cannot constrain the geometry, and we are not able to favor one scenario over the other.
As discussed in Sect.4.1, the outflow is found in a region of Rout = 000. 28 (∼23 pc) and here we consider the maximum
projected velocity of the wings, vout = 300 km s−1. If the
out-flow direction is between the observer line of sight and the galaxy plane, even assuming the maxima projected velocities, the de-projected velocities will encompass the adopted value, and therefore vout= 300 km s−1is a conservative value. The flow
timescale is consequently tflow ∼ 104yr, which is comparable to
the timescales of the BH growth-burst episodes of nuclear activ-ity, with a duration of 104−5yr (Wada 2004).
For an outflow mass of Mout= (1.9−2.2)×106M (assuming
the standard αCO,MW), we find a mass outflow rate of ˙Mout =
(25 − 29) M yr−1. If instead, we use the mass derived assuming
the typical values for galaxy centers, αCO = 14αCO,MW, we find
that the mass load rate is ˙Mout∼ 7 M yr−1.
Fig. 17.Nuclear spectra extracted in an aperture of r ∼ 0.2800
around the AGN position for HCN(4–3) (top), HCO+(4–3) (middle), and CS(7–6) (bottom). The dense gas spectra were multiplied by a factor to scale with the CO(3–2) emission in order to compare their wing profiles.
4.4. The nuclear molecular outflow in dense gas tracers We also detected the presence of broad wings in the nuclear spectrum of dense gas tracers HCN(4–3), HCO+(4−3), and CS(7−6), as indicated in Fig.17. We also show the CO nuclear spectrum for comparison, and the high-velocity components cover the same velocity width of the CO wings (±300 km s−1).
We find that the ratio between the peak fluxes for the main core in the dense gas and CO are ∼5, ∼8.5, and ∼36, for HCN(4–3), HCO+(4−3), and CS(7–6), respectively. We also see some indi-cation in Fig.17that, at least for HCN(4–3) and CS(7–6), the line ratios of the blue wings tend to be higher than the core.
In order to quantify the line ratio in the core and wings, we show the HCN(4–3)/CO(3–2) along the nuclear spectra in Fig.18. The ratio is shown up to velocities of+200 km s−1due to the tuning of Cycle 3 described in Sect.2. The core component, defined by the disk rotation with velocities up to ±100 km s−1,
has a ratio of about 0.2 and the ratio increases for the high velocities towards the wings, up to values of ∼0.6, suggesting an enhancement of HCN in the outflow. As discussed in Sect.3.5, from analysis of the dense gas ratios in the submillimeter-HCN diagram (Izumi et al. 2016) in Fig. 12, the nuclear region of NGC 613 presents excitation conditions typical of XDRs in the vicinity of AGN. However, we find evidence that the HCN in the outflow can be three times higher than the values found in the nuclear CND.
A similar trend was also reported in the molecular outflow of the QSO galaxy Mrk 231. The detection of the outflow in
Fig. 18. HCN(4–3)/CO(3–2) ratio in the nuclear spectra. The ratio is shown up to velocities of +200 km s−1 due to the tuning of Cycle 3
described in Sect.2. We can see that in the core, the ratio is ∼0.2 and increases towards the wings up to values of ∼0.6, indicating that the outflow is entrained mostly in a dense gas (n& 104cm−3), as discussed
inAalto et al.(2012).
HCN(1–0) byAalto et al.(2012) covers the same velocity range (±750 km s−1) of the CO(1–0) outflow (Feruglio et al. 2010), and
they found a high ratio of the HCN/CO∼0.3–1 in the outflow, higher than in the line core. The HCN is enhanced in the line wings by factors of between two and five, and they suggest that the outflow is mostly entrained in dense gas n& 104cm−3, which
is consistent with the molecular gas being compressed and frag-mented by shocks (Aalto et al. 2012). High-resolution observa-tions of HCN and HCO+ in the higher J = 3 → 2 transition exhibit prominent, spatially extended line wings for HCN(3–2) in Mrk 231 (Aalto et al. 2015). In Mrk 231 there were no line wings detected in HCO+(3–2), while in NGC 613, there is some indication of high-velocity gas. The HCN(4−3)/HCO+(4−3) ratios in the core are approximately equal to two, while in the wings can be two to three times higher, similar to what is found in Mrk 231 using the HCN(1–0)/HCO+(1–0) ratios (Lindberg et al. 2016).Aalto et al.(2015) claimed that the ele-vated HCN abundance in the outflow is possibly caused by high temperatures in the X-ray-irradiated gas regions surrounding AGN (Harada et al. 2013).
Another possibility to explain the HCN enhancement in the outflow of NGC 613, is that the HCN emission stems from shocks potentially originating from the interaction of the ouflow-ing gas with the radio jet. The fact that the molecular outflow is spatially aligned with the central blob of the radio jet detected by
Hummel & Jorsater (1992) (see Fig.16), a region where there is evidence of shock excitation as discussed in Sect. 3.6, cor-roborates this scenario. A further detailed analysis of the line ratios for the whole NUGA sample will be discussed in a future paper.
4.5. Driving mechanism: AGN or star formation?
The origin of the outflow might be related to star formation, which is concentrated in the nuclear ring region. The SFR can be estimated from the IR luminosity and the calibration from
Kennicutt(1998b). From the IRAS fluxes, the IR luminosity is LIR = 3 × 10⁹L (Table 1, Sturm et al. 2002), and the total
SFR is equal to 5.3 M yr−1. Based on the Hα luminosity
asso-ciated with star formation in the central 3 × 3 kpc measured by
Davies et al.(2017), L(Hα)SF= 5.28 × 1041erg s−1, we can also
deduce, from Kennicutt’s calibration, SFR= 4.1 M yr−1, which
is consistent with the estimate from IR luminosity. If we iso-late the contribution only coming from the circumnuclear star-forming ring, the SFR estimated is SFR= 2.2 M yr−1in the ring
of r . 400 pc (Mazzuca et al. 2008). Evidence of young star-forming regions in the “hotspots” along the ring has recently been found byFalcón-Barroso et al.(2014). However, the value reported for NGC 613 in the nuclear region of r ∼ 40 pc in aper-ture is very low: SFR∼ 0.015 M yr (Falcón-Barroso et al. 2014).
This low value could be due to extinction factors or a possible AGN contribution. The same nuclear region has a large reser-voir of warm molecular gas (e.g., see Fig.13), also found in other Seyfert galaxies (Hicks et al. 2013).Falcón-Barroso et al.(2014) suggest a cyclical episode of starburst about ∼10 Myr ago, fol-lowed by another episode of nuclear activity.
We estimate a mass rate of ˙Mout ∼ 27 M yr−1for the nuclear
molecular outflow. Although this estimate is uncertain by a fac-tor of a few given the unknown projection and the assumptions previously discussed in the text, the SFR in the nuclear region is about three orders of magnitude lower than ˙Mout. In general,
galactic winds driven by starbursts correspond to mass-outflow rates of the same order as the SFR (e.g.,Veilleux et al. 2005). Given the discrepancy between the SFR in the nuclear region and the mass-load rate of the outflow, we conclude that star for-mation alone is not able to drive the nuclear molecular outflow in NGC 613.
It has already been established that the mass-outflow rate increases with the AGN luminosity, supporting the idea of a luminous AGN pushing away the surrounding gas through a fast wind. Previous observational studies (Cicone et al. 2014;
Carniani et al. 2015; Fiore et al. 2017) have shown that the molecular outflow properties are correlated with AGN lumi-nosity, where the outflow kinetic power corresponds to about 5%LAGN and the momentum rate is ∼20LAGN/c, in agreement
with theoretical models of AGN feedback (Faucher-Giguère & Quataert 2012;Zubovas & King 2012). For a sample of molec-ular and ionized outflows,Carniani et al.(2015) found that the ionized gas only traces a small fraction of the total gas mass, suggesting that the molecular phase dominates the outflow mass. This trend is also found by Fiore et al. (2017), but the ratio between molecular and ionized mass-outflow rates is reduced at the highest AGN bolometric luminosities. Nevertheless, these latter authors analyzed different samples of galaxies, and this conclusion could be affected by selection bias.
From XMM-Newton observations of NGC 613, Castangia et al.(2013) reported an X-ray luminosity of log LX(2−10 keV)=
41.3 erg s−1. Applying a bolometric correction fromMarconi et al.
(2004) gives an AGN bolometric luminosity of LAGN,X = 1.7 ×
1042erg s−1. The bolometric luminosity derived byDavies et al.
(2017) using the [O
iii
] emission associated only with the AGN contribution, traced as an extended ionization cone aligned with the radio jet, is LAGN,[Oiii] = 4 × 1042erg s−1. If we include theshock and star forming contributions of the total O[
iii
] emission, we obtain Lbol,[Oiii] = 3.75 × 1043erg s−1. The shock contributionmost likely arises from the radio jet launched by the AGN, but here we cannot disentangle the contribution from star formation; the latter probably overestimates the bolometric AGN luminosity, while the former probably sets a lower limit.
In a recent study,Fluetsch et al.(2019) identified 45 molecu-lar outflows in the local Universe using previous results from the literature and new detections from ALMA archive. These lat-ter authors propose an even tighlat-ter empirical relation between the mass-outflow rate and the SFR, stellar mass, M∗, and the
![Fig. 13. Comparison between the CO(3–2) emission, shown in contours, with the [Fe ii ] (left), Brγ (middle), and H 2 λ2.12µm (right) emission in the 8 00 × 8 00 FoV of the SINFONI observations (Falcón-Barroso et al](https://thumb-eu.123doks.com/thumbv2/123dokorg/8099638.124887/11.892.115.792.128.363/comparison-emission-contours-emission-sinfoni-observations-falcón-barroso.webp)