Alma Mater Studiorum – Università di Bologna
DOTTORATO DI RICERCA IN
CHIMICA
Ciclo XXVII
Settore Concorsuale di afferenza: 03/A1
Settore Scientifico disciplinare: CHIM 01
New analytical LC-mass spectrometry
methodologies for the quali-quantitative
determination of natural substances and drugs in
complex matrices
Presentata da: Silvia Spinozzi
Coordinatore Dottorato
Relatore
Prof. Aldo Roda
Prof. Aldo Roda
2
Content
Prefazione
Abstract
1. Nutraceutical: berberine and its metabolites ... 10
1.1 Berberine ... 11
1.1.1 Pharmacological and therapeutic effects ... 11
1.1.2 Metabolism of berberine ... 11
1.1.3 Aim and rationale ... 13
1.1.4 Experimental ... 14
1.1.4.1 Materials and reagents ... 14
1.1.4.2 Synthesis of berberine metabolites ... 14
1.1.4.3 Liquid chromatography and mass spectrometry ... 16
1.1.4.3.1 HPLC optimization ... 16
1.1.4.3.2 ES mass spectrometry optimization... 17
1.1.4.3.3 Method validation ... 20
1.1.4.4 Physicochemical properties ... 22
1.1.4.5 Pharmacokinetics and bioavailability of berberine in human plasma ... 24
1.1.5 Results and discussion ... 25
1.1.5.1 Physicochemical properties ... 25
1.1.5.2 NMR characterization of berberrubine ... 30
1.1.5.3 Plasma sample extraction and clean up ... 31
1.1.5.4 Pharmacokinetics and bioavailability of berberine in human ... 31
1.1.5.5 Correlation between plasma levels and physicochemical properties34 1.2 Berberrubine ... 35
1.2.1 Pharmacological and therapeutic effects ... 35
1.2.2 Aim and rationale ... 35
1.2.3 Experimental ... 36
3
1.2.3.2 Comparison between pharmacokinetics and biodistribution of
berberine and berberrubine in bile fistula rat animal model... 37
1.2.4 Results and discussion ... 38
1.2.4.1 Sample extraction and clean-up procedures: bile and liver ... 38
1.2.4.2 Metabolism of berberrubine ... 39
1.2.4.3 Comparison between pharmacokinetics and biodistribution of berberine and berberrubine ... 40
1.3 Conclusions ... 42
2. Functional foods: glucosinolates ... 44
2.1 Glucosinolates ... 45
2.1.1 Structure and properties ... 45
2.1.2 Glucosinolates metabolism: isothiocyanates ... 46
2.1.3 Biological activity and nutraceutical applications ... 47
2.1.4 Glucosinolates and isothiocyanates determination techniques ... 48
2.2 Aim and rationale ... 50
2.3 Experimental... 51
2.3.1 Materials and reagents ... 51
2.3.2 Calibration standard ... 51
2.3.3 Liquid chromatography and mass spectrometry: method validation ... 52
2.3.3.1 HPLC optimization ... 52
2.3.3.2 ES Mass spectrometry optimization ... 54
2.3.3.3 Method Validation ... 58
2.3.4 Glucosinolates extraction procedures ... 60
2.4 Results and discussion ... 61
2.4.1 Glucosinolates in rocket salad seeds ... 61
2.4.2 Glucosinolates in broccoli sprouts ... 62
2.4.3 Glucosinolates in bakery products ... 63
4
3.Drugs co-administration: OCA and bile acid sequestrants ... 66
3.1.1 Obeticholic acid: pharmacological activity, metabolism and physicochemical properties ... 67
3.1.2 Bile acids sequestrants: cholestryamine and colesevelam ... 69
3.1.3 Adsorption isotherms ... 70
3.2 Aim and rationale ... 72
3.3 Experimental... 73
3.3.1 Materials and reagents ... 73
3.3.2 HPLC-ES-MS/MS method ... 73
3.3.3 Adsorption experiments of bile acids by bile acid sequestrants ... 75
3.4 Results and discussion ... 77
3.4.1 Adsorption experiments of bile acids by bile acid sequestrants ... 77
3.4.2 Comparison between colesevelam and cholestyramine adsorption .... 83
3.5 Conclusions ... 85
4.Electron ionization in LC-MS: Direct-EI-UPLC-MS for sterols analysis ... 86
4.1 Direct-EI interface ... 87
4.2 Aim and rational ... 89
7
Prefazione
“Abbiamo spesso sentito sostenere la tesi che le scienze sono fondate su concetti basilari chiari e nettamente definiti. In verità nessuna scienza, neanche la più esatta, inizia con tali definizioni. Il vero inizio dell’attività scientifica consiste piuttosto nel descrivere i fenomeni e quindi nel raggrupparli, classificarli e correlarli. Già allo stadio di descrizione non è possibile evitare di applicare certe idee astratte al materiale in questione, che derivano da qualche parte, ma che certamente sono basate unicamente sulle nuove osservazioni. Tali idee –che in seguito diventeranno I concetti basilari della scienza- sono ancora più indispensabili quando il materiale viene ulteriormente elaborato. Dapprima esse devono necessariamente possedere un certo grado di indefinitezza; non si può neanche considerare una chiara delimitazione del loro contenuto. Finché queste idee rimangono in questo stato, noi arriviamo a capirne il significato facendo spesso riferimento al materiale di osservazione da cui sembra scaturire, ma al quale, in realtà, sono state imposte. Così a rigor di termini, esse non sono che convenzioni, benché tutto dipenda dal fatto che non sono scelte arbitrariamente, ma determinate in dipendenza dai loro rapporti che noi intuiamo anche prima di poterli riconoscere e dimostrare. Siamo in grado di formulare i basilari concetti scientifici con maggior precisione solo dopo un’indagine più profonda del campo di osservazione, e progressivamente possiamo modificarli sicché diventino utili e coerenti quando vengono applicati a un’area più estesa. A quel punto è arrivato il momento di regalarli alla scienza. Il progresso della scienza, comunque, non tollera alcuna rigidità nemmeno nelle definizioni. La fisica e la chimica forniscono degli eccellenti esempi di definizioni che vanno sempre alterati nel loro contenuto.”
9
Abstract
This thesis reports an integrated analytical and physicochemical approach for the study of natural substances and new drugs based on mass spectrometry techniques combined with liquid chromatography.
In particular, Chapter 1 concerns the study of Berberine a natural substance with pharmacological activity for the treatment of hepatobiliary and intestinal diseases. The first part focused on the relationships between physicochemical properties, pharmacokinetics and metabolism of Berberine and its metabolites. For this purpose a sensitive HPLC-ES-MS/MS method have been developed, validated and used to determine these compounds during their physicochemical properties studies and plasma levels of berberine and its metabolites including berberrubine(M1), demethylenberberine(M3), and jatrorrhizine(M4) in humans. Data show that M1, could have an efficient intestinal absorption by passive diffusion due to a keto-enol tautomerism confirmed by NMR studies and its higher plasma concentration. In the second part of Chapter 1, a comparison between M1 and BBR in vivo biodistribution in rat has been studied.
In Chapter 2 a new HPLC-ES-MS/MS method for the simultaneous determination and quantification of glucosinolates, as glucoraphanin, glucoerucin and sinigrin, and isothiocyanates, as sulforaphane and erucin, has developed and validated. This method has been used for the analysis of functional foods enriched with vegetable extracts. Chapter 3 focused on a physicochemical study of the interaction between the bile acid sequestrants used in the treatment of hypercholesterolemia including colesevelam and cholestyramine with obeticolic acid (OCA), potent agonist of nuclear receptor farnesoid X (FXR). In particular, a new experimental model for the determination of equilibrium binding isotherm was developed.
Chapter 4 focused on methodological aspects of new hard ionization coupled with liquid chromatography (Direct-EI-UHPLC-MS) not yet commercially available and potentially useful for qualitative analysis and for “transparent” molecules to soft ionization techniques. This method was applied to the analysis of several steroid derivatives.
10
Chapter 1
Nutraceutical: berberine and its
metabolites
In recent years, there is a growing interest in "nutraceuticals" which provide health benefits and are alternative or complementary to the use of conventional drugs in modern medicine. The term “nutraceutical” was coined from “nutrition” and “pharmaceutical”. According to DeFelice definition, nutraceutical can be defined “as a food (or part of a food) that provides medical or health benefits, including the prevention and/or treatment of several diseases”1.
In this definition, nutrients, herbals and dietary supplements, that contain one or more bioactive molecules, are included. Most commercially nutraceuticals contain a single purified natural substance perpetrated from raw extracts in different foods products. The active ingredient often exceeds the amount present in the whole plant. Indeed, the rationale used in nutraceutical field is that the administered doses of these supplements should be as high as in conventional drugs. In this way, a nutraceutical and a drug could have the same therapeutic effect. Nevertheless unlike drugs, nutraceuticals do not require conventional approval based on a detailed characterization (toxicological studies, metabolism) of its constituents, undermining the consumers’ safety. Indeed, often the non- declared compounds are present in these supplements even at higher amount than the declared bioactive molecule. To make matters worse, their physicochemical properties, biodistribution in the human body and target organ activity have been poorly studied despite nutraceuticals administration at high doses (from 0.5 to 2g/day). The row material and natural extract could be purchased by uncontrolled suppliers and this is an additional concern for the consumer’s safety.
11
1.1 Berberine
1.1.1 Pharmacological and therapeutic effects
Berberis vulgaris L. extracts have been used for a long time in traditional Indian and Chinese medicine used as antimicrobial against a variety of organisms such as bacteria, viruses, fungi, protozoans, helminthes, and chlamydia2. Studies carried out on the chemical composition of these extracts show that the major isoquinoline alkaloid constituents were berberine and palmitine. Recently, Berberine (BBR, Figure 1) has intrigued increasing interest in its several bioactivities as antifungal3, anti-inflammatory4, antimalarial5, anti-HIV6, antihyperglycemic7, immunoregulatory8, antitumor9.
Clinical trials showed also the beneficial effects of berberine in hypercholesterolemic patients and type 2 diabetes10. Indeed, administration of Berberine 500mg/die decreased the levels of total cholesterol, LDL-cholesterol and triglycerides (i.e. about 29, 25 and 35%). In particular, BBR increase low-density-lipoprotein receptor (LDLR) expression by stabilization of LDLR mRNA by activation of extracellular signal-regulated kinase (ERK). In addition, BBR was active in enhancing the expression of insulin receptor (InsR).
1.1.2 Metabolism of berberine
Previous studies11 showed that BBR is metabolized in the liver by CYP450 isoenzymes through oxidative demethylation at positions 2, 3, 9, and 10 followed by conjugation of these hydroxyl group functions with glucuronic acid. In humans, the main primary metabolites of BBR
Figure 1) report the chemical structure of the main metabolites berberrubine (M1),
12
Figure 1. Primary hepatic metabolism of BBR
As well as BBR, its metabolites exhibit some pharmacological properties such as up-regulation of low-density lipoprotein receptor, and mRNA expression12. Among these, M1 showed the best up-regulatory effect for LDLR mRNA expression, although its activity was lower than BBR (Figure 2). Toxicity studies of metabolites have not yet been carried out as well as have not been evaluated their possible side effects.
13
1.1.3 Aim and rationale
Protoberberine (5,6-dihydrodibenzo[a,g]quinolizinium), alkaloids found in the bark, rhizomes, roots, and stems of Berberis vulgaris L. (Berberidaceae)2, show many different types of biological activities. Among them, berberine (BBR, Figure 1) is the most interesting compound, which has a multi-target activity in particular as cholesterol-lowering effect10.
In the last 20 years the study of natural substances has changed radically, but nowadays is still lacking a complete physicochemical characterization of biologically active natural molecules and even more of its major metabolites in vivo. This fact represents a bottleneck in lead discovery for pharmaceutical research based on natural sources. Indeed, the importance of physicochemical properties of molecules in the development of orally bioavailable drugs has been recognized. Even though nutraceuticals do not require a conventional drug approval for which pharmacokinetic, metabolism and safety studies must be conducted.
For this reasons, the aim of this study is to develop and validate a new HPLC-ES-MS/MS method for the qualitative and quantitative determination of BBR and its metabolites. This method will be used to accurately quantify BBR and its metabolites during studies regarding the measurements of their physicochemical properties, including lipophilicity, solubility, pKa, and albumin binding.
In addition, to better understand BBR and its metabolites pharmacokinetic, intestinal absorption and biodistribution in target organs, the plasma levels of BBR and its metabolites after acute and chronic oral administration to hypercolesterolemic patients will be investigated. The biomarker of hypercholesterolemia activity (total, LDL and HDL cholesterol, total triglycerides) will be monitored in hypercolesterolemic patients chronically treated with BBR.
Finally, the relationship between the plasma levels and physicochemical properties of BBR and its metabolites will be critically discussed.
14
1.1.4 Experimental
1.1.4.1 Materials and reagents
Berberine chloride (BBR-Cl) and jatrorrhizine chloride (M4-Cl), as a standard for HPLC (purity ≥97%), were purchased from Sigma (St. Louis, MO, USA) and AlloraChem srl (Rimini, Italy) respectively.
Berberrubine and demethylberberine were synthetized in Prof. M. Roberti Laboratory (Department of Pharmacy and Biotechnology, University of Bologna). Flash column chromatography was performed on silica gel (particle size 40−63 μm, Merck). (R,S)-noscapine, used as internal standard and Tris-HCl salt were purchased from Sigma (St. Louis, MO, USA).
The organic solvents used have HPLC-grade: methanol and acetonitrile were purchased from Carlo Erba Reagents (Milan, Italy) and LiChrosolv. HPLC-grade water was prepared using the Millipore Milli-Q Synthesis A10 system (Molsheim, France).
Berberis Vulgaris 250 mg capsules were purchased from KOS s.r.l. (Comeana, Italy). Oasis HLB (hydrophilic−lipophilic balance 200 mg, 6 mL) SPE columns were purchased from Waters (Milan, Italy)
1.1.4.2 Synthesis of berberine metabolites
Berberrubine
Berberrubine chloride was prepared starting from berberine chloride following two different procedures, reported in Figure 3. In particular, in the first procedure (a) berberrubine chloride was obtained by berberine chloride pyrolysis, heated at 195°-200° C for 10-15 min, in solvent-free conditions under vacuum13 (20-30 mmHg), washed with ethanol and filtered (yield 81%).
1
H-NMR (DMSO-d6, 400 MHz): δ 3.10 (t, 2H, J= 6.0 Hz), 3.79 (s, 3H), 4.54 (t, 2H, J= 6.0
15
8.04 (s, 1H), 9.14 (s, 1H). 13C-NMR (DMSO-d6, 100 MHz): δ 27.5, 52.3, 55.7, 100.6, 101.5, 104.7, 108.2, 117.1, 120.0, 121.2, 121.8, 129.2, 132.0, 133.2, 145.7, 147.3, 148.3, 149.7, 167.3; MS (ES): m/z 322 (M+H+).
In procedure b, berberine chloride was irradiate at 250 W, 200°C for 10-15 min, washed with ethanol and filtered (yield 62%)14.
1 H-NMR (DMSO-d6, 400 MHz): δ 3.25 (t, 2H, J= 6 Hz), 4.10 (s, 3H), 4.96 (t, 2H, J= 6 Hz), 6.23 (s, 2H), 7.12 (s, 1H), 7.76 (d, 1H, J= 8 Hz), 7.84 (s, 1H), 8.15 (d, 1H, J= 8 Hz), 8.89 (s, 1H), 9.97 (s, 1H), 11.32 (br s, 1H). 13C-NMR (DMSO-d6, 100 MHz): δ 26.5, 54.9, 57.1, 102.0, 105.4, 108.4, 117.6, 118.1, 119.8, 120.7, 125.5, 130.5, 132.4, 136.6, 143.7, 145.4, 145.8, 147.7, 149.6.
16
Demethylenberberine
The semi-synthesis of demethylenberberine through the hydrolysis reaction of the berberine chloride acetal ring, in the presence of sulfuric acid and phloroglucin, was reported in
Figure 4.
Figure 4. Synthesis of demethyleneberberine (M3)
1 H-NMR (DMSO-d6, 400 MHz): 3.18 (t, 2H, J= 6.0 Hz), 4.12 (s, 3H), 4.15 (s, 3H), 4.96 (t, 2H, J= 6.0 Hz), 6.91 (s, 1H), 7.60 (s, 1H), 8.11 (d, 1H, J= 8 Hz), 8.23 (d, 1H, J= 8 Hz), 8.82 (s, 1H), 9.45 (br s, 1H), 9.89 (s, 1H), 10.23 (br s, 1H). 13C-NMR (DMSO-d6, 100 MHz): 25.8, 55.6, 57.1, 61.9, 112.7, 114.9, 117.8, 119.3, 121.2, 123.5, 126.7, 127.2, 133.3, 138.3, 143.5, 145.1, 145.6, 149.2, 150. MS (ES): m/z 324 (M+H+).
1.1.4.3 Liquid chromatography and mass spectrometry
The HPLC system used is a 2690 Alliance system (Waters, Milford, MA, USA) combined with a triple quadruple mass spectrometer QUATTRO-LC (Micromass; Waters) using an electrospray interface (ES). Analytical separation was achieved using a Phenomenex Luna C18 (5 µm, 150 mm × 2.0 mm i.d.) column.
17
1.1.4.3.1 HPLC optimization
The mobile phase used to achieve a good separation between berberine and its metabolites was 10 mM formic acid in water adjusted to pH 4.0 with ammonia (solvent A) and a solution of acetonitrile: methanol = 95:5 v/v (solvent B) using a gradient elution (5 min at 95% A and 10 min at 40% A, 5 min at 20% A, 10 min at 0% A) at 0.15 mL min−1 flow rate. The analytical column was maintained at 30°C and the sample volume injected was 10 µL.
In the optimized analytical conditions, the mean retention times were for BBR 10.0 ± 0.2 min, M1 10.4 ± 0.2 min, M3 9.2 ± 0.2 min, and M4 9.8 ± 0.2 min (n = 20). The reconstruction ion chromatogram (RIC) for BBR and its metabolites is reported in
Figure 5.
Figure 5. Reconstructed ion chromatogram of BBR, M1, M3 and M4.
1.1.4.3.2 ES mass spectrometry optimization
The HPLC was coupled to a electrospray source (ES) operating in positive ion mode, connected to a triple-quadruple mass spectrometer. For each analyte a standard solution (0.1 g/mL in 10 mM formic acid (pH 4.00): methanol 50:50 (v/v), flow of 20 L
18
min-1) was directly infused into the mass spectrometer to find the optimal tuning parameters, reported in
19
20
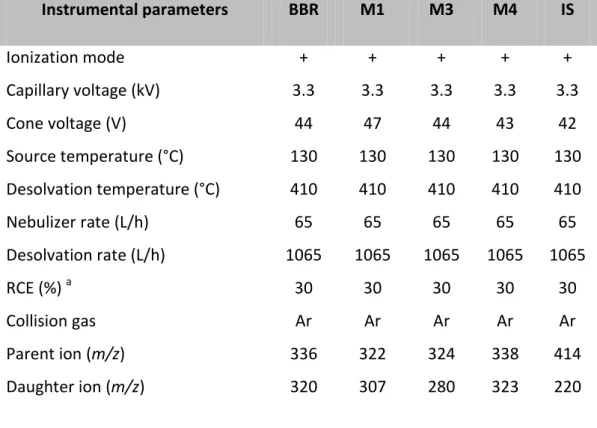
Table 1. Tuning parameters BBR and its metabolites
Instrumental parameters BBR M1 M3 M4 IS Ionization mode + + + + + Capillary voltage (kV) 3.3 3.3 3.3 3.3 3.3 Cone voltage (V) 44 47 44 43 42 Source temperature (°C) 130 130 130 130 130 Desolvation temperature (°C) 410 410 410 410 410 Nebulizer rate (L/h) 65 65 65 65 65 Desolvation rate (L/h) 1065 1065 1065 1065 1065 RCE (%) a 30 30 30 30 30 Collision gas Ar Ar Ar Ar Ar Parent ion (m/z) 336 322 324 338 414 Daughter ion (m/z) 320 307 280 323 220 a
Relative collision energy
Detection was performed by Multiple Reaction Monitoring (MRM) operating in the positive ionization mode, by monitoring the transitions at m/z 336→ 320 BBR), m/z 322→ 307 (M1), m/z 324→ 280 (M3), m/z 338→ 323 (M4), and m/z 414→ 220 ((R,S)-noscapine).
21
22
1.1.4.3.3 Method validation
The developed HPLC-ES-MS/MS method was validated according to the current guidelines15 used in drug analysis. The required validation parameters, i.e., specificity, limit of detection and quantification, linearity range, accuracy and precision are reported below.
Specificity
The HPLC-ES-MS/MS method developed presents a high specificity because compounds of closely related structures, as BBR and its metabolites are discriminate by different retention times and mass spectra.
Limit of detection and quantitation
Limits of detection (LOD), estimated as the signal-to-noise ratio (S/N) equal to 3, was 0.08 ng/mL for each analyte. The limit of quantification (LOQ), estimated as S/N equal to 9, is 0.5 ng/mL for each analyte.
Linearity range
Linearity was studied in the range from 0.5 to 20 ng/mL for each analyte.
Linear calibration curve parameters were obtained from the plot of the analyte peak area/internal standard peak area versus analyte concentration using a least squares regression analysis (weight = 1/x2). Plasma calibration curve of BBR and its metabolites, expressed as y= (a ± DS)+ (b ± DS)x, was reported in Table 2. The performance of the analytical method was monitored using three quality control samples (QCs) having 4.5 nM for QC low, 20 nM for QC med and 45 nM for QC high.
23
Table 2. Calibration curves of BBR and its metabolites in plasma
Analytes y= (a ± DS)+ (b ± DS)x R2 BBR y= (-0.0133 ± 0.0001) + (0.339 ± 0.055)x 0.993 ± 0.005 M1 y= (-0.050 ± 0.004) + (0.809 ± 0.055)x 0.990 ± 0.003 M3 y= (-0.018 ± 0.005) + (0.159 ± 0.024)x 0.991±0.001 M4 y= (-0.0014 ± 0.0008) + (0.095 ± 0.051)x 0.994±0.001
a= intercept; b=slope; x= concentration (ng/mL); DS=standard deviation; R2= coefficient of determination
Accuracy and precision
Accuracy (bias %) and precision (coefficient of variation, CV %) were determined intra-day, evaluated during the same intra-day, and inter-intra-day, evaluated during three days, using the triplicate analysis of the QCs for each analyte (
Table 3).
Table 3. Accuracy (bias %) and precision (CV %) of BBR and its metabolites Accuracy and precision
BBR M1 M3 M4
C (nM) CV% bias% CV% bias% CV% bias% CV% bias%
In tr a-d ay 4.5 (QC low) 9 7 7 2 8 1 7 7 20 (QC med) 2 3 2 1 8 1 4 1 45 (QC high) 1 1 3 2 5 2 3 4 In ter -d ay 4.5 (QC low) 7 5 7 1 7 7 11 5 20 (QC med) 5 1 4 1 4 1 3 1 45 (QC high) 2 3 1 3 3 2 1 3
24
Recovery and matrix effect
The extraction efficiency of solid phase extraction was expressed as recovery. The recovery % was > 90 % for each analyte while the matrix effect was < 10%.
1.1.4.4 Physicochemical properties
Determination of pKa values
The pKa values were determined in silico using Epik module version 2.2 from Schrödinger Suite 2010, setting water as solvent and using the maestro interface of Schrödinger Suite 2010 (Maestro, version 9.1, Schrödinger, LLC, New York, NY, 2010) to build all molecules.
Determination of water solubility
The solubility was experimentally determinated in Na phosphate buffer 0.1 M from pH 4.5 to 9 for each analyte under continuous stirring at 25 °C, for 1 week. Then, each solution was filtrated on RC membrane 0.45 µm syringe filters and injected in HPLC-ES-MS/MS after an appropriate dilution with mobile phase.
Determination of 1-octanol/water partition coefficient
The determination of 1-octanol/water partition coefficient was experimentally determinated in Na phosphate buffer from pH 4.5 to 9.0 for each analyte. Briefly, for each analyte 2mL of a standard solution (0.1 mM) in Na phosphate buffer, presaturated with 1-octanol, was added to 2 mL of 1-octanol (presaturated with Na phosphate buffer). The system was left to equilibrate for 1 week under continuous stirring at 25 °C. Then, the two phases were carefully separated by centrifugation. The aqueous solution was appropriately diluted with mobile phase and injected in HPLC-ES-MS/MS.
25
Determination of albumin binding association constants
The determination of albumin binding association constants (KB) were performed
using bovine serum albumin (BSA) 10 µmol L-1 in Tris-HCl buffer solution (0.05 mol L-1 Tris, 0.15 mol L-1 NaCl, pH 7.4) by fluorescence quenching. The emission spectra was obtained recording the increasing concentrations of quencher (Q: BBR, M1, M3, M4) from 0 to 24 µmol L-1 (increments of 2 µmol L-1) setting the excitation at 295 nm and emission wavelengths of 300-500 nm.
The experimental results published on BBR quenching mechanism of fluorescence of indicate that it’s a static quenching procedure16. For this reason, the binding association was determinated by plotting modified Stern-Volmer equation (Figure 7).
Figure 7. BSA emission spectra in presence of quencher (left) and modified
Stern-Volmer plot (right)
where:
F0 – fluorescence intensity in absence of quencher
ΔF – difference in fluorescence in absence and presence of quencher fa – fraction of accessible fluorescence
KB – effective quenching constant for the accessible fluorophores
26
1.1.4.5 Pharmacokinetics and bioavailability of berberine in
human
The same formulation of Berberis Vulgaris enriched extract (250 mg cps) was acutely and chronically administered to human subjects in order to better understand berberine pharmacokinetics and the biodistribution.
The pharmacokinetics study was carried out by administering 500 mg of berberine to healthy subjects (n=10). Plasma samples were collected at different times after 1, 2, 3, 4, 6, 8, 24 h respectively.
Concerning the subchronic bioavailability study, hypercolesterolemic patients (n=12) received 15 mg/kg daily of berberine for three months (from a minor daily dose of 3 cps/day to a maximum daily dose prescribed 6 cps/day). Patient inclusion criteria were as follows: age 18 – 70 year-old; c-LDL>130 mg/mL and <190 mg/mL; fasting glucose<100 mg/mL. Total cholesterol, c-LDL, c-HDL, triglycerides, was evaluated before enrollment (V0) end after three month of berberine chloride chronically administered (V3) to evaluate the hypolipidemic effect of berberine.
These studies have been approved by the Ethical committee of the S.Orsola University Hospital (Review Board No. 7-2209-U-SPER).
27
1.1.5 Results and discussion
1.1.5.1 Physicochemical properties
The physicochemical properties of berberine and its metabolites, including pKa, solubility, lipophilicity and albumin binding, are reported in Table 4.
pKa
In silico, the pKa prediction is possible only for molecule containing proton donor or acceptor groups. For this reason the determination of pKa was performed only for berberine metabolites and no for berberine, assuming that its iminium cation would remain as such in all pH range.
The simultaneous presence of the iminium cation and the hydroxyl group in the structures of berberine metabolites play a crucial role. Indeed, these compounds could take on the characteristics of neutral molecules when pH is higher than the pKa value. Specifically, M3 and M4 are partially dissociated in physiological pH, having a pKa value 9.4 and 9.6 respectively. No pKa value was retuned for M1 as the most stable tautomer in water was its neutral quinoid form.
In order to demonstrate the keto-enolic equilibrium of M1 (Figure 8), its quinoid form was synthetized and an NMR study was performed.
28
Water solubility
As show in Table 4, the solubility of berberine was not influenced by pH variation while the solubility of M3 and M4 increased significantly when pH was increased. Concerning M1, its solubility decreased when pH was increased and the color of M1 in solution turned from yellow at acidic pH to red a basic pH. This bathocromic effect could be due to prevalence of enolic form at low pH and quinoid form M1-keto at high pH, as previously hypothesized.
29
Lipophilicity
The coefficient partition 1-octanol/water (LogPo/w) of berberine and its metabolites are reported in Table 4.
Unlike its metabolites, the LogPo/w of BBR is not greatly influenced by pH because in its structure there are not proton donor or acceptor functional groups. Thus the only species present in its solution, at each pH value, is BBR as such (Figure 1).
BBR, M3 and M4 could be classified as hydrophilic compounds (LogPo/w<0) while conflicting data are obtained for M1.
The lipophilicity of M1 is strongly influenced by pH variation, increasing with increasing pH from Log -0.02 to 1.6. This latter value is in disagreement with its nominal enolic structure indeed M1 should be more hydrophilic than berberine. This M1lipophilicity variation could be attributed to the predominance of the enol form (total positive charge) at acid pH (4.5) and the quinoid form at basic pH (total neutral charge), that is more liposoluble. Indeed, as seen in solubility assay, a different phase color was observed during the partition in 1-octanol and aqueous medium of M1: yellow in aqueous phase and red in 1-octanol (Figure 9).
Figure 9. Coefficient partition 1-octanol/water of M1
Albumin Binding
In Figure 10 the tryptophan fluorescence quenching effects induced by berberine, M1, M3 and M4 respectively are reported. The presence of a double peak in quenching profile of BBR, M3 and M4, suggest that they bind both binding sites of BSA. On the
30
other hand, the quenching profile of M1 is characterized by a single peak suggesting that this metabolite bind only one sites of BSA. The affinity constants binding are reported in Table 4.
Figure 10. Emission spectra of BSA (0.1 µM) at different concentrations of: (A) BBR, (B)
31
Table 4. Physicochemical properties of BBR and its metabolites
Compound pH a gradient Solubility (mM) LogPo/w a LogDo/w KB b (x103 L·mol-1) ± SD BBR 8.6 9.6 -1.2 -1.2 7.0 9.0 -1.2 -1.2 3.37 ± 0.09 6.0 7.6 -1.2 -1.2 4.5 8.2 -1.2 -1.2 in silico - -0.4 - M1 8.6 0.5 1.6 4.6 7.0 1 1.1 2.5 1.51 ± 0.03 6.0 2 0.9 1.4 4.5 4.2 -0.02 0.01 in silico - 1.0 - M3 8.6 6.5 -0.5 -0.3 7.0 3.7 -1.1 -1.1 1.98 ± 0.09 6.0 0.2 -1.1 -1.1 4.5 0.2 -1.1 -1.1 in silico - 0.1 - M4 8.6 12.2 0.1 0.6 7.0 12.4 -1.2 -1.2 1.73 ± 0.01 6.0 1.3 -1.5 -1.5 4.5 1.5 -1.5 -1.5 a
32
1.1.5.2 NMR characterization of berberrubine
In order to demonstrate the keto-enolic equilibrium of M1, NMR spectroscopic studies have been performed. In particular, the NMR characterization was carried out for a equimolar mixture of enol and quinoid form of M1, using several NMR spectroscopic technique. Specifically, the 1H-NMR spectra of this equimolar mixture displayed only one average set of signals, confirming that a fast equilibrium between this two tautomeric forms take place.
In addition, a 1H-15N HMQC (recorded at 40° C in DMSO-d6) correlation analysis was
carried out for both structures. In the NMR of enol form, correlations of H8 triplet and the H11 singlet with N10 resonance at 193 ppm were observed. As expected, the same correlations (Figure 11) of H8 triplet and the H11 singlet with N10 were obviously observed for quinoid form while N10 resonance was found at 164 ppm. The difference between the chemical shifts for the two 15N resonances is due to the different electron density of quaternary N atom in enol form and that of tertiary N atom in quinoid form.
33
1.1.5.3 Plasma sample extraction and clean up
Analytes were extracted from plasma using an Oasis HLB (hydrophilic−lipophilic balance 200 mg, 6 mL) SPE column. The optimized extraction procedure utilized: conditioning with 2 mL of MeOH and 2 mL of H2O Milli-Q; loading with 100 µL of
plasma (+10 µL of IS, 10 ng/mL) diluted with 2 mL of ammonium formiate (10 mM pH 7.0), washing with 1 mL of formic acid (2%, v/v) and 2 mL of ammonium formiate (10 mM pH 7.0), elution with 2 mL of MeOH, followed by 1 mL of MeOH containing 1% (v/v) CH3COOH and 1 mL of MeOH containing 2% (v/v) NH4OH, vacuum drying, and
reconstitution with 100 µL of mobile phase. The recovery percentage was ≥90% for all analytes.
1.1.5.4 Pharmacokinetics and bioavailability of berberine in
human
In Figure 12 are reported plasma levels of BBR and its metabolites after acute and chronic administration.
Concerning the pharmacokinetic study, the curve of BBR, M3 and M4 are quite similar. Their maximum plasma concentration are very low, i.e. 0.07 ± 0.01 nM for BBR, 0.14 ± 0.01 nM for M3, and 0.13 ± 0.02 nM for M3. Instead, plasma levels of M1 reach a maximum concentration of 1.4 ± 0.3 nM, ten times higher than BBR and others metabolites.
After chronic administration (Figure 12), a bioaccumulation of BBR and its metabolites was observed. The steady-state levels were 4.0 ± 2.0 nM, 6.7 ± 3.0 nM, 1.7 ± 0.3 nM, and 5.6 ± 2.0 nM for BBR, M1, M3 and M4 respectively.
These plasma levels are higher than those after acute administration because the dose was twice compared to acute one.
34
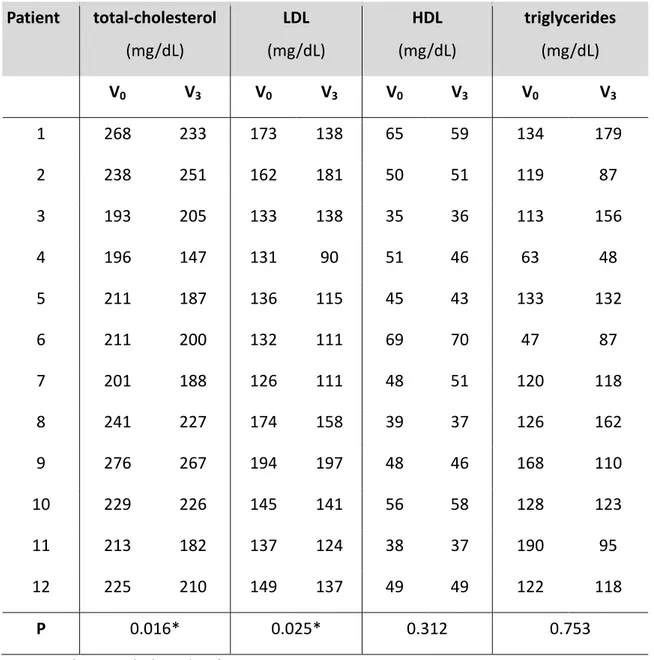
Table 5 the comparison of cholesterol (total, LDL and HDL) and total triglycerides
before (V0) and after the treatment with Berberine chloride for three months (V3) was
reported.
Among biochemical-marker of hypercholesterolemia, a significant reductions in total and LDL cholesterol (p<0.05 obtained by the paired two-tailed Student’s t test) was observed and this is in agreement with previously published data17. In contrast, total triglyceride and cholesterol-HDL levels were not significantly different (p>0.05) before and after chronic administration of BBR.
Figure 12. Plasma levels of BBR, M1, M3 and M4 (A) acute administration of BBR 500
mg (n=10) (B) chronic administration of of BBR 15 mg/kg
35
Table 5. Biomarkers of hypercholesterolemia before (V0) and after the treatment with
Berberine chloride (V3) Patient total-cholesterol (mg/dL) LDL (mg/dL) HDL (mg/dL) triglycerides (mg/dL) V0 V3 V0 V3 V0 V3 V0 V3 1 268 233 173 138 65 59 134 179 2 238 251 162 181 50 51 119 87 3 193 205 133 138 35 36 113 156 4 196 147 131 90 51 46 63 48 5 211 187 136 115 45 43 133 132 6 211 200 132 111 69 70 47 87 7 201 188 126 111 48 51 120 118 8 241 227 174 158 39 37 126 162 9 276 267 194 197 48 46 168 110 10 229 226 145 141 56 58 128 123 11 213 182 137 124 38 37 190 95 12 225 210 149 137 49 49 122 118 P 0.016* 0.025* 0.312 0.753
36
1.1.5.5 Correlation between plasma levels and physicochemical
properties
Among the physicochemical properties studied for BBR and its metabolites, the pKa and the lipophilicity are correlated with plasma levels after oral administration. As previously reported, pKa values showed that BBR, M3, and M4 were permanently charged at the physiological pH range while M1 tautomerized in its neutral quinoid form (Figure 13).
This keto-enol tautomeric equilibrium was strongly influenced by pH and the two forms of M1 (i.e. enol and quinoid form) interconvert rapidly into each other. Likely, the prevalence of its enolic form or quinoid form was continuously modulated in vivo and their separation could be promoted by a membrane in systemic compartment. The intestinal adsorption of quinoid form could be more efficient than enol form because a neutral molecule cross much better membranes than a charged one (Figure 13).
Figure 13. pH-mediated passive diffusion of M1 through the cell membrane
Summarizing, BBR has an unusual metabolism through it produces a metabolite, M1, more lipophilic than BBR in its quinoid form. For this reason, it was hypothesized that M1 could be adsorbed by passive diffusion and this accounts for its higher plasma
37
levels. Thus M1 accumulates in systemic compartment more than BBR and other metabolites and as discussed above, M1 seems to be more pharmacologically active but this hypothesis should be demonstrated by the direct administration of M1.
1.2 Berberrubine
1.2.1 Pharmacological and therapeutic effects
As reported above, M1 showed a cholesterol-lowering efficacy, although its activity was lower than BBR (about 40% lower). In order to improve the low bioavailability of BBR, several prodrugs of M1 were designed, in which the 9-hydroxl group of M1 was replaced with different ester groups. Consequently its cholesterol-lowering effect is increased because these new compounds are more lipophilic than M1 and BBR18. In addition, recent studies have been demonstrated that berberrubine exhibits anti-tumor activity in animal models. In particular, M1 exhibits an antianti-tumor activity higher than BBR, due to the hydroxyl group at the 9-position in the M1 structure. The substitution of the methoxy group in BBR structure with an hydroxyl group in M1 could mediate DNA cleavage by topoisomerase II19,20.
1.2.2 Aim and rationale
Despite its significant pharmacological effect, the bioavailability of BBR (Figure 1), obtained by the area under the curve and maximum concentration in blood, was less than 1%. BBR is an isoquinoline alkaloid isolated from several Chinese herbal medicines, such as Coptis chinensis, Berberis aristata, and Coptis japonica that exhibits a multi-taget activity. In particular a lipid-lowering effect by up-regulating the hepatic low density lipoprotein receptor (LDLR) expression is obtained after oral
38
administration of 500mg/die of berberine chloride. As well as BBR, also its primary metabolites showed a cholesterol-lowering effect although less than BBR activity. Recently, several studies21 have been carried out to explain how this molecule so poorly bioavailable exhibits these important pharmacological activities. In particular, the biodistribution of BBR and its metabolites in main organs or tissues was further investigated. After oral administration a dominant tissue distribution of BBR and its metabolites was observed in the liver. This pharmacological result has been used to explain why BBR is active in vivo, even if its blood concentration is low. Indeed, the authors have been hypothesized that an accumulation of BBR and its metabolites could explain their therapeutic effect on cholesterol, glucose and triglycerides in patients.
Although the bioavailability of BBR is low, the concentration of M1 in blood was ten times higher than BBR and others metabolites (as reported below). For this reason M1 could be potentially more pharmacologically active than berberine.
Previously we have demonstrated that M1 could tautomerized in its quinoid form which could accumulate in systemic compartment more than BBR.
In order to demonstrate the tautomeric equilibrium in vivo of M1, in vivo experiments on "rat with external biliary fistula" were carried out. Specifically, M1 will be duodenal administered at 10mg/kg. Plasma, liver and bile will be collected during all the experiment. Then, the biodistribution of M1 will be compared with BBR.
For this purpose it will be necessary to develop and validate clean up procedures for the extraction and purification of analytes by these matrices.
1.2.3 Experimental
1.2.3.1 Materials and reagents
Wistar-Han rats (male, 180–220 g, 6–7 weeks) for the following pharmacokinetic study were obtained from Charles River Laboratories, Carlo, Italy. All the experiments were conducted following relevant National and International Guidelines according to Public
39
Health Service Policy on Humane. The animals were maintained on a 12-h light/dark cycle (light on from 8:00 AM to 8:00 PM) at ambient temperature (22–24 °C) with 45% relative humidity. The rats were fasted for 12 h before all experimental studies.
1.2.3.2 Comparison between pharmacokinetics and
biodistribution of berberine and berberrubine in bile fistula rat
animal model
The animal model used was the bile fistula rat in which, the bile duct was cannulated to collect the bile at time interval after intraduodenal administration of the compound per gavage. Berberine and M1 were infused at a dose of 500 nmol/kg/min (10mg/kg) over 2 hour at 2.5 ml/hour.
Bile was collected at 15 minutes time intervals throughout the infusion and over 2 hours after the infusion was over while plasma was collected every 30 minutes and liver at the end of experiment. The bile flow was evaluated gravimetrically by the volume of bile recovered at the different time-intervals, while the concentration of the administered compounds and its main metabolites were measured in bile, plasma and liver samples with the HPLC-ES-MS/MS as reported below.
In the anesthetized animal, the intestinal motility is hampered not allowing the progression of the substance. For this reason an intraduodenal infusion was preferred over the single bolus infusion in which the absorption would be disturbed by the absence of luminal stirring.
40
1.2.4 Results and discussion
1.2.4.1 Sample extraction and clean-up procedures: bile and
liver
Bile Sample Preparation
Rat bile samples were brought to 25°C and diluted 1:10000 v/v with ammonium formiate buffer 10 mM pH 4.0 and acetonitrile−methanol (95:5 v/v) in ratio 95:5 (v/v) and 5 µl was injected in HPLC-ES-MS/MS system.
Liver Sample Preparation
Aliquots weighing approximately 1 g each were taken from different points of the liver sample. Each aliquot was weighed, and 2 ml of phosphate buffer (0.005 M, pH 7.2) was added. The mixture was homogenized using a potter, which was then washed with 3 mL of methanol. The liver extract was sonicated for 5 minutes, vortexed for 2 minutes, heated to 37°C for 20 minutes, and centrifuged at 2100g for 15 minutes. Four hundred microliter of the supernatant was spiked with 10 µl of the internal standard working solution and dried under vacuum. The residue then was re-suspended with 2 ml of ammonium formiate (10 mM pH 7.0) and SPE was carried out on HLB extraction cartridges (as shown above). The eluate was dried under vacuum and reconstituted with 200 ml of the mobile phase) and injected into the HPLC-ES-MS system.
41
1.2.4.2 Metabolism of berberrubine
The metabolism of berberine has been further investigated, and M1, M2, M3 and M4 were identified as main primary metabolites (Figure 1).
In this work, it was hypothesized that, as well as berberine, M1 might be further metabolized in the liver by CYP450 isoenzymes through oxidative demethylation at positions 2, 3, 9, and 10 followed by conjugation of these hydroxyl group functions with glucuronic acid. The hypothesized primary metabolites of M1 were reported in
Figure 14.
42
1.2.4.3 Comparison between pharmacokinetics and
biodistribution of berberine and berberrubine
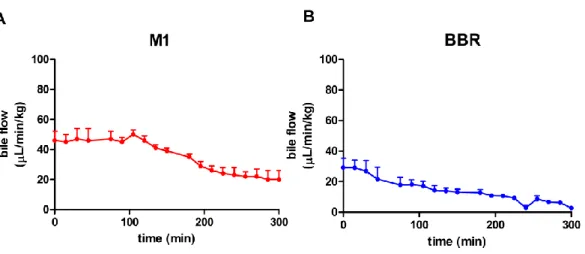
The bile flow and bile secretion of M1 (A) and BBR (B) are reported in Figure 15 and
Figure 16. After duodenal infusion of M1 and BBR, a reduction of bile flow was
observed for each compound, reaching a minimum volume secretion (SVmin) of 20 and 2.9 µL/min/kg for M1 and BBR respectively. The bile flow reduction could be due to the animal model chosen in which the enterohepatic circulation was interrupted.
Figure 15. Bile flow of A) M1 and B)BBR
Concerning their biliary secretion, it is more efficient for M1 than BBR. Indeed, the maximum bile secretion (SBmax) of M1 is 6 times higher than BBR SBmax (i.e. 19.6 and 3.3 nmol/ min/ kg). In bile M1 was poorly metabolized to mono and dihydroxyl derivatives while BBR was metabolized in M1, M3 and M4 (SBmax i.e. 1.3, 1.2 and 1.2.nmol/ min /kg).
43
Plasma profiles of M1 and BBR were reported in Figure 17. As expected, the bioavailability of BBR is very low, reaching a maximum plasma concentration (Cmax) of 0.046 µM after 240 min. In particular, after duodenal infusion of BBR, it is mainly metabolized to M1 (Cmax 0.085 µM after 120 min) and less to M3 and M4 (i.e. 0.05 and 0.025 µM). Differently from BBR after duodenal infusion, M1 was poorly metabolized reaching a Cmax of 11.8 µM after 240 min.
Figure 17. Plasma levels of A) M1 and B) BBR
In liver, the amount of M1 was 52 nmol/g after its direct administration and no metabolites were detected. Unlike, after duodenal infusion of BBR, the amount of BBR
44
was 34.4 nmol/g, 26.5 nmol/g for M1, 1.6 nmol/g for M3 and 8.4 nmol/g for M4 respectively.
1.3 Conclusions
The physiochemical properties of BBR and of its metabolites showed that it has an unusual metabolism as its metabolite M1 is more lipophilic than BBR. Indeed the nitrogen atom of M1 structure could be tetravalent with a positive charge in its enol form and trivalent and electroneutral in quinoid form (Figure 13) by keto-enol tautomerism equilibrium unlike BBR and the other metabolites. It was hypothesized that the intestinal adsorption of M1 quinoid form could be more efficient than enol form because a neutral molecule cross better membranes than a charged one. In this way, M1 could be adsorbed by passive diffusion and be pharmacologically more active than BBR.
Indeed, the direct administration of M1 has shown that it is more efficiently secreted in bile than BBR with a SBmax of 19.6 and 3.3 nmol/min/kg respectively. In addition, the metabolism of M1 was widely investigated. Although, M1 was poorly metabolized unlike as observed for BBR in which the SBmax of its metabolites was 1.3, 1.2 and 1.2 nmol/min/kg for M1, M3 and M4 respectively. The main metabolites present in bile were 3-hydroxy, 10-hydroxy, 2,3-dihydroxy and 2,10-dihydroxy derivatives reaching a SBmax of 2.82, 1.87, 0.47 and 0.98 nmol/min/kg respectively.
Concerning plasma levels, M1 exhibited a higher concentration both when it was directly infused (Cmax=11.8 µM) and when it was produced by BBR (Cmax=0.085 µM, time 120 min) compared to BBR plasma levels as expected. In particular, unlike BBR (Cmax=0.046 µM), M1 was detected as such in plasma and poorly metabolized. In the liver, M1 was detected as such (52 nmol/g) and no metabolites were detected. After duodenal infusion of BBR, the same total amount reaching for M1 was observed (BBR was 34.4 nmol/g, M1 26.5 nmol/g, M3 1.6 nmol/g and M4 8.4 nmol/g).
Based on this consideration, M1 could be highly conserved in enterohepatic circulation (Figure 18) thought to be actively absorbed in the ileum in its quinoid form by
keto-45
enol tautomerism. Indeed, in the intestine (pH>6.00) the neutral quinoid form of M1 is the most abundant species. Then the quinoid form of M1 could be reabsorbed by active transport at end of small intestine resulting in a higher concentration in blood. Studies on the relationship with biomarkers of different diseases are currently underway for M1 in enol and quinoid form.
The overall data suggest the importance of accurate preclinical studies of natural products. In particular studies on biodistribution, metabolism, and accumulation in target organs should be carried out although not required by the regulatory authorities. Moreover the metabolism and biodistribution are strongly influenced by administered dose. A lack of this information represents a serious risk for the consumers’ safety. In addition, in order to improve the lead discovery for pharmaceutical research based on natural sources, a physicochemical characterization should be carried out. In this physicochemical characterization the major metabolites of biologically active compound should be included.
46
Chapter 2
Functional foods: glucosinolates
In the nutraceutical definition, functional foods are included since they are foods fortified with one or more biologically active molecules, providing a health benefit beyond basic nutrition. The depth study of foods chemical composition, such as fruits and vegetables, is a deal of great actuality for prevention, as it may lead to the discovery of new functional foods without any added cost22.
For disease prevention, an optimization of composition of vegetables and fruits would be very cost-effective. Recognized candidates as potentially health promoting compounds, and ones which are currently under investigation in many research projects include organosulphur compounds.
The research on functional foods has focused on broccoli and on a single bioactive component within broccoli, sulphoraphane. Indeed, active components present in these vegetables, as isothiocyanates and indole-3-carbinol, showed an anticarcinogenic action has been extensively studied in experimental in vivo22.
47
2.1 Glucosinolates
2.1.1 Structure and properties
Glucosinolates (GLS) are naturally occurring polar molecules classifiable as (Z) β-thioglucosides N-hydroxysulfate endowed with a lateral chain (R) and a β-D-glucopyranosil moiety linked to S-atom (Figure 19). GLS are produced by over sixteen plant species as Brassicaceae, Capparaceae e Caricaceae (broccoli, rocket salad, cabbage and mustard)22. In particular, GLS are the main responsible of organolectic properties of these vegetables.
Figure 19. Structure of glucosinolates
GLS are hygroscopic, highly hydrophilic compounds having a 1octanol-water partition coefficients ranging from -1 to -3. They have a good thermostability (stable up to 110 °C in their purified form, while even more stable if in their natural matrix) and occur in nature as extremely water soluble anions. Because of the sulfate group acidity, glucosinolates are concentrated in plant vacuoles as potassium salts.
They could be classified by the chemical structure of their lateral chain in aliphatic, ω-metilthioalchylic (alifatic glucosinolates), aromatic or etherocyclic (aromatic glucosinolates) chains. Among them, many glucosinolates present linear or branched lateral chains, double bonds, carbonyl groups, hydroxyl groups and thio-groups in different oxidation states.
Glucosinolates total content in leaves is about 1% of the dry weight but its amount reaches 10% in some seeds23. Glucosinolates are biosynthesized starting from glucose and aminoacids23. Briefly, their biosynthesis is composed by three steps24: lateral chain elongation, glucone synthesis and structural modifications of the lateral chain.
48
Elongation proceeds thanks to specific genes. Once completed lateral chain elongation, biosynthesis proceeds with the N-oxydrilation, followed by decarboxylation to form an aldoxime. Such aldoxime is oxydized to tiohyroxamic acid, which is glycosylated on the S-atom obtaining a desulphoglucosinolate. Finally the desulphoglucosinolate is converted to glucosinolate thanks to the addition of a sulphate group by the action of the enzyme desulphoglucosinolate sulphatetrasferase (PAPS). Reactions modifying aminoacid lateral chain are mainly oxidation reactions on the S-atom, alchilic portions desaturation and double bond hydration.
2.1.2 Glucosinolates metabolism: isothiocyanates
Glucosinolates are hydrolyzed by myrosinase enzyme to produce a wide range of degradation products with different biological activities. Indeed, myrosinase is an endogenous thioglucohydrolase enzyme present in plants that cleaves off the glucose group from a glucosinolate with the production of thiohydroxammate O-sulphonate derivative. This intermediate decompose to several hydrolysis products: isothiocyanates (ITCs), thiocyanates, nitriles, epithionitriles, oxazolid-2-thiones and indolyl compounds (Figure 20). Among the degradation products of GLS, ITCs show the most important biological activity and nutraceutical applications, as reported above.
49
2.1.3 Biological activity and nutraceutical applications
The epidemiological evidence for cancer protection25 associated with consumption of Brassica vegetables is attributed to the glucosinolates. However, cancer cell toxicity experiments have demonstrated that GLSs are not bioactive25. In contrast, their degradation products, isothiocyanates (ITCs), show important biological activity. In particular they are able to influence phase I and phase 2 biotransformation enzyme, thereby possibly influencing several processes related to chemical carcinogenesis, e.g. the metabolism, DNA-binding and mutagenic activity of promutagens25. Their anticarcinogenic action depends on many factors, such as the test system, the target tissue, the type of carcinogen challenge and the anticarcinogenic compound, their dosage, as well as the timing of the treatment.
In addition, ITCs showed an antinflammatory, bactericide26, fungicide27 and nematocide28 activity.
By far the major ITCs well studied are erucin, sulforaphane, allilisothiocyanate, phenetilisothiocyanate and indole-3-carbinol (
Figure 21) which derive, respectively, from glucoerucine, glucoraphanin, sinigrin,
gluconasturtiin and glucobrassicin.
On the other hand, negative effects of glucosinolates on animals are related to its concentration in diet. In particular, thiocyanates, thiourea and oxazolidithione may disrupt iodine availability to thyroid thus affecting thyroid function29. Other adverse effects of glucosinolate metabolites are goitrogenecity30,31,32, mutagenecity, hepatotoxicity and nephrotoxicity33,34. The negative influence of dietary glucosinolate on animal growth and production may be related to the drastic endocrine disturbance induced by antinutritional factor35. The reduced intake of GLSs containing diets is due to the presence of sinigrin and progoitrin, these both glucosinolates are associated with bitter taste36.
50
Figure 21. Glucosinolates metabolites best characterized
2.1.4 Glucosinolates and isothiocyanates determination
techniques
Considering the great importance of glucosinolates, many extraction and quantitation methods have been developed.
The current analytical method for the glucosinolates is the ISO 9167-1 protocol37 in which the glucosinolates are converted to desulphoglucosinolates (DS-GLS, Figure 22) using an enzymatic treatment “on column”. This reaction is performed into columns filled with anion exchange resin and conditioned using an acetate buffer. After conditioning a purified sulphatase and the extracts were loaded and left for 72 hours at room temperature allowing the reaction to complete. Then, desulphoglucosinolates are eluted with water, injected into HPLC column using a C18 as stationary phase and detected by UV. For the quantification, desulphobenzylglucosinolate as internal standard, desulphosinigrin as external standard and apposite correction factors for each analyte are used. The ISO protocol, however, is an indirect analysis method whose accuracy is strictly related to the conversion yield, it is quite slow; it has low sensitivity (0.1 µmol/mL) and low selectivity37.
51
Moreover little modifications to this protocol were done but the interlaboratories data often are in disagreement to each other. Although many HPLC-ESI-MS/MS methods were developed, the ISO protocol continues to be the most popular glucosinolates analysis method. Indeed, this method is fully validated and gives satisfying results (linearity range 0.1-3 µmol/mL; precision and accuracy 12% for both).
The glucosinolates quantification was performed by GC in which GLSs were esterified by trimethylsilyl chloride, purified and injected into GC-column38 but this way totally replaced by the introduction of new HPLC methods of analysis.
Different HPLC-ESI-MS/MS methods have been proposed, allowing new compounds discovery and the improvement of the chromatographic separations. Complex separations of many glucosinolates in vegetables matrices have been performed, up to 12 analytes, with high selectivity and accuracy39. However, methods for the simultaneous quantification of glucosinolates and isothiocyanates were not developed to date. This may be due to their weak absorption at UV detectors and their bad ionization in negative mode into MS sources. However the development of an efficient sample extraction and clean-up and quantitative method applicable simultaneously to both GLSs and ITCs would be of high scientific and practice interest, as it may give the opportunity to monitor GLSs stability into functional foods in relation to their hydrolysis products.
52
2.2 Aim and rationale
Glucosinolates and their associated degradation products have been recognized long for their distinctive benefits to human nutrition and plant defense.
Due to their beneficial effects, different functional foods were developed. Concerning GLSs, their stability during the whole industrial processing should be monitored to ensure the activity of functional foods, from cultivation to consumer processing40. In this way consumers will receive a functional food that is of higher nutritive quality and thus provides increased health benefits.
It was demonstrated that some GSLs and their breakdown products are to be toxic, and even carcinogenic, at high concentrations41. Thus, an overconsumption of these compounds could have serious health consequences42 as high-dose−effect relationships are as yet unknown in humans43.
The quantification of GLSs in functional foods is regulated by ISO 9167-1 procedure, based on their preliminary conversion into desulphoglucosinolates and a successive HPLC-UV quantitation, using desulphosinigrin as external standard and specific correction factors for each analyte. This method is based on indirect quantitation and accuracy is strictly related to the conversion yield. For a complete conversion, in fact, a reaction time of three days is required, so this kind of analysis is extremely long. Moreover UV detector is not very sensitive and selective and it could not provide an accurate quantification in less concentered samples. A direct, more robust and sensitive method could greatly optimize analysis time and could be applied into food industry for a quick and efficient quantification of these analytes into different matrices.
The aim of this work is the development and validation of an HPLC-ESI-MS/MS method for the simultaneous separation and quantification of intact glucosinolates and isothiocyanates. This method will be applied to different matrices containing glucosinolates, in order to trace their profile.
53
2.3 Experimental
2.3.1 Materials and reagents
Glucoraphanin (GRA) and glucoerucin (GER) as standards and rocket salad seeds, broccoli and crackers extracts were supplied by Consiglio per la Ricerca e la Sperimentazione in Agricoltura, Centro di Ricerca per le Colture Industriali of Bologna (CRA-CIN).
Sinigrin (SIN) standard was purchased from Sigma-Aldrich (Milano, Italy).
Sulforaphane (SFN) and erucin (ERN) standards were purchased from Santa Cruz Biotecnology (Texas, U.S.A).
2.3.2 Calibration standard
Glucoraphanin, glucoerucin and sinigrin standard stock solutions were prepared in water/methanol 50:50 (v/v) at a concentration of 5 mg/ml and stored at -20 °C. Standard working solutions were prepared by dilution of the stock solutions in water/methanol 50:50 (v/v), in order to obtain concentrations ranging from 5 to 500 µg/ml. These working solutions were stored at 4 °C and used at most for a week. Quality controls (QCs) at concentrations 1.7, 6.7 and 16.7 µg/ml were prepared before analysis by dilution of the working solutions in 5:95 (v/v) formic acid 0.5 % in acetonitrile/formic acid 0.5% in water.
Concerning isothiocyanates, sulforaphane and erucin stock solutions were prepared dissolving precise amounts of standard sample into acetonitrile, obtaining a final concentration of 2.5 mg/ml. These stock solutions were stored at -20 °C. Standard working solutions were prepared by dilution of stock solutions in acetonitrile, obtaining a final concentration in the range 5 – 250 µg/ml. These working solutions were stored at 4 °C at most for three days. Quality controls (QCs) at concentrations 16.7, 125 and 200 µg/ml were prepared before analysis by dilution of the working solutions in 5: 95 (v/v) formic acid 0.5 % in acetonitrile: formic acid 0.5% in water.
54
2.3.3 Liquid chromatography and mass spectrometry: method
validation
Waters Alliance 2690 Chromatograph (Milford, MA, USA) with 120 positions autosampler and thermostat was used. Mass spectrometer triple quadrupole and electrospray interface (QUATTRO LC, Waters) was used for quali-quantitative analysis Analytical separation was conducted on a WATERS X-select CSHTM C18 5.0 µm (2.1 mm*150 mm) column
2.3.3.1
HPLC optimization
The mobile phase used to achieve a good separation between the main glucosinolates, glucoraphanin (GRA), sinigrin (SIN), glucoerucin (GER) and the main isothiocyanates, sulforaphane (SFR) and erucin (ER), was formic acid 0.5 % (v/v) in acetonitrile (solvent A) and formic acid 0.5 % (v/v) in water (solvent B) using a gradient elution (10 min at 5% A and 4 min at 24% A, 4 min at 50% A, 7 min at 80% A, 5 min at 5%) at 0.15 mL min−1 flow rate. The analytical column was maintained at 30°C and the sample volume injected was 20 µL. In the optimized analytical conditions, the mean retention times were for GRA 6.3± 0.2 min, SIN 8.2 ± 0.2 min, GER 16.9 ± 0.2 min, SFR 17.2± 0.1 min and ER 26.8 ± 0.2 min. The total ion chromatogram (TIC) for each analyte was reported in Figure 23.
55
Figure 23. Total ionic current (TIC) of A) GLSs B) ITCs
A
B
56
2.3.3.2 ES mass spectrometry optimization
Ionization and revelation parameters were optimized for each analyte (Table 6).
Table 6. Ionization parameters for main Glucosinolates and isothiocyanates
Instrumental parameters GRA ER SIN SFR ER
Ionization mode - - - + + Capillary voltage (kV) 3.0 3.0 3.0 3.0 3.0 Cone voltage (V) 35 35 35 15 15 Source temperature (°C) 130 130 130 130 130 Desolvation temperature (°C) 410 410 410 410 410 Nebulizer rate (L/h) 65 65 65 65 65 Desolvation rate (L/h) 1065 1065 1065 1065 1065 RCE (%) a 30 30 30 Collision gas Ar Ar Ar Ar Ar Parent ion (m/z) 436 420 358 178 162 Daughter ion (m/z) 372 259 162 114 162
In Figures 24-28 are reported MS/MS spectra for each analyte with respective fragmentation reactions.
For quantitation, each analyte molecular ion has been used, while for assessing specificity has been monitored the most intensive fragmentation reaction using MRM acquisition mode.
57
Figure 24. Glucoraphanin MS/MS spectrum
58
Figure 26. Sinigrin MS/MS spectrum
59
60
2.3.3.3 Method Validation
HPLC-ESI-MS/MS method has been validated according to ICH guidelines.
Detection limit (LOD) and quantitation limit (LOQ)
LOD and LOQ of each analyte, expressed as 3 and 10 times signal to noise ratio respectively, have reported in Table 7.
Table 7. LOD and LOQ values for glucosinolates and isothiocyanates LOD (ng/mL) LOQ (ng/mL) GRA 2.5 5.0 GER 5.0 25 SIN 25 100 SFR 50 100 ER 250 500 Linearity range
Linearity was studied in the range from 0.5 to 50 µg/ml for each glucosinolates and from 5 to 250 µg/ml for isothiocyanates.
Linear calibration curve parameters were obtained from the plot of the analyte peak area/internal standard peak area versus analyte concentration using a least squares regression analysis (weight = 1/x2). The performance of the analytical method was monitored using three quality control samples (QCs) having 4.5 nM for QC low, 20 nM for QC med and 45 nM for QC high.
61
Accuracy (bias %) and Precision (CV %)
Method precision and accuracy, expressed as bias% and CV% respectively, were determined intraday and interday using QCs samples. In Table 8 and in are reported intraday and interday precision and accuracy values for glucosinolates and isothiocyanates.
Table 8. Precision and accuracy values for glucosinolates and isothiocyanates
GRA GER SIN
µg/mL bias (%) CV (%) bias (%) CV (%) bias (%) CV (%)
Intraday 1.67 (QC low) 0.92 -0.20 1.01 -9.78 0.38 -8.61 6.67 (QC med) 1.91 5.60 1.36 -10.0 1.18 -7.91 16.67 (QC high) 0.59 2.52 3.92 -1.99 1.32 1.86 Interday 1.67 (QC low) 2.91 1.60 1.86 -6.99 2.32 -2.20 6.67 (QC med) 1.67 8.70 2.06 -5.05 1.54 -1.40 16.67 (QC high) 0.91 4.58 0.58 6.50 1.35 6.68