Testing the “Waterbed” Effect in Mobile Telephony
1Christos Genakos2 and Tommaso Valletti3 November 2009
Abstract
This paper examines the impact of regulatory intervention to cut termination rates of calls from fixed lines to mobile phones. Under quite general conditions of competition, theory suggests that lower termination charges will result in higher prices for mobile subscribers, a phenomenon known as the “waterbed” effect. The waterbed effect has long been hypothesized as a feature of many two-sided markets and especially the mobile telephony industry. Using a uniquely constructed panel of mobile operators’ prices and profit margins across more than twenty countries over six years, we document empirically the existence and magnitude of this effect. Our results suggest that although regulation reduced termination rates by about 10%, this also led to a 5% increase in mobile retail prices. We also provide evidence that both competition and market saturation, and most importantly their interaction, affect the overall impact of the waterbed effect on prices.
1 We would like to thank the editor, three anonymous referees, Steffen Hoernig, Tobias Kretschmer, Marco Manacorda, Elias Papaioannou, Jonathan Sandbach, Jean Tirole, Francesc Trillas, John Van Reenen, Julian Wright, and seminar audiences in Barcelona, Berlin, Brussels (Bruegel/IDEI conference), London, Mannheim, Rome, Paris, Tarragona (8th CEPR Empirical IO meeting), Turin, Valencia (EARIE) for helpful comments and discussions. We are also grateful to Bruno Basalisco for research assistance. We acknowledge research funding from Vodafone. The opinions expressed in this paper and all remaining errors are those of the authors alone.
2 University of Cambridge & Centre for Economic Performance, London School of Economics, e-mail:
[email protected], Web: http://www.sel.cam.ac.uk/personal/genakos/
3 Imperial College London, University of Rome “Tor Vergata” & CEPR, e-mail:
1
1. Introduction
It is well known that telecommunications networks interconnect in order to allow consumers of one network to be able to successfully complete a call to another consumer connected to a different network. What is perhaps less known is that there are considerable interconnection payments between networks that customers do not directly see but that have significant effects on the call prices they pay. The most important of these interconnection services is call termination. This allows a subscriber on one network to call a subscriber on another network.
In this paper we focus on fixed-to-mobile termination rates (MTRs)4 that have become the regulators’ focus of concern worldwide in recent years. A large theoretical literature has demonstrated that, independently of the intensity of competition for mobile customers, mobile operators have an incentive to set MTRs that will extract the largest possible surplus from fixed users.5 To understand why, consider that mobile subscribers join just one network, and so callers on the fixed telephone network must route calls through a mobile subscriber’s chosen network. In other words, the receiving party chooses which mobile network to subscribe to, but the calling party (i.e., the fixed customer that originates the call) usually has no influence on this choice. The party that pays the termination charge (indirectly through retail prices) therefore has limited or no influence on the choice of network. This curbs considerably the downward pressure on MTRs. A mobile operator, even if competing against other mobile operators, holds a monopoly over delivering calls to its subscribers and will therefore set high MTRs. As a result, regulators are increasingly finding mobile operators to be dominant in setting MTRs. This has provided a rationale for imposing a remedy and cutting these rates. However, reducing the level of MTRs can potentially increase the level of prices for mobile subscribers, causing what is known as the “waterbed” effect. The main purpose of this paper is to examine the existence and magnitude of the waterbed effect in the mobile telephony industry.
The idea behind the waterbed effect is intuitive. Each mobile customer makes, as well as receives, calls. As argued above, a mobile network is a “bottleneck” for received calls, and money can be made over their termination. Thus, each potential mobile customer comes with a “termination rent”, which leads mobile operators to
4 These are the charges mobile operators levy on fixed network operators for call termination.
5 See, for example, Armstrong (2002), Wright (2002), and Valletti and Houpis (2005). Armstrong and Wright (2009) also provide an excellent overview of the mobile call termination theoretical literature and policy in the UK. Bomsel et al. (2003) estimate that, as a result of high MTRs, there has been a transfer of 19 billion euros from the fixed to the mobile sector over the period 1998-2002. The figure is calculated as the excess of termination charges paid over costs, in France, Germany and the UK alone.
2 compete for these customers, by offering them attractive deals. If regulation cuts this termination rent, then mobile operators may compete less aggressively and the bill paid by mobile customers will go up.
Both regulators and academics have recognized the possibility that this effect might be at work. The first such debate started in 1997 in the UK with the original investigation by the Monopolies and Mergers Commission (now Competition Commission). The Commission broadly endorsed the analysis of the UK telecommunications regulator, Oftel, that competition in the mobile industry did not constrain fixed-to-mobile termination charges and that a price cap was the only remedy likely to address these detriments effectively. The Commission considered that this would yield significant welfare gains without an increase in average retail mobile prices. In fact, it was during these investigations that the term “waterbed” was first coined by the late Prof. Paul Geroski, chairman of the Competition Commission.
In 2005, the New Zealand Commerce Commission introduced similar regulation and while it was convinced that the waterbed effect is a theoretically general phenomenon, it doubted its empirical importance. Similarly, the most recent termination rate proposals by UK’s Ofcom (Oftel’s successor organization) acknowledged the importance of the waterbed effect, but questioned whether the effect is “complete”, in the sense that a reduction of, say, 1 euro in termination rents would push up the mobile bill also by 1 euro, arguing that this can only be the case if the retail market is sufficiently competitive.6
Yet, despite the importance of the waterbed effect for welfare calculations, no systematic evidence is available on its existence or magnitude. Detecting this effect with casual empiricism is difficult. Anecdotal experience tells that both termination rates and mobile prices have come down over time. Does this imply there is no waterbed effect? Not necessarily, because the positive waterbed effect on subscription prices might have been compensated by a number of countervailing factors, such as tougher industry competition with additional firm entry, or technological reasons, such as technological progress or economies of scale due to growth in traffic volumes.
In this paper we analyze the impact of MTR regulation on mobile prices and profit margins using a newly constructed dataset of mobile operators across more than twenty countries during the last decade. Our identification relies on the assumption that regulation influences retail prices only indirectly via reducing the termination rates and on the knowledge that regulators did not intervene in any other direct
3 manner on consumer prices. Using quarterly frequency data and employing panel data techniques that control for unobserved time-invariant country-operator characteristics and general time trends, we are able to quantify for the first time the waterbed effect.
The timing of the introduction of regulated termination rates, but also the severity with which they were imposed across mobile firms, varied widely and has been driven by legal and institutional aspects of each country. This variability allows us to measure the impact on prices (and profits) through the MTR from countries that introduced this regulation compared to the general evolution of prices (and profits) in non-reforming countries. We also explicitly account for the possibility that regulatory intervention is the outcome of a bargaining (or lobbying) process between operators and the relevant authority by distinguishing between countries that introduced substantial cuts in MTRs and countries that regulated them but only mildly.
Our results suggest that although regulation reduced MTRs by about ten percent, this also led to a 5% increase in mobile retail prices, varying between 2%-15% depending on the estimate. This roughly translates to a 25 euros (varying from 10 to 82 euros) increase on the yearly bill per subscriber, or some 750 million euros (300 to 2,400 million) extra in total in our sample. This waterbed effect is shown to be robust to different variable definitions, estimation methods and datasets.
While the waterbed is shown to be high, our analysis provides evidence that it is not “complete”: accounting measures of profits are positively related to MTR. Mobile firms tend to keep part of termination rents instead of passing them on to their customers, and thus suffer from cuts in termination rates. Our empirical analysis also reveals that both competition and market saturation, and most importantly their interaction, affect the overall impact of the waterbed effect on prices: the waterbed effect is stronger the more intense competition is in markets with high levels of market penetration and high termination rates. In addition, we discuss how the waterbed effect has a differential impact on different customer types, namely those on pre-paid (pay-as-you-go) deals as opposed to those on post-paid contracts, in line with predictions from a recent literature on network interconnection.
Our paper is related to an emerging literature on “two-sided” markets that studies how platforms set the structure of prices across the two sides of the business (see, e.g., Armstrong, 2006, Rochet and Tirole, 2006, and Nocke et al., 2007). Telecommunications networks are examples of two-sided markets: providing communication services to their own customers over the same platform and providing connectivity to their customer base to other networks. Whenever we look at two-sided
4 markets, the structure of prices (i.e., who pays for what) is important for the development of the market. In mobile telephony, network operators make money from different sources: from own customers making calls, and also from other people trying to contact own customers. Our work therefore also contributes to the more general understanding of two-sided markets. Recent empirical works on two-sided markets include Rysman (2004, on yellow pages; 2007, on credit cards), Argentesi and Filistrucchi (2007, on newspapers), and Kaiser and Wright (2006, on magazines).
The paper is organized as follows. In section 2 we summarize the theoretical predictions concerning the waterbed effect. Section 3 describes our empirical strategy and section 4 discusses the data used. Section 5 presents the main results. Section 6 analyzes how the level of competition and market penetration interact with the magnitude of the waterbed effect, together with other extensions. Section 7 concludes.
2. The waterbed effect: theory
Network interconnection occurs when two networks establish a link to allow customers of one network to communicate with customers of the other network. Imagine a customer of the fixed network F who wants to call a customer of the mobile operator M. This call, to be completed, uses network M as its termination segment. In all European countries, as in most of the world, there is a calling party pays system (CPP) in place.7 Under CPP, the service is initiated, and paid for, by the caller F to the mobile phone M, not by the mobile phone owner. Operator F thus needs to buy termination services from network operator M, which is the only operator which can sell the input necessary to complete the call. Therefore, the termination segment of the call (for which the MTR is paid) presents itself as an economic ‘bottleneck’ for the buying operator F.8
The mobile customer cares most about the prices she has to pay to subscribe to and place calls with a mobile operator, but in most cases she will not take into account the prices paid by other callers to contact her. CPP is a source of distortion in this market, since it is the ‘wrong’ party that gets the full bill: the caller pays, but the
7 The U.S. is a noticeable exception in that there is a RPP (receiving party pays) system. For this reason, it is sometimes perceived that the termination problem does not exist in the U.S., where telecoms interconnection rates are very low. Actually, the U.S. is regulated too. Interconnection rates are so low, not because of market forces, but because of the intervention of the FCC (for instance, termination on a mobile network is regulated at the same long-run incremental cost of termination on an incumbent fixed network). This system has not changed over time. The U.S. also has a system of geographic numbers that does not allow to distinguish between calls terminated on fixed or mobile networks. For these reasons, the U.S. is not included in our sample.
8 This term is used, more in general, in the literature on two-sided platforms (Armstrong, 2006). In the case of fixed-to-mobile calls, the fixed users do not have a choice of which mobile platform to join in order to reach a particular mobile user. Thus the mobile platform is a ‘bottleneck’ for these calls.
5 mobile network subscription is decided by somebody else. Once a person has decided to join a particular mobile operator M, that operator has a monopoly position over termination services from F to its subscribers. These services are paid for by other users subscribing to F, not by the subscribers of M themselves.
This problem has been extensively analyzed in the literature, which has concluded that there is a need to regulate MTRs (Armstrong, 2002; Wright, 2002).9 In the next section we introduce a simple model that shows the implications of cutting MTRs. We show that lower MTRs result in higher bills to mobile customers (the “waterbed effect”). We also show how mobile retail prices are related crucially to termination rates, the intensity of competition, and the degree of market saturation of mobile phones in a given country.
2.1 The waterbed effect for fixed-to-mobile calls
In this section we discuss a logit model of demand that gives rise to the waterbed effect. Our intention is not to introduce a model for structural estimation, but rather to reassure that the waterbed effect is a common phenomenon under a wide range of market structures. There are N consumers, each of whom potentially subscribes to one of the n mobile operators or else chooses not to subscribe. The utility associate with non-purchase is denoted by V0. When V0 is very low, then the market is “covered” or “saturated” and every consumer subscribes to one operator. The utility from buying from firm i which sells a whole bundle of services at a total cost of Pi is:
i i
i U P
U = − +µ ,
where U is assumed to be identical across consumers and products, while µi is a
random taste parameter which reflects the idiosyncrasies of individual tastes. This parameter is known to the consumer but is unobserved by the firms.
The logit demand functions are obtained by assuming that all the µi are i.i.d. and
follow the double exponential distribution with zero mean. As shown by Anderson et al. (1992), in this case the market share of firm i is the probability of a consumer choosing it and is given by:
9 Notice that most of the debate has evolved around the case of fixed-to-mobile calls for a good reason. The ‘other’ way of a communication, from the mobile network M to the incumbent fixed network F, has always been regulated in every country. The incumbent fixed network F has also an ‘obligation to interconnect’ and cannot refuse it. Therefore the fixed network F cannot be expected to exert countervailing buyer power when MTRs are set (see Binmore and Harbord, 2005, for a discussion).
6 ] / exp[ ] / ) exp[( ] / ) exp[( 0 1 σ σ σ α V P U P U n j j i i + − − =
∑
= ,where σ is a constant, which is related to the degree of product differentiation. It can be shown that when σ → 0 the variance of µi tends to zero. In this case, the
multinomial logit reduces to a deterministic model. By contrast, when σ → ∞, the heterogeneity in tastes is also very large and the deterministic part of the utility, Ui,
has no predictive power and consumers behave as if they were completely random. For ease of exposition, we assume that all calls made are to fixed users and all calls received are also from fixed users.10 Thus the profit of operator i is:
{ { rents n terminatio bill ) ( i i Ii i = P−c N+ TQ Π α .
The expression above shows that each mobile network operator derives revenues from two possible sources:
• Services to own customers: these would include subscription services and outgoing calls. All these services are bundled together and cost c whereas the customer pays Pi, i.e., Pi is the total customer’s bill, while it is assumed that
there are no other costs for terminating calls.
• Incoming calls: these are calls received by own customers of firm i but made by customers of fixed networks. The total quantity of these calls to firm i is denoted by QIi and the corresponding price received by the mobile operator
(the MTR) is denoted by T and is regulated.11
We further assume that each fixed user calls each mobile user with the same per-customer demand function qI(T). Therefore the total quantity of incoming calls to
network i is QIi =αiNNFqI(T), where NF is the total number of fixed users. Then the
profit function simplifies to:
N c Pi i i =( − +τ)α Π ,
10 Calls to/from other mobile users could be easily accommodated in this framework, see Calzada and Valletti (2008). In section 6.2 we discuss the implications of this extension.
11 Under regulation, T and the corresponding rent are determined by the Regulator in each country. If
left unregulated instead, firms would set T to maximize the rent per mobile customer, independently from the intensity of competition in the market for mobile customers (see Wright, 2002).
7 where τ =TQIi /(αiN)=TNFqI is the termination rent per mobile customer.
Since σ α α α i(1 i) i i P − − = ∂ ∂
, it is straightforward to show that there exists a unique Nash equilibrium in prices which is defined implicitly as the solution to:
(1) * * 1 α σ τ − + − = c P , where ] / ) exp[( 1 * 0 * σ α P U V n+ − + = .
The corresponding equilibrium profit of this interior solution is:
(2) σ α α ) 1 ( * * * − = Π .
We can now state our main prediction.
Proposition 1 (waterbed effect). Lower termination rates are associated with higher
bills to mobile customers.
Proof. From totally differentiating the two equations (1), after a few manipulations,
we obtain: (3) 0 ) 1 ( ) 1 ( 0 * 2 * 2 * * < + − − − = ∂ ∂ α α α α τ P ,
where α0 =1−α*n represents the share of the residual market which is not served by any mobile service. The same qualitative result applies to the waterbed effect with
respect to the termination rate T, instead of the termination rent τ, as
0 * * < ∂ ∂ = ∂ ∂ τ P q N T P I F . QED
Proposition 1 states that the lower the MTR the higher the customer bill, i.e., the waterbed effect exists under general conditions of competition and product differentiation. It is also easy to show that other comparative statics properties of the equilibrium are in line with one’s intuition (see also Anderson et al., 1992). In particular, the mobile retail price declines with the number n of competing firms, and with the degree 1/σ of product homogeneity. The intensity of competition and other structural parameters are expected to affect somehow the waterbed effect. This is considered in the next result.
8
Proposition 2 (market structure). The waterbed effect on mobile prices is stronger
the more intense competition is. The effect of competition is also magnified by market saturation. The waterbed effect is strongest in saturated and competitive markets.
Proof. The role played by market saturation is obtained from (3). If the market is
saturated (i.e., every customer has a mobile phone), then the residual market is zero, 0
0 =
α , and there is a “complete” waterbed effect, ∂ */∂τ =−1
P , as any termination
rent is entirely passed on to the consumer. If instead the market is not saturated, i.e., the demand for mobile phones is elastic at the equilibrium prices, then α0 >0, and the magnitude of the waterbed effect on the bill P* given by (3) is greater the smaller is
*
α , and therefore is bigger in absolute value when there are more competing firms or producing more homogenous products. Finally, note that the monopoly (or perfectly collusive) case has to be qualified when α0 =0. When no one buys the outside option (V0 → -∞) and n = 1, then α∗ → 1 and P* is not given by (1) but would instead be set as high as possible to just ensure participation of mobile customers. Only in this
limiting case, / 0 0 1 * ∂ = ∂ −∞ → = V n T P . QED
Our last result concerns the impact of the waterbed effect on total profits.
Proposition 3 (profits). When the industry is perfectly competitive, exogenous
changes in termination rates have no impact on profits as there is a “complete” waterbed effect. On the other hand, when the industry is not perfectly competitive, the waterbed effect is less than “complete” and profits are negatively affected by regulatory cuts of termination rates.
Proof. We can obtain first the impact on equilibrium market shares of a change of the
termination rent τ: 0 ) 1 ( ) 1 ( 1 0 * 2 * 0 * 2 * * > + − − = ∂ ∂ α α α α α α σ τ α ,
from which the impact on profits (2) is immediate, as profits increase with α*, thus
0 /
* ∂ >
Π
∂ τ . The magnitude of this effect depends again on the intensity of
competition and on how important the outside option is. If the market is saturated, 0
0 =
α , there is a “complete” waterbed effect, having no overall impact on profits. If instead the market is not saturated, α0 >0, then the more intense competition the bigger the impact of changes in termination rents. QED
To sum up, in this section we answered our fundamental question: what is the effect of a cut of MTRs, below the level that would have been set by unregulated mobile firms? Clearly, the price of fixed-to-mobile calls would become cheaper after this cut, and more calls would be placed. This is the main aspect regulators have typically been interested in. However, there is also another effect that we have emphasized: the total bill paid by M will go up as a result of the cut of the MTR, via
9 the waterbed effect. We also made additional predictions on the magnitude of the waterbed effect and its impact on the profitability of mobile firms, according to the intensity of competition and to the degree of penetration of mobile telephony. In particular, if demand were perfectly inelastic (a saturated market, which is quite close to the reality in many countries today), the waterbed effect on mobile prices would still be at work in competitive markets, as it only depends on the zero profit constraint of competitive firms. A pure mobile monopolist, instead, would in this limiting case of a saturated market set the mobile price just to ensure participation of the last mobile customer, thus extracting her willingness to pay, and the resulting price would be unrelated to any termination rent. Propositions 1-3 constitute our three main predictions that we put to a test.12
3. Econometric Specification
Our empirical analysis is based on the following instrumental variable (IV) regression models:
(4) lnPujct = αujc + αt + β1ln(MTR)jct + εujct (4a) lnΠjct = αjc + αt + β1ln(MTR)jct + εjct
The dependent variable in (4) is the logarithm of retail prices (lnPujct) for the usage profile u = {low, medium, high} of mobile operator j in country c in quarter t. The dependent variable in (4a) is the logarithm of earnings before interest, taxes, depreciation and amortization (EBITDA), which is defined as the sum of operating income and depreciation and is our proxy for profits (lnΠjct). Time fixed effects (αt) and usage-operator-country (αujc) or operator-country (αjc) fixed effects control for time-invariant global trends and (usage-)operator-country characteristics respectively. The main variable of interest, ln(MTR)jct, is the logarithm of the mobile termination rates charged by mobile operators for terminating calls on their networks.
The idea here is to estimate the waterbed effect on prices directly through the MTRs using regulation as an instrumental variable: Regulationjct, is for the moment a
12 As a more technical remark, since our empirical specification is in double logs, the coefficients of interest will be readily interpreted as elasticities. When relating our findings to whether the waterbed effect is “complete” or not, we observe that the relevant test should be conducted on the profit equation, i.e., looking at the impact of cuts in MTRs on profits (which should not change if any termination is entirely passed on to the customer, e.g., in a fully competitive situation). In Genakos and Valletti (2007) we show how, in general, one should not expect a unit elasticity for the bill price when the MTR changes, even in a model with perfect competition, as demand elasticities and cost shares will have an impact too. Hence, we warn against a too simplistic interpretation of the price elasticities.
10 binary indicator variable that takes the value one in the quarters when mobile termination rates are regulated. Regulation is a potentially valid instrument as it is not expected to influence retail prices other than the impact it induces via MTRs. This is because regulation acts on prices only indirectly via reducing MTRs, while regulators do not intervene in any other direct manner on customer prices. This approach also allows us to recover directly the elasticity of the waterbed effect by looking at β1.
Due to the inclusion of (usage-)country-operator and time fixed effects, the impact of regulation on prices (or profits) through the MTR is identified from countries that introduced this regulation and measures the effect of regulation in reforming countries compared to the general evolution of prices or profits in non-reforming countries. In other words, countries that introduced regulation can be thought of as the “treated” group, while non-reforming countries are the “control” group.13 The “waterbed” prediction is that, ceteris paribus, regulation has a negative impact on MTRs (first stage estimates), which in turn (second stage estimates) has a negative effect on prices in (4) and a zero or positive effect on profits in (4a) depending on whether the effect is “complete” or not.
This fixed effect specification allows us to control for time-invariant country-operator characteristics that may influence both regulation and prices or profits. Importantly, it allows us to control for cost differences across mobile operators due to differential access to spectrum frequencies (e.g., some operators have access to 900 MHz spectrum, other only to 1800 MHz) or differences in the cost of network deployment. Furthermore, the specification also accounts for common global trends.
One important concern regarding this IV specification is that the consistency of the estimator requires strict exogeneity of the regulation variable. For example, our results would be biased if countries and operators, which have witnessed slower decrease in prices (including F2M prices) than comparable countries, were more likely candidates for regulation.14 The direction of causation here would be reversed: because of high retail prices, then MTRs are regulated.
What we observe empirically is the exact opposite of the above concern. Figure 1 plots the average (time and usage-country-operator demeaned) prices in countries that have experienced a change in regulation, six quarters before and after the introduction
13 In fact the simplest way to estimate the waterbed effect would be through a difference-in-difference specification. Results are identical to the ones reported here (see Appendix B, available on request). 14 As analyzed in section 2, if left unregulated mobile operators have every incentive to charge “too high” termination rates independently from the competition they face and hence the level of retail prices. In principle, therefore, we expect every country to regulate MTRs sooner or later, which is indeed what we observe in the data.
11 of regulation. As we can see, compared to prices in the rest of the world, average prices in countries that experienced a change in regulation were actually lower before the introduction of regulation. Moreover, in line with our predictions, the introduction of regulation has a clear positive impact on prices that becomes stronger as regulation becomes progressively more binding over time.15 Hence, classical reverse causality seems to be less of a concern in our context.16
Another endogeneity concern could be that regulatory intervention is the outcome of a bargaining (or lobbying) process between firms and the relevant authority, where affected firms will try to minimize the reduction on their MTRs and therefore the impact of regulation on prices and their profits.17 Indeed the large variability in MTRs across and within countries after the introduction of regulation can be taken as indirect evidence supporting this claim. Figure 2 plots the average (time and country-operator demeaned) profits (EBITDA) in countries that experienced a change in regulation, six quarters before and after the introduction of regulation. Compared to the rest of the world, profits of mobile operators in countries that experienced a change in regulation were actually higher before the introduction of regulation and were severely hit following its introduction. Hence, Figure 2 suggests that, despite any lobbying or bargaining effort, regulation had a strong negative effect on profits exactly as predicted by the theory when firms have market power.
[Insert Figure 1, 2]
However, someone still may argue that if firms were really successful in securing the best possible deals from regulators that would bias upwards any evidence of a waterbed effect when using only a binary indicator for regulation. We tackle this possibility head-on by distinguishing between countries that have introduced
15 Note that regulation does not take the form of a one-off intervention, hence we should not expect prices in affected countries to reach a new “steady state”. Termination rates are typically regulated over some period using “glide paths”, in which charges are allowed to fall gradually towards a target over the period. In other words, the continuous upward trend in prices after the introduction of regulation is another manifestation of the power of the waterbed effect as prices seem to respond with every tightening of the termination rates. We explore the effect of regulation over time in detail in section 5.2. 16 In a related vein, we also checked growth rates of prices (again, time and usage-country-operator demeaned) in various groups of countries. Countries which experienced the introduction of regulation, did not show any significant variation in growth rates compared to countries which have been unregulated throughout the period, before regulation was introduced. In contrast, growth rates of prices in countries which experienced the introduction of regulation were significantly different from growth rates of prices in countries unregulated throughout the period, after regulation was introduced.
17 Note that the operator fixed effects would capture any “permanent” ability of mobile firms to influence the regulators or the government. Hence, the argument here can possibly refer here only to firms’ bargaining or lobbying activities that have time-varying effectiveness.
12 substantial price cuts in MTRs and countries that have regulated MTRs too but only mildly. In the spirit of Card and Kruger (1994), we construct two additional indices. The first one is:
⎪ ⎩ ⎪ ⎨ ⎧ − = regulated is if d unregulate is if 0 index jct jct jct ct jct jct MTR MTR MTR MaxMTR MTR MaxMTR
In other words, when the country is unregulated, the index takes a value of zero. If instead the country is regulated, the index takes larger values the more regulated a mobile operator is, compared to the operator that is regulated the least in the same country and period. This index takes advantage not only of the different timing of the introduction of regulation across countries, but also of the widespread variation on the rates imposed across operators within countries. This variation in regulated MTRs was particularly evident in countries where there was a large asymmetry between the “large” incumbents and the “small” entrants. While from a theoretical point of view the “bottleneck” problem exists independently from the size of an operator, in practice, regulators have been more reluctant in cutting the MTRs of the new entrants. They did this most likely with the idea of helping them secure a stronger position in the market. Thus new entrants have been either unregulated for many periods (while the incumbents were regulated at the same time), or they have been regulated only mildly, while more substantial price cuts were imposed on the incumbents. Hence, in this index, the highest MTR within a country at every period becomes the benchmark for comparing how tough regulation has been on the rest of the firms.
Our second regulation index is based on the same principle, but restricts the sample to only those countries for which we know with certainty that there is at least one fully unregulated operator. For example, the UK was one of the first countries to introduce termination rates regulation, but throughout this period mobile operator 3 (Hutchison) was left completely unregulated. Thus, for the purposes of this index we use the termination rates that this firm was charging as a benchmark for all the other firms. This exercise restricts our sample size, but makes the identification even more transparent and exogenous. Hence, the second index is:
13 ⎪ ⎩ ⎪ ⎨ ⎧ − = regulated is if d unregulate is if 0 index jct jct jct ct jct jct MTR MTR MTR dMTR Unregulate MTR dMTR Unregulate
In other words, the index takes the value of zero when the country is unregulated. If instead the country is regulated, we construct an index comparing the rate each operator is regulated to the one charged by the unregulated firm in the same country and period. Both these indexes allow us to get different measures of the severity of regulation in each country and period.
A related endogeneity concern could be that the countries that introduced the regulation in our sample are not a “random” representative sample. One potential story behind this sample selection argument could be that the worst affected firms would try their best to delay the introduction of any regulation. Since we only observe a sample of countries that introduce MTR regulation later than some others, our waterbed effect estimates might be upward biased.
Regulatory intervention does not occur randomly, but is the outcome of a long regulatory and political process. However, this process regarding MTRs has been driven in practice by legal and institutional aspects. The UK has been at the forefront and started regulating MTRs already back in 1997. Other countries followed suit. Importantly, the European Commission introduced a New Regulatory Framework for electronic communications in 2002. The Commission defined mobile termination as a relevant market. Procedurally, every Member State (EU 15 at the time) was (and still is) obliged to conduct a market analysis of that market and, to the extent that market failures were found, remedies would have to be introduced. Indeed, all the countries that completed the analysis did find problems with no single exception, and imposed (differential) cuts to MTRs (typically, substantial cuts to incumbents and either no cut or only mild cuts on entrants). Hence, the timing of the introduction of regulated MTRs, but also the severity with which they were imposed across mobile operators has been driven by this regulatory process and varied widely across countries with no systematic pattern.18
18 Very importantly, regulators have restricted powers to intervene on retail mobile prices. In order to do that, they would have to find either single dominance (i.e., monopoly power), or joint dominance (i.e., tacit collusion, which is extremely difficult to prove in courts). In fact, in our sample, no regulator has ever imposed any remedy on mobile retail markets. Table A4 in the Appendix presents the countries and timing of MTR regulation’s introduction in chronological order. There is no discernible pattern across countries and their timing of regulation’s introduction, with both the earlier group of countries and the one that introduced MTR regulation last being a mix of more developed and less developed countries.
14 Another consideration for our framework is that, conditional on (usage-)country-operator and time fixed-effects, we omit any other time-varying factors that might affect prices (such as competition or market saturation) or regulation itself. We will thus allow for regional-time fixed effects (section 5.1), and also augment our model to explicitly consider the influences of market structure and market saturation (section 6.1). Finally, in section 5.2 we examine the dynamic impact of the introduction of regulation allowing for flexible time-varying effects of regulation on prices (Laporte and Windmeijer, 2005) with the aim of distinguishing among any anticipation, short-run and long-short-run effects.
Yet, in spite of the various model permutations and controls, someone may still argue that some time-varying aspects of the political and regulatory environment might be correlated with the timing of the introduction of regulation. A number of recent papers (Besley and Case, 2000; Duso and Röller, 2003; Duso, 2005) indicate the importance of these regulatory and political variables for the assessment of market outcomes. Note that country-operator fixed effects in our framework control for the average effectiveness of the regulatory and political environment. Moreover, as discussed above, after the adoption of the EU framework in 2002, literally every country in our sample (both within and outside EU) introduced this regulation within a period of four years. Hence, although we find it unlikely that the efficiency of regulatory authorities has changed so quickly19 within such a short period of time, it is important to bear in mind this caveat when interpreting our results.
4. Data
For the purpose of our analysis we matched three different data sources. Firstly, we use Cullen International to get information on mobile termination rates. Cullen International is considered the most reliable source for MTRs and collects all termination rates for official use of the European Commission. Using this source and various other industry and regulatory publications, we were also in a position to identify the dates in which regulation was introduced across countries and operators.
Secondly, quarterly information on the total bills paid by consumers across operators and countries is obtained from Teligen. Teligen collects and compares all available tariffs of the two largest mobile operators for thirty OECD countries. It constructs three different consumer usage profiles (large, medium and low) based on the number of calls and messages, the average call length and the time and type of
19 Note that all regulatory and political effectiveness indexes that we are aware of have at best an annual frequency, while our dataset is on a quarterly basis.
15 call.20 A distinction between pre-paid (pay-as-you-go) and post-paid (contract) is also accounted for. These consumer profiles are then held fixed when looking across countries and time.
Thirdly, we use quarterly information taken from the Global Wireless Matrix of the investment bank Merrill Lynch (henceforth, ML). ML compiles basic operating metrics for mobile operators in forty-six countries. For our purposes, we use the reported average monthly revenue per user (ARPU) and the earnings margin before interest, taxes, depreciation and amortization (EBITDA). Through this source we also obtain information on penetration and number of mobile operators in each country, together with the number of subscribers and their market shares for each operator.
All consumer prices, termination rates and revenue data were converted to euros using the Purchasing Power Parities (PPP) currency conversions published by the OECD to ease comparability. None of our results depends on this transformation. More detailed data description, together with the dates of the introduction of regulation and summary statistics, can be found in Appendix A.
The various datasources have different strengths and weaknesses regarding our empirical question. The Teligen dataset has two main advantages. First, by fixing a priori the calling profiles of customers, it provides us with information on the best choices of these customers across countries and time. Second, the prices reported in this dataset include much of the relevant information for this industry, such as inclusive minutes, quantity discounts, etc. (although it does not include handset subsidies). However, this richness of information comes at the cost of having data for only the two biggest operators of every country at each point in time (although they cover 80 percent of the market on average). For instance, if a country, such as the UK, had five mobile operators, possibly regulated differentially over time, only two observations per customer profile would be available. This reduces the variability and makes identification of our variables of interest harder, especially given that the biggest mobile operators are often regulated at the same rate.
On the contrary, the ML dataset provides us with information on actual revenues rather than prices. The dependent variables that we use are primarily EBITDA (a measure of accounting profit and cash flow) and ARPU (which consists of all revenues, including revenues from MTR). These are aggregate measures encompassing all revenues associated with mobile voice services. Therefore, they have to be interpreted as measures of an operator’s revenues and profitability rather
16 than the total customer bill. Both these accounting measures clearly suffer from endogeneity problems, which could introduce bias and inconsistency in our results. However, this dataset contains useful information on all mobile operators and hence it allows us to exploit more within-country variation. For this reason, we have decided to use also this data, with the purpose of corroborating our main results.
5. Results
Table 1 reports our benchmark results from specifications (4) and (4a).21 The first three columns use the price information from Teligen as the dependent variable. The data for these columns consist of the best possible deals for each user profile among all possible contracts available, both pre-paid and post-paid. For that reason, we also add a binary variable (Pre-paidjct) indicating whether the best deal was on a pre-paid contract or not.22 First stage results across all columns confirm that regulation has a significantly negative effect on MTR as expected. In addition, regulation does not seem to suffer from any weak-instruments problems as indicated by the first stage F-tests. Column 1 shows that that regulation through MTR has indeed a negative and significant effect on prices. The magnitude of the elasticity of the waterbed effect is above 1. Over the period considered, regulation has cut MTR rates by 11% and, at the same time, has increased bills to mobile customers by (-0.11) × (-1.207) = 13.3% (the waterbed effect). Notice that the coefficient on pre-paid is insignificant, indicating that prices on the pre-paid deals were no different than those on monthly contracts.
In column 2, the elasticity of the waterbed effect is lower at 0.938 using the more sophisticated index of regulation MaxMTR, but still negative and highly significant. This 4.7% waterbed effect roughly23 translates to a 25 euros increase on the yearly bill per subscriber, or some 750 million euros extra in total in our sample.24 Similarly, in column 3 when we restrict our sample to only those countries we know with certainty had at least one unregulated operator, we still get a negative and significant effect.25 Notice also that the coefficient on pre-paid becomes now negative and significant, indicating that pre-paid customers were getting significantly better deals from the two
21 All reported standard errors are based on a generalized White-like formula, allowing for country-operator(-usage) level clustered heteroskedasticity and autocorrelation (Bertrand et al., 2004).
22 It is important to mention that the MTR is applied uniformly and does not distinguish, say, between calls to heavy users on contracts and calls to low users on prepaid. However, the waterbed price reaction of the mobile firm to changes in MTR can in principle differ by type of user or call, since their profile of received calls can differ, or the intensity of competition can differ by type of user too.
23 Based on the average price paid the year before the introduction of regulation for the countries that experience a change in regulation in our sample.
24 Based on the average number of subscribers the year before the introduction of regulation. 25 The elasticities are not directly comparable as the regulatory variables have different mean values.
17 main mobile operators when they were faced with an unregulated competitor. A potential explanation of this result is that incumbent firms were offering better deals to pre-paid customers only when faced with unregulated rivals as a way of protecting their overall market share, but also putting pressure on the prices charged by them.
Next, we look at the impact of regulation on profitability measures using specification (4a). The last three columns on Table 1 report the effect on EBITDA, while we relegate similar results on the impact on ARPU to Appendix B. Column 4 shows that regulation had a negative effect on profit margins, although the data is considerably noisier. Using our two indexes, instead of the binary regulation variable (columns 5 and 6), reveal again a negative relationship, though the effect is not statistically significant.
We must remark that the ML dataset is probably less reliable than the Teligen dataset, so we take our conclusion on accounting profits more cautiously. In addition, all these results have to be qualified as termination rents could be also exhausted with non-price strategies, i.e., increasing advertising, or giving handset subsidies that we cannot control for. However, we do not expect handset subsidies effects to be too relevant for pre-paid customers, and the test on EBITDA should take these additional factors into account. If handset subsidies were linked to inter-temporal subsidies (short-run losses are incurred to get long-run profits from captive customers), our results on profitability are, if anything, biased downwards. This is because a cut in MTR would look more profitable as fewer losses are made in the short run.
Taken together these benchmark estimates confirm our theoretical intuition that there exists a strong and significant waterbed effect in mobile telephony. If markets were fully competitive there should be no impact on profits (“complete” waterbed effect). However, these results seem to suggest that competitors have some degree of market power as their profits are negatively affected post regulation, albeit with considerable less statistical precision.
[Insert Table 1]
5.1 Robustness
In Table 2 we examine the robustness of our benchmark estimates. In the first two columns we restrict our data by excluding the countries that were unregulated throughout our sample. First stage estimates of regulation on MTR are almost unchanged, while the overall waterbed effect increases slightly. Next, we estimate an
18 even more restrictive version of our model by allowing for regional-time fixed effects. Our sample of countries can be naturally divided into three macro regions: Western Europe, Eastern Europe and Rest of the World (Australia, New Zealand and Japan).26 Western European countries have been all subject to the New Regulatory Framework adopted by the European Commission, while other Eastern European countries have only recently been subject to regulation with the accession of new member States. Controlling for these regional effects in columns 3 and 4, results in an even stronger waterbed effect (15.2% and 5.1% respectively), without reducing its statistical significance.27
Similar conclusions can be drawn for the effect of regulation on EBITDA. In columns 5 and 6, where our control group consists of the regulated countries, the negative effect of regulation is stronger using the binary indicator for regulation and negative but not significant when using the MaxMTR index. The inclusion of the regional-time fixed effects in columns 7 and 8 increases the magnitude of the waterbed effect without affecting much their statistical significance.
[Insert Table 2]
5.2 Dynamic regulation effects
The effect of regulation on prices might not be just instantaneous. On the one hand, termination rates are typically regulated over some periods using “glide paths”, in which charges are allowed to fall gradually towards a target over that period. The temporal adjustment path is known and anticipated by operators, at least before a new market review is conducted. On the other hand, there could also be some inertia. For instance, customers may be locked in with an operator for a certain period, therefore there would be no immediate need for mobile operators to adjust their prices as these customers would not be lost right away. Alternatively, when termination rates change, it may take some time for operators to adjust retail prices because of various “menu” costs. Hence, we would like to investigate whether firms anticipated regulation (possibly by trying to affect the outcomes of the regulatory process) and indeed whether the effect of regulation was short-lived or had any persistent long term effects. To quantify these dynamic effects of the waterbed phenomenon, we define
26 These joint region-time fixed effects should also control for any potential scale economy effects enjoyed by mobile firms operating in multiple neighbouring countries.
27 We do not report results using the UnregulatedMTR index with the regional-country fixed effects because the Western Europe region binary indicator includes all the countries that had one operator being not regulated.
19 binary indicators for twelve, non-overlapping, quarters around the introduction of regulation and a final binary variable isolating the long-run effect of regulation. Our specification now is a simpler difference-in-difference model allowing for flexible time-varying effects of regulation on prices and profits:
(5) lnPujct = αujc + αt + β1DT-6jct + β2DT-5jct + …+ β12DT+5jct + β13DT+6jct + εujct (5a) lnΠjct = αjc + αt + β1DT-6jct + β2DT-5jct + …+ β12DT+5jct + β13DT+6jct + εjct
where DT-6jct = 1 in the sixth quarter before regulation, DT-5jct = 1 in the fifth quarter before regulation, and similarly for all other quarters until DT+6jct = 1 in the sixth quarter after regulation and in all subsequent quarters. Each binary indicator equals zero in all other quarters than those specified. Hence, the base period is the time before the introduction of regulation, excluding the anticipation period (i.e., seven quarters before regulation backwards). This approach accounts for probable anticipation effects (as captured by DT-6 to DT-1 binary indicators) as well as short (captured by DT to DT+5) and long run effects (captured by DT+6).28
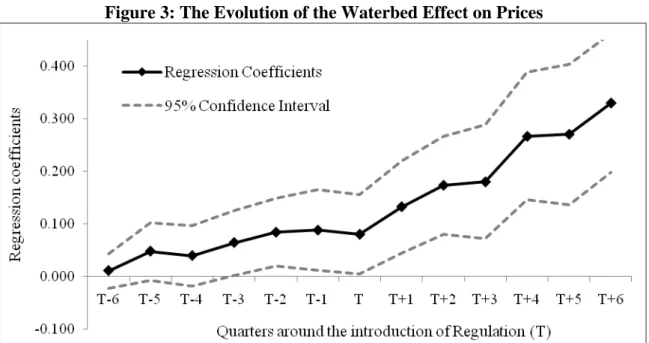
Figure 3 plots the regression coefficients on these binary indicators from (5) together with their 95% confidence interval. As expected, regulation has no effect on prices six to four quarters before the actual implementation. However, there is some small but statistically significant anticipation of the regulatory intervention three to one quarters before. As discussed before, for the large majority of countries regulation was preceded by a long consultation period launched by the regulator. Our results reveal that operators started cutting MTRs slightly and adjusted their price schedules upwards even before the actual implementation of the new termination rates.
However, it is the actual implementation of the regulation that has the biggest impact on prices as revealed by the immediate increase on the coefficients after regulation. In other words, regulation is binding from the beginning and as it tightens up over time, the waterbed effect increases. As we can see in Figure 3, regulation also seems to have a large and very significant long-run waterbed effect. The coefficient estimate on DT+6, which quantifies the effect of regulation on prices post the sixth quarter after its introduction, is strongly significant and implies a long run elasticity of the waterbed effect of 33%. Note that this coefficient is not directly comparable to the previous estimates of the waterbed effect, as it incorporates the effect not only of the introduction of regulation, but also of the progressive tightening of termination rates.
20 What is crucial is that prices seem to respond continuously with every tightening of the rules giving rise to a waterbed phenomenon that is not a one-off event.
Figure 4 plots the regression coefficients together with their 95% confidence interval for (5a). Post regulation there is a very clear negative trend on the estimated coefficients (similar to the one in Figure 2), albeit considerably noisier than the waterbed effect on the total bill. Strictly speaking, the only statistically significant coefficient is the one that captures the long run effect, DT+6, indicating that the regulation had a strong negative effect on profits post the sixth quarter after its introduction. In other words, the negative effect of regulation on profits seem to appear with a significant delay compare to the waterbed effect on prices. This could be either because EBITDA is only an imperfect, accounting proxy for profits or due to non-price strategies (that we do not observe) adopted by the operators trying to counterbalance the immediate impact of the waterbed effect on prices.
[Insert Figure 3, 4]
6. Interaction with competition and further evidence 6.1 Competition and market penetration
Having established that the waterbed effect exists and has a strong long run effect, we now want to investigate in greater detail how competition affects this phenomenon. Competition is obviously expected to have a direct impact on prices: the more competitive the market, the lower the prices to customers. Besides this effect, however, if termination rates are “high” (e.g., unregulated) or a substantial mark-up is allowed, competition is expected to have an additional impact via the waterbed effect: the more competitive the industry, the lower the prices will be, on top of the direct effect, as any termination rent will be passed on to the customers. As discussed in Section 2, a waterbed effect is expected to exist also under monopoly, though the effect is milder as some rents will be kept by the monopolist. However, the waterbed effect is not expected to be very relevant under monopoly when the market is very saturated and the monopolist still has an interest in covering it. Hence, in our empirical specification it is crucial to control for subscription penetration levels, since this is a good proxy for subscription demand elasticity at different stages of the product life cycle of mobile telephony. Our specification reads:
21 (6) lnPujct = αujc + αt + β1ln(MTR)jct + β2ln(competitors)ct + β3ln(penetration)ct +
γ1[ln(ΜTR)jct×ln(competitors)ct] + γ2[ln(ΜTR)jct×ln(penetration)ct] +
γ3[ln(penetration)ct×ln(competitors)ct] + δ[ln(ΜTR)jct×ln(competitors)ct×ln(penetration)ct] + εujct
Equation (6) is an extension of our previous specification (4) with the aim to specify a particular channel that might affect the intensity of the waterbed effect.29 Our proxy for the intensity of competition is simply the number of rival firms (competitorsct) in each country and period. The number of mobile operators in a country can be taken as exogenous as the number of licences is determined by spectrum availability. Over the period considered, several countries have witnessed the release of additional licences. The degree of market saturation/maturity is measured as the percentage of the population with a mobile phone (penetrationct). Our main coefficient of interest is δ, where MTR is interacted both with the intensity of competition and with the degree of market saturation.
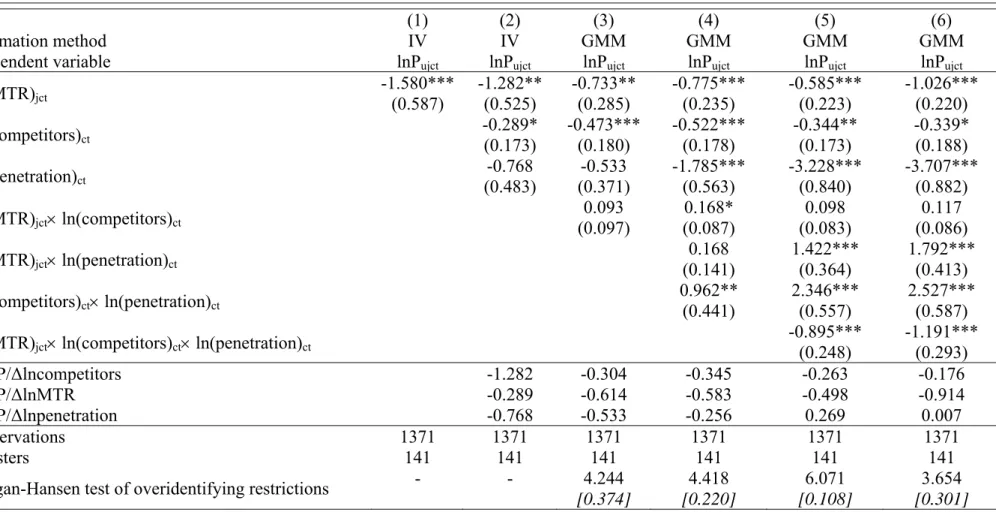
Results are reported in Table 3. Column 1 is the baseline waterbed effect, comparable to that of column 1 in Table 1, restricted to the sample of firms and countries for which we have information on all these variables. Column 2 shows that a larger number of competing firms exerts the expected negative impact on prices. In column 3,30 the coefficient on the interaction between the competition variable and MTR is positive but insignificant, whereas in column 4 when we introduce all interaction terms, this coefficient becomes positive but barely significant.31
As we discuss in our theoretical section, the effect of competition on termination rates would differ depending on the level of market saturation and for that reason in column 5 we introduce our preferred specification which includes this triple
29 This specification might also be viewed as correcting for other time varying factors that might affect prices or regulation itself, conditional on the country-operator and time fixed effects. A spurious correlation pointing towards a high waterbed would arise if, for example, a country is not regulated but is competitive and has low prices, while another country is regulated with low MTR but is also quite concentrated, so it has high prices: so far we attribute econometrically higher prices to the waterbed (via regulation), even if - in principle - the waterbed effect did not exist at all. While this seems highly unlikely (typically, countries with low MTRs are also competitive, at least anecdotally, which should give rise to the opposite bias) and runs contrary to the evidence presented in Figure 1, we explicitly consider the influences of market structure and market saturation here.
30 The instruments used for this specification are: regulation, interactions of regulation with the other exogenous variables (namely competitors and penetration), the number of own products for each mobile operator in the market (to capture the intensity of competition in the product space, à la Berry et al., 1995) and interactions of the residuals (from the regression: MTR on competitors, penetration, regulation and the various fixed effects) with competitors and penetration (Wooldridge, 2002). First stage results are reported in Appendix B (available on request).
22 interaction term.32 Our coefficient of interest, δ, is negative and strongly significant indicating that the waterbed effect is stronger the more intense competition is in markets with high levels of market penetration and high termination rates. This result is in line with our theoretical predictions where we pointed out the need to control for penetration levels when comparing competitive markets with concentrated ones.
Notice that the direct waterbed effect still exists in all markets, as β1 is negative and very significant. The rest of the coefficients are also reassuring. We find that competition has a strong, negative direct impact on prices, besides any waterbed effect (β2 = -0.344) and that prices are also systematically lower in more mature markets (β3 = -3.228). When MTR is simply interacted with competition, not controlling for penetration levels, there is no statistically significant relationship.
We also find a positive and significant coefficient on the simple interaction between MTR and saturation (γ2 = 1.422) and on the interaction between the number of competitors and market saturation (γ3 = 2.346). Although these coefficients are not our main focus, a couple of comments are in place. A positive coefficient on γ2 indicates that the waterbed effect is lower in higher penetration markets. Intuitively, low penetration markets usually consist of heavy users for whom the waterbed effect is expected to be strong. But as the market becomes more saturated, this typically involves attracting marginal users who make and receive very few calls. Hence, we expect the waterbed effect to decrease as the market becomes more saturated because of the different types of consumers that are drawn into the mobile customer pool. On the contrary, we have no prior expectations on the coefficient γ3 as there is no strong reason to believe that, controlling for the number of competitors, the impact of competition should be more or less intense as the market saturates. On the one hand, a negative coefficient would arise if operators become less capacity constrained and compete more fiercely. On the other hand, if operators in mature markets tend to collude more easily over time, the result would be a positive coefficient.
Finally, in column 6, where we use as an instrument the MaxMTR index instead of the binary variable Regulation,33 we confirm the conclusions previously drawn. Results are unaffected for the majority of the coefficients, with the direct waterbed effect (β1) and the coefficient on the triple interaction (δ) becoming even stronger.
32 The instruments used are the same as in the previous column 4 with the addition of the triple interaction of the residuals (from the regression mentioned in fn 30) with competitors and penetration. 33 The rest of the instruments used are the same as in column 5.
23 We also experimented using the HHI index instead of the simple number of competing operators, as a different measure of competition. While the coefficient on the triple interaction (δ) is still significant and has the expected sign (now the coefficient is positive, as an increase in HHI means a lessening of competition), some other results are less stable (see Table B10 in Appendix B). In our opinion, this reveals the limitations of our dataset (although HHI is potentially an alternative measure of competition, it clearly suffers from a more serious endogeneity problem than the number of competitors as discussed above) and of our reduced-form methodology regarding the effect of market structure on the waterbed phenomenon. Future research using a structural approach and more detailed country-level data is required to further understand these mechanisms.
[Insert Table 3]
6.2 Mobile-to-mobile calls and the structure of tariffs
The call termination problem that we described in Section 2.1, and then tested in Section 5, is relevant when the market of callers from fixed networks is separate from the market of receivers on mobile networks. This has been the focus of the literature on MTRs and the main concern of regulatory authorities. However, mobile firms also interconnect with each other. There is therefore another termination rate, for mobile-to-mobile (M2M) calls, that should be of interest (see Armstrong and Wright, 2009).
In many jurisdictions M2M rates are not regulated, apart from imposing reciprocity between mobile operators, and therefore cuts in fixed-to-mobile (F2M) rates should not apply to other types of calls. However, in practice, F2M calls can be sometime converted into M2M calls by some special equipment (there exists such a technical possibility, called GSM gateways). Then, if the F2M termination rate is higher than the M2M termination rate, there can be arbitrage opportunities. Thus regulation, even if it formally regulates only the F2M termination rate, may effectively set a limit also for M2M termination. The ‘pure’ waterbed effect from F2M calls can be then confounded by the M2M effects that have been extensively analyzed by the literature on “two way” access charges initiated by the seminal works of Armstrong (1998) and Laffont et al. (1998).
A distinction has been made in this literature between competition in linear prices (which are relevant for pay-as-you go or pre-paid contracts) and competition in multi-part tariffs (which are relevant for post-pay contracts). When competition is in linear
24 prices, firms would ‘collude’ by setting ‘high’ reciprocal M2M termination rates in a typical raising-each-other’s-cost fashion. Thus, if regulation of F2M rates affects also M2M rates, then firms can collude ‘less’. Less collusion means that bills will go down, which would contrast the ‘pure’ waterbed effect. If, instead, competition is in multi-part tariffs, the theory predicts that the higher M2M rates, the more expensive calls per minute, but the lower the fixed fee of the multi-part tariff paid by the customer. This reinforces the waterbed on the total bill, in particular via a big impact on the fixed fee.
Thus we have two additional predictions from the theory. First, the waterbed effect should operate differently between linear mobile contracts, and more complex multi-part tariffs. In particular, the waterbed effect should be stronger for the latter than for the former where it is diluted by the reduced ability to collude. Second, within multi-part tariffs, the waterbed effect should be very strong on the fixed fee.
Our pricing information from Teligen (best deals) allows us to distinguish between pre-pay and post-pay contracts. Pre-pay deals are a good proxy for linear contracts, while post-pay deals are typically composed of a monthly fixed fee and several other charges. Within post-pay contracts, we can thus further distinguish between their fixed and variable amount spend on calls. In line with the theoretical predictions, we found that the waterbed effect is stronger for post-pay contracts compared to pre-paid deals (though it exists overall also for the latter). Moreover, among post-pay contracts, we also found that the effect arises mainly from the fixed fee, while the variable component of the bill is not affected significantly.
There are additional reasons to believe that distinguishing between pre-paid and post-paid customers is important. Customers on long-term contracts may be looking only at similar long-term deals, and may not be interested in a temporary pre-paid subscription, even if this turned out to be cheaper for a while. Switching among operators takes time and for a business user this might not be a very realistic option, even in the presence of number portability. Conversely, customers on pre-paid cards, may have budget constraints and do not want to commit to long-term contracts where they would have to pay a fixed monthly fee for one or more years. Again, these customers may want to look only at offers among pre-paid contracts. For these reasons, we also investigated whether there is a difference in the waterbed effect between pre-paid and post-paid users, when each type of user is limited in her choices within the same type of contracts. We found that the differences between the waterbed effect for monthly subscribers and pre-paid customers are quite large. Additionally,
25 within monthly contracts, the increase of the bill following a cut in MTRs is due to a change of the fixed, rather than the variable component of the bill, as before.34
7. Conclusions
Regulation of fixed-to-mobile termination charges has become increasingly prevalent around the world during the last decade. A large theoretical literature has demonstrated that, independently of the intensity of competition for mobile customers, mobile operators have an incentive to set charges that will extract the largest possible surplus from fixed users. This bottleneck problem provided scope for the (possibly) welfare-improving regulatory intervention. However, reducing the level of termination charges can potentially increase the level of prices for mobile subscribers, the so-called “waterbed” effect.
In this paper we provide the first econometric evidence that the introduction of regulation resulted in a significant waterbed effect ranging from a minimum of 2% up to a maximum of 15%. However, although the waterbed effect is high, our analysis also provides evidence that it is not “complete”: oligopolistic mobile firms keep part of the termination rents instead of passing them on to their customers. Finally, our empirical analysis also reveals that the waterbed effect is stronger the more intense competition is in markets with high levels of market penetration and high termination rates.
Our findings have three important implications. First, mobile telephony exhibits features typical of two-sided markets. The market for subscription and outgoing services is closely interlinked to the market for termination of incoming calls. Therefore, any antitrust or regulatory analysis must take these linkages into account either at the stage of market definition or market analysis.
Second, any welfare analysis of regulation of termination rates cannot ignore the presence of the waterbed effect. If the demand for mobile subscription was very inelastic, the socially optimal MTR would be the cost of termination (though the regulation of MTR would impact on the distribution of consumer surplus among fixed and mobile subscribers). If, instead, the mobile market was not saturated and still growing there would be the need to calibrate carefully the optimal MTR. It is therefore key to understand the behaviour of marginal users that might give up their handsets when the waterbed effect is at work.
34 All results are statistically significant at 1%, resulting in a waterbed effect of 15.9% for post-pay and 5.1% for pre-pay deals. Detailed results are in Appendix B (available on request).