1
Acid and re-esterified rapeseed oils as alternative vegetable oils for rainbow trout 1
diets: effects on lipid digestibility and growth 2
Trullàs, C.1*, Fontanillas, R.2, Tres, A.3, Barroeta, A.C. 1, Sala, R.1 3
1Animal Nutrition and Welfare Service (SNiBA), Department of Animal and Food 4
Sciences, Universitat Autònoma de Barcelona, Bellaterra 08193, Spain;
5
2Skretting Aquaculture Research Center (Skretting ARC), Sjøhagen 3, Stavanger 4016, 6
Norway;
7
3Departament de Nutrició i Bromatologia-XaRTA-INSA, Facultat de Farmàcia, 8
Universitat de Barcelona, 08028 Barcelona, Spain.
9 10 *Correspondence: 11 E-mail: [email protected] 12 [email protected] 13 Phone: +34 935811897 14
Accepted for publication in: Aquaculture (2016) 451: 186-194. 15
https://doi.org/10.1016/j.aquaculture.2015.09.021
16
Abstract 17
The present study aimed at evaluating the effects of dietary acid and re-esterified
18
rapeseed oils as alternatives to native vegetable oils (VO) on growth performance and
19
feed utilization in rainbow trout. Acid oils are a free fatty acid (FFA)-rich by-product
20
from the refining of VO and re-esterified oils are the final product of a chemical
21
esterification process between acid oils and glycerol. Because re-esterified oils have a
22
high content of mono- and diacylglycerols (MAG and DAG), known for being good
23
emulsifiers, a higher nutritive value than that of the native and the acid oils might be
24
expected. A 72-day feeding trial where triplicate groups of rainbow trout were fed eight
2
experimental diets formulated to contain a 15% of a native, a re-esterified and an acid
26
rapeseed oil, in addition to a 5% of fish oil (FO), was carried out. Diets with the native
27
or the re-esterified oils blended with the acid oil were also studied. A commercial fish
28
oil was used for the control diet. Fish fed rapeseed acid and re-esterified oils diets (RA
29
and RE, respectively) showed high fat and total fatty acid apparent digestibility
30
coefficients (ADC) (RA: 90.5±0.3%, RE: 92.5±1.0% for total fat and RA: 95.7±0.1%,
31
RE: 95.8±0.2% for total fatty acids). However, the lowest total fatty acid ADC was that
32
obtained in animals fed RA, which was significantly lower (P<0.05) than that of fish fed
33
the rapeseed native oil diet (RN: 96.7±0.1%). No significant differences in final weight
34
were obtained between fish fed RA (375.9±2.9g) and RE (381.5±11.1g) and those fed
35
RN (393.7±6.1g), even though both values were significantly lower (P<0.05) than that
36
of fish fed the control diet (411.1±3.3g). Nonetheless, fish fed diets including blends of
37
the rapeseed acid and the re-esterified oils (RE/RA and RA/RE) had higher final
38
weights (392.8±4.4 and 394.6±1.6, respectively) than those of RA and RE, although
39
differences were not statistically significant. Furthermore, RA and RE diets did not
40
produce relevant changes in plasma parameters or in the morphology of liver and
41
intestine of fish. Therefore, the inclusion of rapeseed acid and re-esterified oils along
42
with a 5% of FO in aqua feeds does not seem to have negative effects on fat and fatty
43
acid digestibility, growth, plasma parameter or morphology of liver and intestine in
44
rainbow trout. However, before recommending their use, further studies regarding their
45
effects on the final composition and quality of fillets should be carried out.
46 47
Keywords: rainbow trout, acid oil, re-esterified oil, growth, digestibility, by-product. 48
49
Abbreviations 50
3
ADC: Apparent digestibility coefficient(s)
51
ADG: Average daily growth
52
ALT: Alanine aminotransferase
53
AST: Aspartate aminotransferase
54
CF: Condition factor
55
DAG: Diacylglycerol(s)
56
FCR: Feed conversion ratio
57
FFA: Free fatty acid(s)
58
FO: Fish oil
59
GGT: Gamma-glutamyl transferase
60
HDL: High density lipoproteins
61
HSI: Hepatosomatic index
62
LDL: Low density lipoproteins
63
MAG: Monoacylglycerol(s)
64
MUFA: Monounsaturated fatty acid(s)
65
PUFA: Polyunsaturated fatty acid(s)
66
SFA: Saturated fatty acid(s)
67
SGR: Specific growth rate
68
TAG: Triacylglycerol(s)
69
VLDL: Very low density lipoproteins
70
VO: Vegetable oil(s)
71
VSI: Viscerosomatic index
72 WG: Weight gain 73 74 1. Introduction 75
4
There are many studies reporting the suitability of vegetable oils (VO) as an alternative
76
to fish oil (FO) in fish feeds (Fonseca-Madrigal et al., 2005; Sun et al., 2011; Tocher et
77
al., 2003a; Turchini et al., 2009), as they are sustainable and economically advantageous
78
sources. VO are mainly used in both the food and the feed industries, although their use
79
by the biofuel industry has been rising notably since the early 2000s (Gunstone, 2011).
80
In Europe, this is especially remarkable for rapeseed, which is the predominant
81
feedstock for biodiesel production (Haas, 2005). Thus, the competition among
82
industries has caused an increase of grains and oilseed prices (Behr and Pérez Gomes,
83
2010), which in turn has led to the need of finding suitable and economically interesting
84
alternatives to the commonly VO used in fish nutrition. In this regard, the interest of the
85
feed industry for the by- and co-products generated during the crude VO processing has
86
also been growing. Indeed, a significant amount of by-products is generated from crude
87
oil refining processes and can be valuable feedstocks for animal feeds (Dumont and
88
Narine, 2007). Of these products, acid oils from the chemical refining of VO, a free
89
fatty acid (FFA)-rich by-product, were found to be quite promising for feeding uses
90
(Nuchi et al., 2009). In rainbow trout, an apparent digestibility coefficient (ADC) of
91
total fatty acids above 95% was obtained for a diet including rapeseed acid oil, which
92
did not differ from that of the native oil diet, the latter referring to the unrefined and
93
unprocessed oil produced from vegetables (Trullàs et al., 2015).
94
Vegetable acid oils can be chemically re-esterified with glycerol to produce the
so-95
called re-esterified VO. These oils can have a high final content of partial acyglycerols
96
(monoacylglyerols, MAG and diacylglyerols, DAG), amphiphilic molecules that could
97
exert a beneficial effect on digestibility (Fregolente et al., 2009; Martin et al., 2014).
98
Good results in fat absorption and growth performance in broiler chicks and chickens
99
have been obtained when including re-esterified VO in diets (Vilarrasa et al., 2014,
5
2015). Although the digestibility of rapeseed re-esterified oil has been investigated in
101
rainbow trout (Trullàs et al., 2015), growth performance has not yet been assessed. Fatty
102
acid digestibility coefficients of rainbow trout fed re-esterified oils from an unsaturated
103
vegetable source such as rapeseed did not present differences compared to those of fish
104
fed the native oil (Trullàs et al., 2015). Even so, from the economical point of view, acid
105
oils seem to be a more interesting alternative than re-esterified oils since the latter are
106
approximately 100 €/t more expensive due to the added cost of the chemical
107
esterification (Parini, personal communication). The economic viability of re-esterified
108
oils in relation to native oils is variable, since it depends on the price differential
109
between native and acid oils, which is in turn subjected to fluctuation.
110
While digestibility of acid and re-esterified oils is acceptable in rainbow trout (Ng et al.,
111
2010; Trullàs et al., 2015), growth performance and productive parameters have not
112
been investigated (Aliyu-Paiko and Hashim, 2012).
113
Thus, one of the objectives of the present study was to assess the growth performance
114
and the feed utilization of rainbow trout fed acid and re-esterified rapeseed oils in
115
comparison with those of fish fed the native oil. We also aimed at evaluating the partial
116
substitution of the native and the re-esterified oils by graded levels of the more
117
economical acid oil in order to optimize their use.
118
Because diet composition could induce changes in specific plasma haematological and
119
biochemical parameters (Peres et al., 1999), the evaluation of the plasma biochemical
120
parameters and also the morphology of liver and intestine could provide additional
121
information on the effects of the inclusion of these alternative oils.
122 123
2. Materials and methods 124
2.1. Experimental diets 125
6
Experimental diets (45% protein and 21% lipid) contained the same ingredient
126
composition except for the added lipid source (Table 1). Three different types of
127
rapeseed oil – native (RNO), re-esterified (REO) and acid (RAO) – were included in the
128
diets alone (single oil diets: RN, RE or RA) or blended in graded levels (diet RE/RA:
129
66% RE-33% RA; diet RA/RE: 66% RA-33% RE; diet RN/RA: 66% RN-33% RA and
130
diet RA/RN: 66% RA-33% RN) in a proportion of 15%. A 5% of commercial fish oil
131
(FO) was included in all experimental diets. A diet including only commercial fish oil
132
(20% of the diet) was used as a control (F). Experimental oils were provided by SILO
133
S.p.a. (Firenze, Italy) (RNO and REO) and Cargill (Schiphol, The Netherlands) (RA).
134
The re-esterified oil (REO) was produced by SILO S.p.a. as described in Trullàs et al.
135
(2015). Feeds were produced at the Skretting Feed Technology Plant (Aquaculture
136
Research Center; Stavanger, Norway) as extruded pellets. Yttrium oxide (Y2O3) was 137
added to the diets as an inert marker for the apparent digestibility of fatty acids
138
determination. Nutrient composition of experimental diets was determined by standard
139
procedures (AOAC, 2005): moisture (934.01), ash (942.05), crude protein (968.06) and
140
crude lipid (920.39). Unsaponifiable matter was also calculated following AOAC
141
(2005) (933.08) as a quality control. Gross energy of dried feed was determined using
142
an adiabatic bomb calorimeter (IKA-Kalorimeter system C4000, Jankel-Kunkel,
143
Staufen, Germany). Yttrium was analysed in accordance to Austreng et al. (2000). The
144
ingredient formulation and proximate composition of the diets are shown in Table 1.
145
2.2. Fish husbandry and sampling 146
All the procedures were conducted in accordance with the Animal Protocol Review
147
Committee of the Universitat Autònoma de Barcelona (UAB) and following the
148
European Union Guidelines for the ethical care and handling of animals under
149
experimental conditions (2010/63/EU). The trial was carried out at the Skretting Italia
7
SPA (Mozzecane, Italy) facilities. A total of 576 rainbow trout with a mean initial body
151
weight of 101.7±8.80 g were randomly distributed into 24 cylindro-conical tanks of 600
152
l of capacity (24 fish per tank) in an open freshwater system with a continuous water
153
flow of 24 l min-1. Water temperature (14.3ºC) and dissolved oxygen levels (7.4±0.37
154
mg/l) were maintained constant throughout all the experimental period. Tanks were
155
subjected to a 24h light photoperiod. Each diet was randomly assigned to three replicate
156
tanks and was fed twice a day by automatic feeders, adjusted to provide the 2.5% of
157
biomass daily. Uneaten feed was collected by filtering effluent water from each tank
158
and collectors were emptied after each meal and feed intake was recorded daily. At day
159
60, all the fish from each tank were weighed and measured individually before being
160
anaesthetized with clove oil (Phytosynthese, Za de Mozac-Volvic, France; 0.04 ml/l).
161
Faecal samples were collected from the hindgut by manual stripping, after which fish
162
were put into tanks supplied with freshwater to recover from anaesthesia. Samples were
163
pooled by tank and stored at -20°C prior to analysis of yttrium oxide, total fat, fatty acid
164
composition and gross energy. At day 72, five fish from each tank were anaesthetized
165
with clove oil (Phytosynthese, Za de Mozac-Volvic, France), having been previously
166
fasted for 48 hours. Blood samples were then taken from the caudal vein by puncture
167
with a heparinized syringe and collected in 2 ml tubes with heparin (Hospira Inc., CA,
168
U.S.) for further plasma biochemical analyses. Once the blood sampling was finished,
169
five fish from each tank were euthanized in excess anaesthetic and weighed. Liver and
170
viscera were taken and weighed for biometrical measurements. Samples of liver and
171
intestine were also taken and fixed in 10% buffered formalin for histological
172
examination under a light microscopy.
173
2.3. Total fat and fatty acid composition 174
8
Total fat of diets and faeces was determined by Nuclear Magnetic Ressonance (NMR).
175
Fatty acid composition was determined by gas chromatography-flame ionization
176
detector (GC-FID). Fatty acid methyl esters (FAME) were obtained by direct
177
methylation, according to Meier et al. (2006) and analysed using an HP 5890A gas
178
chromatograph. They were identified by comparison of their retention times with those
179
of known standards, and quantified by internal normalization (FAME peak area/total
180
FAME area, in %).
181
2.4. Lipid class composition 182
Lipid class composition (TAG, DAG, MAG and FFA) of FO, RNO, REO and RAO, as
183
well as that of all experimental diets, were determined by size-exclusion
184
chromatography on an Agilent 1100 series HPLC chromatograph equipped with a
185
Refractive Index Detector (RID) set at 35Cº. Oils were melted at 55ºC prior to analysis,
186
and a solution of approximately 10 mg of oil/ml of tetrahydrofurane was prepared. The
187
solution was filtered through a Nylon filter (0.45 µm) and injected (20 µl loop) to the
188
chromatograph equipped with two Styragel columns (StyragelHR 1 and Styragel HR
189
0.5) of 30 cm x 0.78 cm i.d., filled with a spherical styrenedivinylbenzene copolymer of
190
5μm particle size (Water Associates, Milford, MA, USA), connected in series and
191
placed in an oven set at 35°C. The mobile phase consisted of tetrahydrofuran at 1
192
ml/min. For diets, fat was previously extracted with diethyl ether following the method
193
2003.05 from AOAC (2005). Data was expressed as peak area normalitzation (in %),
194
considering the area of the peaks corresponding to TAG, DAG, MAG and FFA.
195
2.5. Calculations 196
Apparent digestibility coefficient (ADC) of fat, fatty acids and gross energy (GE) was
197
calculated as: ADC (%) = 100 − [100 × (Y in feed/Y in faeces) · (F in faeces/F in feed)]
198
(Maynard and Loosli, 1979), where F = fat (mg·kg−1), fatty acid (mg·kg−1) or gross
9
energy (kJ g-1) and Y = yttrium (mg·kg−1). ADC of GE was used to calculate the
200
digestible energy (DE) of the diets.
201
Growth performance, feed utilization and biometrical parameters were calculated
202
according to standard formulae. Weight gain was calculated from WG (g) = final
203
weight-initial weight, feed intake was determined from [total dry matter intake /
204
(number of fish x number of days fed)], feed conversion ratio from FCR = (dry feed
205
fed) / (wet weight gain), specific growth rate (SGR) from [ln(final weight)-ln(initial
206
weight)] / (number of days) x 100 and average daily growth from AVG = (gain %) /
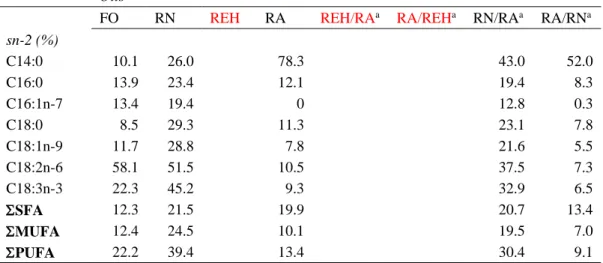
207
(number of days). Furthermore, condition factor (CF) = 100 x [final weight (g)] / [fork
208
length (cm)]3, hepatosomatic index (HSI) = (weight of liver) / (total fish weight) x 100 209
and viscerosomatic index (VSI) = (weight of viscera) / (total fish weight) x 100 were
210
also calculated.
211
2.6. Plasma analyses 212
Plasma was obtained after immediate centrifugation at 11337 g for 2 minutes of the
213
blood samples, pooled per tank and stored at -20 ºC for further analyses. Glucose,
214
protein, triglycerides, cholesterol, free fatty acids, alanine aminotransferase (ALT),
215
aspartate aminotransferase (AST) and gamma-glutamyl transferase (GGT) were
216
analysed using standard clinical methods with an Olympus AU400 – 3112676 chemistry
217
analyser, (Germany).
218
2.7. Liver and intestine histology 219
Samples of liver and intestine fixed in 10% buffered formalin were dehydrated in a
220
graded ethanol series and embedded in paraffin. Sections of 4 mm were stained with
221
haematoxylin and eosin (H&E) (Martoja and Martoja-Pierson, 1970) for morphological
222
observations using a Leica DM5000B microscope (Jenoptik, Germany). Images were
223
taken with ProgRes® CapturePro software (Jenoptik, Germany).
10 2.8. Statistical analysis
225
Data were subjected to a one-way analysis of variance (ANOVA) and the significance
226
of the differences between means was tested by Tukey’s test. Digestibility values are
227
given as means±standard error of the mean of triplicate values, each being a pooled
228
sample from 24 fish. Values of growth performance, feed utilization and biometrical
229
parameters are given as means±standard error mean of triplicate values, each containing
230
information from 24 fish. Differences were considered significant when P<0.05. All
231
statistics were performed by means of the General Lineal Model (Proc GLM) of SAS®
232
software version 9.2 (SAS Institute Inc., Cary, NC, USA).
233 234
3. Results
235
Characterization of experimental oils and diets
236
Results of fatty acid composition and unsaponifiable matter of experimental diets are
237
shown in Table 2. Lipid class composition of experimental oils and diets are shown in
238
Table 3.
239
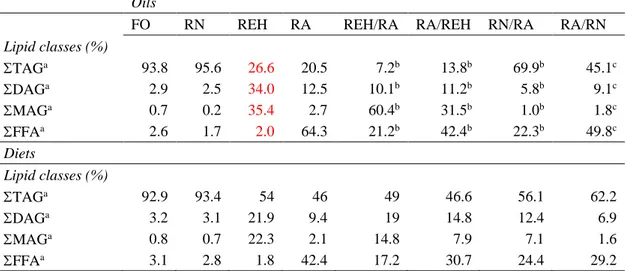
Although differences among rapeseed oils were minor with respect to their fatty acid
240
composition, as seen in diets, they were notable in terms of lipid class composition. FO
241
and RNO were constituted by TAG in more than a 90%, while the re-esterified oil
242
(REO) had a considerable amount of partial acylglycerols (35.4% MAG and 34% DAG)
243
and the acid oil (RAO) was rich in FFA (64.3%). No presence of TAG polymers was
244
observed.
245
As in the oils, minor differences in the fatty acid composition were found among diets.
246
Although their lipid class composition mirrored those of the oils in the case of the
247
natives (F and RN; TAG>90 %), differences were observed in RE and RA. Both in the
11
acid oil diet (RA) and in the re-esterified oil diet (RE) higher percentages of TAG but
249
lower of FFA and partial acylglycerols than in their corresponding oils were obtained.
250
In the blended oils diets, an increase in FFA was observed as more RAO was included.
251
Similarly, an increase of MAG and DAG was observed as a higher level of REO was
252
present.
253 254
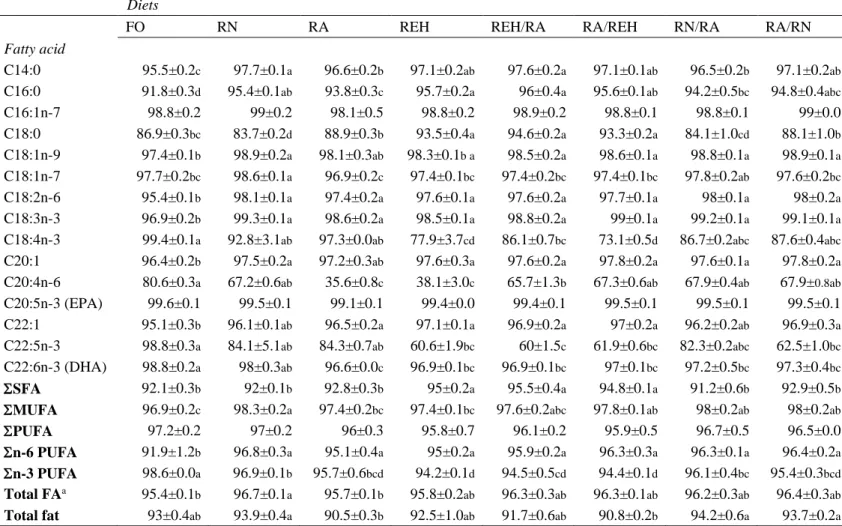
Apparent digestibility of fat and fatty acids of the diets
255
The eight experimental diets were well accepted and total mortality was about 1%.
256
ADC of total fat and total fatty acids of the diets were all above 90% and 96%,
257
respectively (Table 4), being similar or higher than that of F. Minor but significant
258
differences (P<0.05) were found among rapeseed diets regarding total fat and total fatty
259
acids digestibility, the latter being slighter than those of total fat.
260
When single rapeseed oil diets were compared, the lowest total fatty acid ADC was that
261
obtained for RA (95.7±0.1), which was significantly lower (P<0.05) than that of RN
262
(96.7±0.1). In relation to the different categories of fatty acids, it is worth mentioning
263
that significantly higher (P<0.05) ADC values were obtained for SFA (especially
264
palmitic acid, C16:0, and stearic acid, C18:0) in RE.
265
Regarding the replacement of RAO by RNO, no differences due to the level of inclusion
266
of RA were obtained. ADC of total fatty acid of RN/RA and RA/RN resulted in values
267
between those of RA and RN, with no significant differences.
268
Similarly, no differences in total fatty acid ADC were observed as REO was replaced by
269
RAO (RE/RA, RA/RE).
270 271
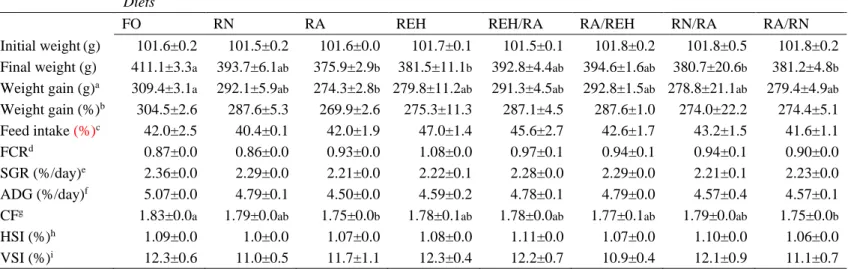
Growth performance, feed utilization and biometrical parameters
12
Results obtained for the performance parameters (Table 5) followed the trend of those
273
of total fatty acid digestibility. As observed, no significant differences (P>0.05) were
274
obtained among the final weights of fish fed RN (393.7±6.1 g), RA (375.9±2.9 g) and
275
RE (381.5±11.1 g). Those of RA and RE were, in turn, significantly lower (P<0.05)
276
than that of F (411.1±3.3 g). Similar results were observed for WG and CF, while no
277
statistical differences were obtained for the rest of the performance parameters studied.
278
As obtained in total fatty acid ADC, final weights of fish fed with RN/RA (380.7±20.6
279
g) and RA/RN (381.2±4.8 g) were in between those of RN and RA. The numerically
280
highest was that of fish fed RN, although this was not statistically higher (P>0.05) than
281
those of animals fed RN/RA or RA/RN. RE/RA and RA/RE diets obtained higher final
282
weights (392.8±4.4 g and 394.6±1.6 g, respectively) than RE and RA, although
283
differences were not significant (P>0.05). Very similar results were observed in WG in
284
all cases. It is noteworthy that, although final weights and WG of fish fed diets
285
including RE/RA and RA/RE did not result statistically higher than those of animals fed
286
diets RN/RA and RA/RN, they were numerically higher.
287
In spite of the differences in final weights observed among diets, these were not
288
reflected in SGR or in FCR.
289 290
Plasma biochemical parameters
291
Values of the analysed plasma biochemical parameters of fish fed the experimental
292
diets are shown in Table 6. Statistically significant differences in glucose, TAG,
293
LDL-cholesterol, AST and ALT were found among the experimental rapeseed diets.
294
Although fish fed diet RE/RA had significantly higher (P<0.05) level of TAG in
295
plasma (565.03±39.52 mg dl-1) than those fed F (384.17±8.09 mg dl-1), RN
296
(431.35±6.25 mg dl-1) and RA (431.60±9.90 mg dl-1), differences did not follow a 297
13
clear trend related to the type of oil or to their level of inclusion. Similarly, in
298
glucose, animals fed RA (67.27±2.36 mg dl-1) and RA/RN (87.45±3.45 mg dl-1) had
299
a significantly higher (P<0.05) glucose plasmatic level than those fed diet RA
300
(67.27±2.36 mg dl-1).
301
Fish fed diets RN and RE had significantly lower (P<0.05) LDL-cholesterol levels
302
(114.67±4.30 mg dl-1 and 125.48±10.98 mg dl-1, respectively) than those fed F
303
(201.67±16.36 mg dl-1). No differences were found in blended oils diets when
304
compared among themselves or among their corresponding single oil diets. However,
305
RE/RA (125.48±10.98 mg dl-1) and RA/RE (116.22±11.78 mg dl-1) were
306
significantly lower (P<0.05) than F. In fact, all diets resulted numerically lower than
307
F.
308
For ALT and AST, animals fed RE (ALT: 3.67±1.20 IU l-1; AST: 5.33±0.67 IU l-1)
309
showed significantly lower (P<0.05) values than those fed F (ALT:20.50±0.50 IU l-1; 310
AST: 20.50±2.50 IU l-1) and RN (ALT: 13.50±2.50 IU l-1; ALT: 11.67±2.40 IU l-1).
311
In relation to RN/RA, RA/RN and their corresponding single oil diets (RN and RA),
312
no differences were observed. Even so, AST and ALT plasmatic levels of fish fed
313
RN/RA (ALT: 10.00±1.73 IU l-1; AST: 9.33±1.45 IU l-1) were significantly lower
314
(P<0.05) than those of fish fed F. For diets with blends of RE and RA, the only
315
significant difference (P<0.05) was found in ALT between RA (10.33±1.67 IU l-1)
316
and RE/RA (2.50±0.50 IU l-1), being RA the highest. Indeed, RA obtained the 317
numerically highest values, although they were not statistically higher, in both
318
parameters. For plasmatic LDL-cholesterol, ALT, and AST, fish fed diet F had the
319
highest values when comparing all treatments.
320 321
Histology of intestine and liver
14
No differences were observed in the morphology of liver or intestine among fish fed the
323
different experimental diets, including F. Normal histology patterns were observed 324
under a light microscope, as presented in Fig 1.
325 326
4. Discussion
327
Minor differences in the fatty acid composition among rapeseed oils were observed.
328
Similarly as it has been described in previous studies (Trullàs et al., 2015; Vilarrasa et
329
al., 2014), the chemical esterification reaction did not have an effect on their fatty acid
330
composition.
331
Regarding lipid classes, both native and acid oils showed the standard composition
332
described for these types of oils. TAG was the predominant molecule (>95%) in RNO
333
(Flickinger and Matsuo, 2003) and FFA represented a 64.3% in the acid oil (RAO)
334
(Nuchi et al., 2009). On the other hand, a high content of partial acylglycerols (69.4%)
335
was present in REO.
336
When the lipid class composition of diets was compared to that of their corresponding
337
oils, differences were observed in diets RA and RE. These differences were mostly
338
related to the 5% of FO added to all the experimental rapeseed diets, which was mainly
339
composed of TAG.
340 341
Both total fat and total fatty acid ADC of the different experimental diets were high
342
(90.5-96.7%), which is in accordance with authors reporting similar results with diets
343
including rapeseed as a FO replacer in rainbow trout (Caballero et al., 2002; Martins et
344
al., 2006; Turchini et al., 2013). This replacement could even increase lipid digestibility
345
at low water temperatures in salmonid species (Caballero et al., 2002; Karalazos et al.,
346
2007).
15
As found in a previous study in rainbow trout (Trullàs et al., 2015), a few differences in
348
fatty acid ADC were obtained among rapeseed diets. For the single oil diets, the
349
numerically lowest ADC of RA could be a consequence of its richness in FFA. As it is
350
widely known in mammals, the main products of the hydrolysis by pancreatic lipase
351
during lipid digestion are FFA and 2-MAG. Taking into account that a bile
salt-352
dependent pancreatic lipase with sn-1,3-specific hydrolytic activity has been pointed out
353
as the main lipolytic enzyme in rainbow trout (Bogevik et al., 2007; Gjellesvik et al.,
354
1992; Tocher, 2003b), we would assume that a similar digestion process as in mammals
355
would take place in this species. Then, the main hydrolytic products would be
356
solubilized or emulsified in bile salt micelles, followed by diffusion to the intestinal
357
mucosa (Tocher, 2003b). The large amount of FFA in RA could produce a “saturation
358
effect” at the time of their incorporation into the mixed micelles during digestion, since
359
the amount of FFA would greatly exceed that of MAG and DAG, responsible of
360
expanding the micelle in order to allow the solubilization of other products. However, to
361
our best knowledge, there is a paucity of information regarding this phenomenon in fish.
362
On the other hand, if present, this effect would possibly be more noticeable if the
363
amount of FFA was mainly constituted of SFA, since high levels of SFA have been
364
reported to negatively affect the formation of micelles in the intestinal lumen of Atlantic
365
salmon (Menoyo et al., 2003).
366
While free MUFA and PUFA are easily absorbed, free long-chain SFA have a poorer
367
absorption as a consequence of their hydrophobicity and high melting points. In native
368
VO, SFA are mainly found in the external positions of TAG (Grundy and Denke, 1990;
369
Karupaiah and Sundram, 2007) and thus are easily converted to FFA during digestion,
370
part of which will form insoluble soaps in the gut to end up excreted in faeces. The fact
16
that the reduction of ADC in RA was slight could be related to the low amount of SFA
372
present in rapeseed.
373
Compared to RN and RA, RE had the significantly highest ADC of SFA, which could
374
be a consequence of the emulsifying effect that the partial acylglycerols exert during the
375
digestion process. As amphiphilic intermediate products of TAG digestion, DAG and
376
especially MAG would facilitate the incorporation of hydrophobic FFA in the core of
377
micelles during fat digestion, as described in humans, mammals and poultry (Da Costa,
378
2003; Krogdahl, 1985; Mattson et al., 1979).
379
Another factor that could have a beneficial effect on the ADC of SFA is that the
380
chemical esterification reaction increases the amount of SFA located at the sn-2 position
381
of acyglycerols, which would imply SFA being directly absorbed as 2-MAG, improving
382
fatty acid digestibility of VO. This rise was of up to 10 points (as % on the total SFA
383
content) in the rapeseed re-esterified oil in comparison to its corresponding native oil in
384
the study by Trullàs et al. (2015). It is possible, though, that the low content of SFA in
385
rapeseed did not exert a clear effect on the total fatty acid ADC. Related to this, Trullàs
386
et al. (2015) concluded that the lipid class composition of the oil seemed to be of less
387
importance as an influential factor on fatty acid digestibility than its degree of
388
saturation. Certainly, the importance of the degree of saturation and the chain length on
389
digestibility as the major factors affecting fatty acid digestibility in fish had been
390
previously pointed out (Francis et al., 2007; Hua and Bureau, 2009). Thus, the slight
391
differences observed in the present work could be due to the predominance of the
392
degree of unsaturation of rapeseed over other factors.
393
When RNO or REO were substituted by graded levels of RAO (RN - RN/RA - RA/RN
394
- RA or RE - RE/RA - RA/RE - RA), no significant effect of the level of inclusion of
395
RAO (100%, 33% or 66%) in diets on total fatty acid ADC was observed. However, in
17
diets with substitution of RN by RAO, there was a slight but progressive decrease of
397
ADC as more RAO was present, which suggests that the ADC of a diet could be in
398
direct relation to the richness of FFA of RA. The detrimental effect on digestibility
399
appears when the level of FFA in diets is of around 30%, regardless of the rest of the
400
lipid classes.
401
In diets with substitution of REO by RAO, total fatty acid ADC of RE/RA and RA/RE
402
were higher than that of RA, indicating a possible effect of the partial acylgycerols and
403
the higher amount of SFA at sn-2 than the rest of diets.
404 405
Final weights of fish fed the experimental single rapeseed oil diets were all high, which
406
is in agreement with many studies in salmonids (Bell et al., 2003; Huang et al., 2008;
407
Pettersson et al., 2009; Turchini et al., 2013). Also, values of FCR and SGR were
408
similar to those obtained in studies including different levels of rapeseed oil in salmonid
409
diets (Caballero et al., 2002; Turchini et al., 2013). As reported for Atlantic salmon,
410
rapeseed oil is an effective substitute of FO in terms of growth rates and feed efficiency,
411
since it provides sufficient energy in the form of monoenoic fatty acids to maintain high
412
growth rates Bell et al. (2001).
413
As has long been reported, rainbow trout require solely linolenic (C18:3n-3) acid as
414
essential fatty acid (Castell et al., 1972) for maximal growth (Watanabe, 1982).
415
Regarding this, it is important to highlight that all our rapeseed diets included 5% of FO
416
in order to ensure a minimum dietary content of n-3 long-chain PUFA. However, fish
417
fed rapeseed diets had lower final weights than those fed diet F, although these
418
differences were significantly lower only in fish fed RA and RE.
18
Final weights of fish fed RN/RA and RA/RN were not different from each other but
420
numerically lower than those of fish fed RN. As observed, detrimental effects in growth
421
appeared in diet RA, but not when RAO was blended with RNO.
422
It is important to remind that the experimental period lasted 72 days, and so a longer
423
period of time could have shown noticeable differences among diets regarding final
424
weight and especially SGR and FCR.
425
The higher final weights obtained in fish fed RE/RA and RA/RE compared to those fed
426
RE and RA seemed to be caused by a synergism between REO and RAO, the causes for
427
this being probably those previously described for digestibility.
428 429
Haematological and biochemical parameters reflect the physiological processes
430
undertaken in an animal and give information about its physiological status (Peres et al.,
431
2012). Moreover, fatty acid structure and also its position on the glycerol backbone
432
have an influence on plasma lipids in both humans (Dubois et al., 2007) and fish
433
(Denstadli et al., 2011).
434
In the present study, no clear relation was obtained between glucose and TAG among
435
diets regarding the type of oil (native, re-esterified and acid) or their level of inclusion
436
(100%, 66% or 33%). Therefore, the dietary fatty acid composition could have had a
437
greater effect on plasma parameters than these two factors, because oleic acid, the main
438
fatty acid in rapeseed, had been shown to be neutral with regard to plasma lipids in
439
studies in humans (Clarke et al., 1997; Grundy, 1986).
440
For the lipoproteins cholesterol, LDL-cholesterol was the only one to show significant
441
differences among diets, although they were not clearly related to the different types of
442
oils. This is in accordance with studies reporting a decrease in plasma and
LDL-443
cholesterol in salmonid species fed VO-based diets when compared to fish fed F (Jordal
19
et al. 2007; Richard et al. 2006). In a study with rainbow trout fed a diet with a high
445
proportion of RO, Richard et al. (2006) suggested the high levels of oleic and linoleic
446
acids in the diet, as well as the presence of phytosterols, as possible causes for the
447
decreased plasma total cholesterol and LDL-cholesterol. Similarly, oleic acid and PUFA
448
had been found to reduce levels of plasma LDL-cholesterol in mammals (Fernandez and
449
West, 2005; Grundy and Denke, 1990).
450
A similar tendency was observed in total cholesterol, for which the lack of significant
451
differences among diets seemed to be a consequence of the high variability of the data.
452
In fact, Kim et al. (2012) reported that a decrease in the total cholesterol of fish fed a
453
diet containing VO has not been well established.
454
Values of the two hepatic transaminases (ALT and AST) presented similarities. It is
455
difficult to classify values of hepatic enzymes as normal or pathological, since they vary
456
largely among studies and species. Also, reference values for clinical-normal and
non-457
stressed animals are lacking for most fish species (Peres et al., 2012).
458
Nevertheless, an increase in the levels of plasma and serum transaminases has been
459
associated with liver damage in marine (Lemaire et al., 1991) and freshwater species
460
(Babalola et al., 2009), which was directly related to histopathological findings. In the
461
present study, the normal morphology of livers of fish fed the different diets might
462
indicate that differences in ALT and AST found among diets were possibly not relevant.
463
Díaz-López et al. (2009) observed a significant decrease in several hepatic enzymes in
464
sea bream after 4 months of feeding with rapeseed diets in relation to fish fed a control
465
diet FO as the main fat source. Then, the higher values obtained for F in comparison
466
with the rest of diets would be in accordance with results found in the aforementioned
467
study, although our trial had half the duration of the trial performed by Díaz-López et al.
468
(2009).
20 470
In contrast to the results obtained in the present study, lipid vacuoles accumulation in
471
the intestine and/or in the liver have been reported when VO are the main fat source in
472
fish diets (Caballero et al., 2002, 2004; Lie and Lambertsen, 1987;Olsen et al., 1999,
473
2000, Ruyter et al., 2006).
474
In the intestine, the enterocytic supranuclear lipid droplet accumulation observed in fish
475
fed VO (Olsen et al., 1999, 2000) has been considered a temporary physiological state,
476
due to the presence of a high amount of PUFA and an insufficient lipoprotein synthesis.
477
Certain SFA (mainly C16:0) are required to maintain the cellular synthesis of
478
phosphatidylcholine, necessary for the lipoprotein synthesis. Then, diets containing VO
479
poor in SFA and rich in 18:2n-6 and 18:3n-3, would promote the accumulation of lipid
480
droplets due to the insufficient formation of phospholipids and subsequently of
481
lipoproteins. Nonetheless, in sea bream fed a rapeseed oil diet, poor in SFA and rich in
482
MUFA (mainly C18:1n-9), accumulation of lipid droplets in enterocytes was suggested
483
to be caused by the lower enterocytic reacylation of the oleic acid observed in the polar
484
lipid fraction in comparison with other fatty acids. This fact would be reducing
485
lipoprotein synthesis rates (Caballero et al., 2003). In the present study, no lipid droplet
486
accumulation was observed, but it has to be considered that a different microscopy
487
technique than in Caballero et al. (2003) was used. In addition, the different times of
488
sampling (i.e. 4 h after feeding in Caballero et al., (2003) and after 48 h of fasting in our
489
case) should also be taken into account.
490
For liver, several studies in gilthead sea bream found a low or non-existent percentage
491
of lipid vacuoles in fish fed rapeseed oil diets compared to those fed diets with only FO
492
(Caballero et al., 2004; Fountoulaki et al., 2009). These studies suggested this low
493
degree of vacuolation could be due to the reduced activity of the fatty acid synthase
21
enzyme found in these livers in comparison of those of fish fed the F diet, which was
495
consequence of the high 18:1n-9 content in this diet. In relation to this, Caballero et al.
496
(2004) established an order among the characteristic fatty acids in VO and its
497
relationship with the appearance of steatosis in the liver: linoleic acid>linolenic
498
acid>oleic acid.
499
Considering that lipid vacuolation has been related to the nutritional imbalance due to
500
the high content of n-6 fatty acids present in many VO (Montero and Izquierdo, 2011;
501
Tacon, 1996), the fact that rapeseed contains limited n-6 PUFA could also be a possible
502
explanation for our results.
503 504
In conclusion, results from the present study indicate that rainbow trout fed diets
505
including RAO and REO showed acceptable fat and fatty acid digestibility, with no
506
relevant changes in plasma parameters or in the morphology of liver and intestine.
507
However, growth of fish fed these two diets did not reach that obtained in fish fed F,
508
while growth of fish fed diets including a blend of RAO and REO improved when
509
combined with REO at both 33% and 66% levels of inclusion. Therefore, the rapeseed
510
acid oil, which is the most economically advantageous, yields better growth results
511
when blended with the re-esterified oil. It has to be taken into account that the inclusion
512
of these oils should be done with a minimum proportion of 5% of FO in diets. However,
513
before recommending their use, further studies regarding the inclusion of these oils in
514
aqua feeds should be carried out in order to study their effect on the fat content and the
515
fatty acid composition of tissues, as well as on the final product quality parameters in
516 rainbow trout. 517 518 Acknowledgements 519
22
Authors would like to thank SILO S.p.a. (Firenze, Italy) for providing the experimental
520
fats and Marco Scolari, Morena Collura, Maddalena Marconi and Paolo Bardini from
521
Skretting Italia SPA (Mozzecane, Italy) for the technical assistance. This study was
522
supported by a FPI predoctoral research grant from Ministerio de Ciencia e Innovación
523
del Gobierno de España (BES-2011-046806), by a post-doctoral contract within the
524
Juan de la Cierva program (JCI-2012-13412) of the Spanish Ministry of Economy and
525
Competitiveness and by the project AGL2010-22008-C02 also funded by the Spanish
526
Ministry of Economy and Competitiveness.
527 528
References
529
Aliyu-Paiko, M., Hashim, R., 2012. Effects of substituting dietary fish oil with crude
530
palm oil and palm fatty acid distillate on growth, muscle fatty acid composition
531
and the activities of hepatic lipogenic enzymes in snakehead (Channa striatus,
532
Bloch 1793) fingerling. Aquacult. Res. 43, 767–776.
doi:10.1111/j.1365-533
2109.2011.02888.x
534 535
AOAC, 2005.Official Methods of Analysis of Association of Official Analytical
536
Chemist (AOAC) International. 18thedn., AOAC, Gaithersburg, MD, USA.
537 538
Austreng, E., Storebakken, T., 2000. Evaluation of selected trivalent metal oxides as
539
inert markers used to estimate apparent digestibility in salmonids. Aquaculture,
540
188, 65–78. doi: 10.1016/S0044-8486(00)00336-7
541 542
Babalola, T.O.O., Adebayo, M.A., Apata, D.F., Omotosho, J.S., 2009. Effect of dietary
543
alternative lipid sources on haematological parameters and serum constituents of
544
Heterobranchus longifilis fingerlings. Trop. Anim. Health. Prod. 41, 371–377. doi:
545
10.1007/s11250-008-9199-1
546 547
Behr, A., Pérez Gomes, J., 2010. The refinement of renewable resources: New
548
important derivatives of fatty acids and glycerol. Eur. J. Lipid Sci. Technol. 112,
549
31–50. doi: 10.1002/ejlt.200900091
550 551
Bell J.G., McEvoy, J., Tocher, D.T., McGhee, F., Campbell, P.J., Sargent, J.R., 2001.
552
Replacement of fish oil with rapeseed oil in diets of Atlantic salmon (Salmo salar)
553
affects tissue lipid compositions and hepatocyte fatty acid metabolism. J. Nutr.
554
131(5), 1535-1543.
555 556
Bell, J. G., McGhee, F., Campbell, P. J., Sargent, J. R., 2003. Rapeseed oil as an
557
alternative to marine fish oil in diets of post-smolt Atlantic salmon (Salmo salar):
558
changes in flesh fatty acid composition and effectiveness of subsequent fish oil
23
‘‘wash out’’. Aquaculture 218 (1–4), 515–528.
doi:10.1016/S0044-8486(02)00462-560
3
561 562
Bogevik, A. S., Tocher, D.R., Waagbø, R., Olsen, R.E., 2007. Triacylglycerol-, wax
563
ester- and sterol ester-hydrolases in midgut of Atlantic salmon (Salmo salar).
564
Aquac. Nutr. 14 (1), 93-98. doi:10.1111/j.1365-2095.2007.00510.x
565 566
Caballero, M.J, Obach, A., Rosenlund G., Montero D., Gisvold, M., Izquierdo M.S.,
567
2002. Impact of different dietary lipid sources on growth, lipid digestibility, tissue
568
fatty acid composition and histology of rainbow trout, Oncorhynchus mykiss.
569
Aquaculture 214, 253–271. doi: 10.1016/S0044-8486(01)00852-3
570 571
Caballero, M.J, Izquierdo M.S., Kjørsvik, E., Montero D., Socorro, J., Fernández, A.J.,
572
Rosenlund G., 2003. Morphological aspects of intestinal cells from gilthead
573
seabream (Sparus aurata) fed diets containing different lipid sources. Aquaculture
574
225, 325–340. doi:10.1016/S0044-8486(03)00299-0
575 576
Caballero, M.J., Izquierdo, M.S., Kjørsvik, E., Fernández, E., Rosenlund, G., 2004.
577
Histological alterations in the liver of sea bream, Sparus aurata L., caused by short-
578
or long-term feeding with vegetable oils. Recovery of normal morphology after
579
feeding fish oil as the sole lipid source. J. Fish Dis. 27, 531–541.
580
doi: 10.1111/j.1365-2761.2004.00572.x
581 582
Castell, J.D., Lee, D.J., Sinnhuber, R.R.O., 1972. Essential fatty acids in the diet of
583
rainbow trout (Salmo gairdneri): lipid metabolism and fatty acid composition. J.
584
Nutr. 102, 93-100.
585 586
Clarke, R., Frost, C., Collins, R., Appleby, P., Peto, R., 1997. Dietary lipids and blood
587
cholesterol: Quantitative meta-analysis of metabolic ward studies. BMJ 314, 112–
588
117.
589 590
Da Costa, T.H.M., 2003. Fats: Digestion, absorption, and transport. In: Caballero, B.
591
(ed.), Encyclopedia of Food Sciences and Nutrition, 2nd ed. Academic Press,
592
Oxford, UK. p. 2274–2278.
593 594
Denstadli, V., Bakke, A.M., Berge, G.M., Kroghdal, Å., Hillestad, M., Holm, H.,
595
Ruyter, B., 2011. Medium-chain and long-chain fatty acids have different
596
postabsorptive fates in Atlantic salmon. J. Nutr., 141 (9), 1618-1628.
597
doi:10.3945/jn.111.141820.
598 599
Díaz-López, M., Pérez, M.J., Acosta, N.G., Tocher, D.R., Jerez, S., Lorenzo, A.,
600
Rodríguez, C., 2009. Effect of dietary substitution of fish oil by echium oil on
601
growth, plasma parameters and body lipid compositionin gilthead sea bream
602
(Sparus aurata). Aquac. Nutr. 15, 500–512. doi: 10.1111/j.1365-2095.2008.00616.x
603 604
Dubois, V., Breton, S., Linder, M., Fanni, J., Parmentier, M., 2007. Fatty acid profiles
605
of 80 vegetable oils with regard to their nutritional potential. Eur. J. Lipid Sci.
606
Technol. 109, 710–732. doi: 10.1002/ejlt.200700040
607 608
24
Dumont, M.J., Narine, S.S., 2007. Soapstock and deodorizer distillates from North
609
American vegetable oils: Review on their characterization, extraction and
610
utilization. Food Res. Int. 40, 957–974.doi:10.1016/j.foodres.2007.06.006
611 612
Fernandez, M.L., West, K.L., 2005. Mechanisms by which dietary fatty acids modulate
613
plasma lipids. J. Nutr. 135, 2075–2078.
614 615
Flickinger, B.D., Matsuo, N., 2003. Nutritional characteristics of DAG oil. Lipids 38,
616
(2), 129–132. doi: 10.1007/s11745-003-1042-8
617 618
Fountoulaki, E., Vasilaki, A., Hurtado, R., Grigorakis, K., Karacostas, I., Nengas, I.,
619
Rigos, G., Kotzamanis, Y., Venou, B., Alexis, M.N., 2009. Fish oil substitution by
620
vegetable oils in commercial diets for gilthead sea bream (Sparus aurata L.); effects
621
on growth performance, flesh quality and fillet fatty acid profile files by a fish oil
622
finishing diet under fluctuating water temperatures. Aquaculture 289, 317–326. doi:
623
10.1016/j.aquaculture.2009.01.023
624 625
Francis, D. S., Turchini, G. M., Jones, P. L., De Silva, S. S., 2007. Effects of fish oil
626
substitution with a mix blend vegetable oil on nutrient digestibility in Murray cod
627
Maccullochella peelii peelii. Aquaculture 269 (1–4), 447–455.
628 629
Fregolente, P.B.L., Pinto, G.M.F., Wolf-Maciel, M.R., Maciel Filho, R., Benedito
630
Batistella, C., 2009. Produção de monoacilgliceróis e diacilgliceróis via glicerólise
631
enzimática e destilaçaõ molecular. Quim. Nova 32 (6), 1539-1543.
632 633
Fonseca-Madrigal, J., Karalazos, V., Campbell, P.J., Bell, G., Tocher, D.R., 2005.
634
Influence of dietary palm oil on growth, tissue fatty acid compositions, and fatty
635
acid metabolism in liver and intestine in rainbow trout (Oncorhynchus mykiss).
636
Aquacult. Nutr. 11, 241–250. doi:10.1111/j.1365-2095.2005.00346.x
637 638
Gjellesvik, D.R., Lombardo, D., Walther, B.T., 1992. Pancreatic bile salt pancreatic
639
lipase from cod (Gadu morhua): purification and properties. BBA 1124, 123-134.
640 641
Grundy, S.M., 1986. Comparison of monounsaturated fatty acids and carbohydrates for
642
lowering plasma cholesterol. N. Engl. J. Med. 314, 745–748.
643 644
Grundy, S.M., Denke, M.A., 1990. Dietary influences on serum lipids and lipoproteins.
645
J. Lipid Res. 31, 1149–1172.
646 647
Gunstone, F., 2011. Supplies of vegetable oils for non-food purposes. Eur. J. Lipid Sci.
648
Technol. 113, 3–7. doi: 10.1002/ejlt.201000104
649 650
Jordal, A. E-O., Lie, Ø., Torstensen, B.E., 2007. Complete replacement of dietary fish
651
oil with a vegetable oil blend affect liver lipid and plasma lipoprotein levels in
652
Atlantic salmon (Salmo salar L.). Aquacult. Nutr. 13, 114–130.
653
doi: 10.1111/j.1365-2095.2007.00455.x
654 655
Karalazos, V., Bendiksen, E.A., Dick, J.R., Bell, J.G., 2007. Effects of dietary protein,
656
and fat level and rapeseed oil on growth and tissue fatty acid composition and
657
metabolism in Atlantic salmon (Salmo salar L.) reared at low water temperatures.
25
Aquacult. Nutr. 13; 256–265. doi: 10.1111/j.1365-2095.2007.00471.x
659 660
Karupaiah, T., Sundram, K., 2007. Effects of stereospecific positioning of fatty acids in
661
triacylglycerol structures in native and randomized fats: a review of their nutritional
662
implications. Nutr. Metab. 4, 16-32. doi:10.1186/1743-7075-4-16
663 664
Krogdahl, A., 1985. Digestion and absorption of lipids in poultry. Journal of Nutrition
665
115, 675–685.
666 667
Haas, M.J., 2005. Improving the economics of biodiesel production through the use of
668
low value lipids as feedstocks: vegetable oil soapstock. Fuel Process. Technol. 86,
669
1087–1096. doi:10.1016/j.fuproc.2004.11.004
670 671
Hua, K., Bureau, D.P., 2009. A mathematical model to explain variations in estimates of
672
starch digestibility and predict digestible starch content of salmonid fish feeds.
673
Aquaculture 294, 282–287. doi: 10.1016/j.aquaculture.2009.06.021
674 675
Huang, S.S.Y., Fu, C.H.L., Higgs, D.A., Balfry, S.K., Schulte P.M., Brauner C.J., 2008.
676
Effects of dietary canola oil level on growth performance, fatty acid composition
677
and ionoregulatory development of spring chinook salmon parr, Oncorhynchus
678
tshawytscha. Aquaculture 274, 109–117.doi: 10.1016/j.aquaculture.2007.11.011
679 680
Kim, D-K., Kim, K-D., Seo, J-Y., Lee, S-M., 2012. Effects of dietary lipid source and
681
level of growth performance, blood parameters and flesh quality of sub-adult olive
682
flounder (Paralichthys olivaceus). Asian-Aust. J. Anim. Sci. 25 (6) 869-879.doi:
683
10.5713/ajas.2011.11470.
684 685
Lemaire, P., Drai, P., Mathieu, A., Lemaire, S., Carrière, S., Giudicelli, J., Lafaurie, M.,
686
1991. Aquaculture 93, 63-75.
687 688
Lie, O., Lambertsen, G., 1987. Lipid digestion in cod (Gadus morhua). Comp. Biochem.
689
Physiol. 88B, 697-700.
690 691
Martin, D., Morán-Valero, M.I., Vázquez, L., Reglero, G., Torres, C.F., 2014.
692
Comparative in vitro intestinal digestion of 1,3-diglyceride and 1-monoglyceride
693
rich oils and their mixtures. Food Res. Int. 64, 603-609.doi:
694
10.1016/j.foodres.2014.07.026
695 696
Martins, D.A., Gomes, E., Rema, P., Dias, J., Ozόrio, R.O.A., Valente, L.M.P., 2006.
697
Growth, digestibility and nutrient utilization of rainbow trout (Oncorhynchus
698
mykiss) and European sea bass (Dicentrarchus labrax) juveniles fed different
699
dietary soybean oil levels. Aquaculture International 14(3), 285-295. doi:
700
10.1007/s10499-005-9034-x
701 702
Martoja, R., Martoja-Pierson, M., 1970. Técnicas de Histología Animal. Toray-Masson,
703
Barcelona, 350 pp.
704 705
Mattson, F.H., Nolen, G.A., Webb, M.R., 1979. The absorbability by rats of various
706
triglycerides of stearic and oleic acid and the effect of dietary calcium and
707
magnesium. J. Nutr. 109 (10), 1682-1687.
26 709
Maynard, L. A., Loosli, J.K., Hintz, H.F., Warner, R.G., 1979. Animal Nutrition,
710
seventh ed. McGraw-Hill Book Company, New York.
711 712
Meier, S., Mjøs, S., Joensen, H., Grahl-Nielsen, O., 2006. Validation of a one-step
713
extraction/methylation method for determination of fatty acids and cholesterol in
714
marine tissues. J. Chromatogr. A 1104, 291–298. doi:
715
10.1016/j.chroma.2005.11.045
716 717
Menoyo, D., Lopez-Bote, C.J., Bautista, J.M., Obach, A., 2003. Growth, digestibility
718
and fatty acid utilization in large Atlantic salmon (Salmo salar) fed varying levels
719
of n−3 and saturated fatty acids. Aquaculture 225, 295–307.doi:
10.1016/S0044-720
8486(03)00297-7
721 722
Montero, D. Izquierdo, M.S., 2011. Welfare and health of fish fed vegetable oils as
723
alternative lipid sources to fish oil. In: G. M. Turchini, W. K. Ng, and D. R. Tocher
724
(Eds.), Fish oil replacement and alternative lipid sources in aquaculture feeds (pp.
725
439-485). Boca Raton, FL, USA: CRC Press; Taylor & Francis group.
726 727
National Research Council. Nutrient Requirements of Fish and Shrimp. Washington,
728
DC: The National Academies Press, 2011.
729 730
Ng, W-K., Codabaccus, B.M., Carter, C.G., Nichols, P.D., 2010. Replacing dietary fish
731
oil with palm fatty acid distillate improves fatty acid digestibility in rainbow trout,
732
Oncorhynchus mykiss, maintained at optimal or elevated water temperature.
733
Aquaculture 309, 165–172. doi:10.1016/j.aquaculture.2010.08.035
734 735
Nuchi, C., Guardiola, F., Bou, R., Bondioli, P., Della Bella, L., Codony, R., 2009.
736
Assessment of the levels of degradation in fat co- and byproducts for feed uses and
737
their relationships with some lipid composition parameters. J. Agric. Food Chem.
738
57, 1952-1959. doi: 10.1021/jf803369h
739 740
Olsen, R.E., Myklebust, R., Kaino, T., Ringø, E., 1999. Lipid digestibility and
741
ultrastructural changes in the enterocytes of Arctic charr (Salvelinus alpinus L.) fed
742
linseed oil and soybean lecithin. Fish Physiol. Biochem. 21, 35-44. doi:
743
10.1023/A:1007726615889
744 745
Olsen, R.E., Myklebust, R., Ringø, E., Mayhew, T.M., 2000. The influences of dietary
746
linseed oil and saturated fatty acids on caecal enterocytes in Arctic charr
747
(Salvelinus alpinus L.): a quantitative ultrastructural study. Fish Physiol. Biochem.
748
22, 207-216. doi:10.1023/A:1007879127182
749 750
Peres, H., Gonçalves, P., Oliva-Teles, A., 1999. Glucose tolerance in gilthead seabream
751
(Sparus aurata) and European seabass (Dicentrarchus labrax). Aquaculture 179,
752
415–423.
753 754
Peres, H., Santos, S., Oliva-Teles, A., 2012. Selected plasma biochemistry parameters in
755
gilthead seabream (Sparus aurata) juveniles. J. Appl. Ichthyol., 1-7. doi:
756
10.1111/j.1439-0426.2012.02049.x
757 758
27
Pettersson, A., Johnsson, L., Brännäs, E., Pickova, J., 2009. Effects of rapeseed oil
759
replacement in fish feed on lipid composition and self-selection by rainbow trout
760
(Oncorhynchus mykiss). Aquacult. Nutr. 15, 577-586. doi:
10.1111/j.1365-761
2095.2008.00625.x
762 763
Richard, N., Kaushik, S., Larroquet, L., Panserat, S., Corraze, G., 2006. Replacing
764
dietary fish oil by vegetable oils has little effect on lipogenesis, lipid transport and
765
tissue lipid uptake in rainbow trout (Oncorhynchus mykiss). Br. J. Nutr. 96, 299–
766
309. doi: 10.1079/BJN20061821
767 768
Ruyter, B., Moya-Falcón, Rosenlund, G., Vegusdal, A., 2006. Fat content and
769
morphology of liver and intestine of Atlantic salmon (Salmo salar): Effects of
770
temperature and dietary soybean oil. Aquaculture 252, 441-452. doi:
771
10.1016/j.aquaculture.2005.07.014
772 773
Sun, S., Ye, J., Chen, J., Wang, Y., Chen, L., 2011. Effect of dietary fish oil
774
replacement by rapeseed oil on the growth, fatty acid composition, and serum
non-775
specific immunity response of fingerling black carp, Mylopharyngodon piceus.
776
Aquacult. Nutr. 17, 441-450. doi: 10.1111/j.1365-2095.2010.00822.x
777 778
Tacon, A., G., J., 1996. Lipid nutritional pathology in farmed fish. Arch. Anim. Nutr.
779
49, 33-39. doi:10.1080/17450399609381861
780 781
Tocher, D.R., Bell, J.G., McGhee, F., Dick, J.R., Fonseca-Madrigal, J., 2003a. Effects
782
of dietary lipid level and vegetable oil on fatty acid metabolism in Atlantic salmon
783
(Salmo salar L.) over the whole production cycle. Fish Physiol. Biochem. 29,
193-784
209.doi: 10.1023/B:FISH.0000045722.44186.ee
785 786
Tocher, D.R., 2003b. Metabolism and functions of lipids and fatty acids in teleost fish.
787
Fish. Rev. Fish. Sci. 11, 107–184. doi:10.1080/713610925
788 789
Trullàs, C., Fontanillas, R., Tres, A., Sala, R., 2015. Vegetable re-esterified oils in diets
790
for rainbow trout: effects on fatty acid digestibility. Aquaculture 444, 28-35. doi:
791
10.1017/10.1016/j.aquaculture.2015.03.018
792 793
Turchini, G.M., Torstensen, B.E., Ng, W.K., 2009. Fish oil replacement in finfish
794
nutrition. Rev. Aquacult. 1, 10-57. doi: 10.1111/j.1753-5131.2008.01001.x
795 796
Turchini, G.M., Moretti, V.M., Hermon, K., Caprino, F., Busetto, M.L., Bellagamba, F.,
797
Rankin, T., Keast, R.S.J., Francis, D.S., 2013. Monola oil versus canola oil as a
798
fish oil replacer in rainbow trout feeds: effects on growth, fatty acid metabolism
799
and final eating quality. Food Chem. 141, 1335-1344. doi:
800
10.1016/j.foodchem.2013.03.069
801 802
Vilarrasa, E., Tres, A., Bayés-García, L., Parella, T., Esteve-Garcia, E., Barroeta, A.C.,
803
2014. Re-esterified palm oils, compared to native palm oil, do not alter fat
804
absorption, postprandial lipemia or growth performance in broiler chicks. Lipids
805
49, 795-805. doi: 10.1007/s11745-014-3920-9
806 807
28
Vilarrasa, E., Codony, R., Esteve-Garcia, E., Barroeta, A.C., 2015. Use of re-esterified
808
oils, differing in their degree of saturation and molecular structure, in broiler
809
chicken diets. Poult. Sci. 94 (7), 1527-1538. doi: 10.3382/ps/pev073
810 811
Watanabe, T., 1982. Lipid nutrition in fish. Comp. Biochem. Physiol. 73B (1), 3-15.
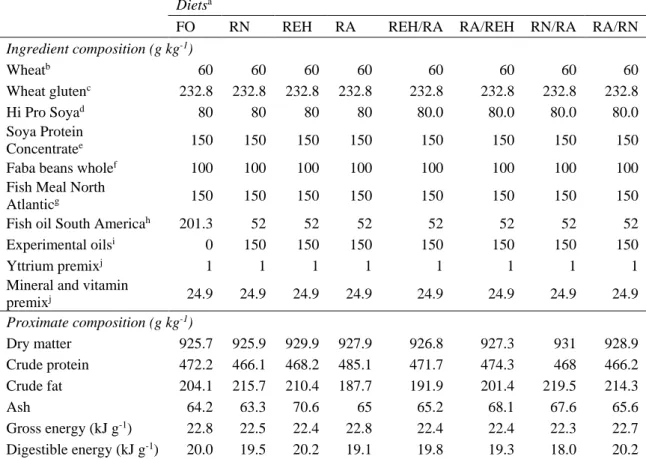
Table 1. Ingredient formulation and proximate composition of the experimental diets. Dietsa
FO RN REH RA REH/RA RA/REH RN/RA RA/RN
Ingredient composition (g kg-1) Wheatb 60 60 60 60 60 60 60 60 Wheat glutenc 232.8 232.8 232.8 232.8 232.8 232.8 232.8 232.8 Hi Pro Soyad 80 80 80 80 80.0 80.0 80.0 80.0 Soya Protein Concentratee 150 150 150 150 150 150 150 150
Faba beans wholef 100 100 100 100 100 100 100 100
Fish Meal North
Atlanticg 150 150 150 150 150 150 150 150
Fish oil South Americah 201.3 52 52 52 52 52 52 52
Experimental oilsi 0 150 150 150 150 150 150 150
Yttrium premixj 1 1 1 1 1 1 1 1
Mineral and vitamin
premixj 24.9 24.9 24.9 24.9 24.9 24.9 24.9 24.9 Proximate composition (g kg-1) Dry matter 925.7 925.9 929.9 927.9 926.8 927.3 931 928.9 Crude protein 472.2 466.1 468.2 485.1 471.7 474.3 468 466.2 Crude fat 204.1 215.7 210.4 187.7 191.9 201.4 219.5 214.3 Ash 64.2 63.3 70.6 65 65.2 68.1 67.6 65.6 Gross energy (kJ g-1) 22.8 22.5 22.4 22.8 22.4 22.4 22.3 22.7 Digestible energy (kJ g-1) 20.0 19.5 20.2 19.1 19.8 19.3 18.0 20.2
aExperimental diets nomenclature: FO: fish oil (control diet); RN: rapeseed native oil; REH: rapeseed
re-esterified oil high in MAG; RA: rapeseed acid oil; REH/RA: 66% rapeseed re-re-esterified oil high in MAG - 33% rapeseed acid oil; RA/REH: 66% rapeseed acid oil - 33% rapeseed re-esterified oil high in MAG; RN/RA: 66% rapeseed native oil - 33% rapeseed acid oil and RA/RN: 66% rapeseed acid oil - 33% rapeseed native oil.
bStatkorn, Norway.
cCerestar Scandinavia AS, Denmark. dIMCOPA, Brasil.
eDenofa, Norway. fCeremis, France. gWelcon AS, Norway. hHoltermann ANS, Norway. iExperimental oils.
jVitamin and mineral premix, according to requirement data from NRC (2011). Trow Nutrition, The
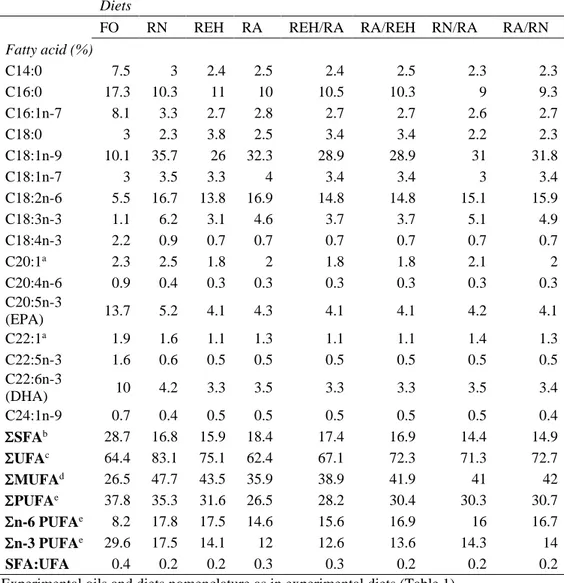
Table 2. Fatty acid composition of the experimental diets. Diets
FO RN REH RA REH/RA RA/REH RN/RA RA/RN
Fatty acid (%) C14:0 7.5 3 2.4 2.5 2.4 2.5 2.3 2.3 C16:0 17.3 10.3 11 10 10.5 10.3 9 9.3 C16:1n-7 8.1 3.3 2.7 2.8 2.7 2.7 2.6 2.7 C18:0 3 2.3 3.8 2.5 3.4 3.4 2.2 2.3 C18:1n-9 10.1 35.7 26 32.3 28.9 28.9 31 31.8 C18:1n-7 3 3.5 3.3 4 3.4 3.4 3 3.4 C18:2n-6 5.5 16.7 13.8 16.9 14.8 14.8 15.1 15.9 C18:3n-3 1.1 6.2 3.1 4.6 3.7 3.7 5.1 4.9 C18:4n-3 2.2 0.9 0.7 0.7 0.7 0.7 0.7 0.7 C20:1a 2.3 2.5 1.8 2 1.8 1.8 2.1 2 C20:4n-6 0.9 0.4 0.3 0.3 0.3 0.3 0.3 0.3 C20:5n-3 (EPA) 13.7 5.2 4.1 4.3 4.1 4.1 4.2 4.1 C22:1a 1.9 1.6 1.1 1.3 1.1 1.1 1.4 1.3 C22:5n-3 1.6 0.6 0.5 0.5 0.5 0.5 0.5 0.5 C22:6n-3 (DHA) 10 4.2 3.3 3.5 3.3 3.3 3.5 3.4 C24:1n-9 0.7 0.4 0.5 0.5 0.5 0.5 0.5 0.4 ΣSFAb 28.7 16.8 15.9 18.4 17.4 16.9 14.4 14.9 ΣUFAc 64.4 83.1 75.1 62.4 67.1 72.3 71.3 72.7 ΣMUFAd 26.5 47.7 43.5 35.9 38.9 41.9 41 42 ΣPUFAe 37.8 35.3 31.6 26.5 28.2 30.4 30.3 30.7 Σn-6 PUFAe 8.2 17.8 17.5 14.6 15.6 16.9 16 16.7 Σn-3 PUFAe 29.6 17.5 14.1 12 12.6 13.6 14.3 14 SFA:UFA 0.4 0.2 0.2 0.3 0.3 0.2 0.2 0.2
Experimental oils and diets nomenclature as in experimental diets (Table 1).
aSum of isomers.
bSFA: saturated fatty acids. It includes other SFA of small quantity. cUFA: unsaturated fatty acids. It includes other UFA of small quantity.
dMUFA: monounsaturated fatty acids. It includes other MUFA of small quantity.
ePUFA: polyunsaturated fatty acids. It includes other PUFA of small quantity; n-6 PUFA: omega 6