1
POLYTECHNIC UNIVERSITY OF MARCHE
Faculty of Medicine and Surgery
Department of Clinical and Molecular Sciences
PhD Course in Human Health
Effects of allyl isothiocyanate, ellagic acid, or thymol on breast
cancer cells alone and in combination with doxorubicin
Tutor:
PhD Fellow:
Prof. Lory Santarelli
Md. Abu Sayeed
Supervisor:
Dr. Massimo Bracci
2
INDEX
1. Introduction
5-17 1.1. Study background 5-6 1.2. Breast cancer 6-8 1.3. Natural products 8-9 1.4. Allyl isothiocyanate 9-11 1.4.1. Chemistry 9 1.4.2. Sources 101.4.3. Absorption, biodistribution, metabolism, and excretion 10
1.4.4. Pharmacological activities 11
1.5. Ellagic acid 11-13
1.5.1. Chemistry 11
1.5.2. Sources 12
1.5.3. Absorption, biodistribution, metabolism, and excretion 12-13
1.5.4. Pharmacological activities 13
1.6. Thymol 13-15
1.6.1. Chemistry 13
1.6.2. Sources 14
1.6.3. Absorption, biodistribution, metabolism, and excretion 14 1.6.4. Pharmacological activities 14-15
1.7. Doxorubicin 15-17
2. Objectives of the study
183. Materials and methods
19-233.1. Chemicals and reagents 19
3.2. Cell line and culture conditions 19-20
3.3. Cell viability analysis 20
3.4. Apoptosis analysis 20
3 3.6. RNA extraction and quantitative real-time PCR 21
3.7. Western blotting 22
3.8. Statistical analysis 22-23
4. Results
24-414.1. Effect of DOX on MDA-MB-231 cell growth 24-25 4.2. Effect of AITC alone and in combination with DOX on cell growth 25-35
4.2.1. AITC did not inhibit MDA-MB-231 cell proliferation while affected MCF-7 and MCF-10A cells
25-27
4.2.2. AITC did not synergistically sensitize MDA-MB-231 cells to DOX
27-31
4.2.3. AITC did not induce apoptosis and cell cycle arrest 31-33 4.2.4. AITC upregulated BCL-2 and MTOR expression, while
induced no changes in PRKAA1 and PER2 expression
33-34
4.2.5. AITC did not affect Caspase-8, Caspase-9, PARP, p-mTOR, and NF-κB p65 proteins level, while downregulated Beclin-1 protein level
34-35
4.3. Effect of EA alone and in combination with DOX on cell growth 35-39 4.3.1. EA inhibited MDA-MB-231 cell proliferation while affected
MCF-10A cells
35-36
4.3.2. EA synergistically sensitized MDA-MB-231 cells to DOX 36-39 4.4. Effect of thymol alone and in combination with DOX on cell growth 40-43
4.4.1. Thymol did not inhibit MDA-MB-231 cell proliferation while affected MCF-10A cells
40
4.4.2. Thymol did not synergistically sensitize MDA-MB-231 cells to DOX
41-43
5. Discussion
44-476. Conclusions
484
6.2. EA 48
6.3. Thymol 48
7. Acknowledgments
495
1. Introduction
1.1. Study background
Breast cancer is the most common cancer among women and the second leading cause of cancer-associated deaths in humans worldwide. According to GLOBOCAN 2012, 522,000 women died of breast cancer in both developed and developing countries in 2012 [1]. In 2017, approximately 252,700 new breast cancer cases and about 40,600 deaths are estimated to occur in women in the United States [2]. Traditional therapies such as surgery, chemotherapy, and radiotherapy are associated with adverse side effects, and drug resistance, recurrence, and lack of treatment for metastatic disease are the major problems. Hence, there is an urgent need to develop new treatment options to combat breast cancer, either through the development of novel agents, or through new therapies enabling previously effective drugs to function with high efficacy again.
Proliferation inhibition and apoptosis are considered important for therapeutics targeting cancer cells. Normal breast growth is controlled by a balance between cell proliferation and apoptosis, and breast tumor grow not just as a result of uncontrolled proliferation but also due to reduced apoptosis [3].
Numerous molecules have been reported to play important roles in regulating apoptosis [4]. Caspase-8 and Caspase-9 are well known regulators of apoptosis. Activated Caspase-8 can activate Caspase-1, Caspase-3, Caspase-6, Caspase-7, and Bid [5, 6]. Similarly, activated Caspase-9 can activate Caspase-3, Caspase-7. PARP [Poly (ADP-ribose) polymerase] is known to be involved in apoptosis [7] as well as in DNA repair system [8], and is one the main targets of Caspase-3 [9]. Beclin-1 is important regulators of autophagy [10] and NF-κB (nuclear factor
6 kappa-light-chain-enhancer of activated B cells) p65 is a member of NF-κB family which is important regulators of inflammation [11], apoptosis [12]. Whereas, p-mTOR (phospho-mammalian target of rapamycin) is a phosphorylated form of mTOR, which is involved in various cellular events including proliferation, autophagy. It is well known that Bcl-2 (B-cell lymphoma 2), mTOR, and PER2 regulate apoptosis, proliferation and autophagy, and circadian rhythms [13], respectively. PRKAA1 (5'-AMP-activated protein kinase catalytic subunit alpha-1) is the catalytic subunit of AMPK (5' adenosine monophosphate-activated protein kinase), which is involved in regulating metabolic enzymes and as well inhibits mTOR through phosphorylation [14, 15].
In order to find safe and effective drugs, research has focused on natural products because of their safe nature. Allyl isothiocyanate (AITC), ellagic acid (EA), and thymol are plant-derived compounds, and are reported to possess various biological activities. However, their potential effects on breast cancer remain unclear. This study was aimed to further investigate the effects of these compounds and to determine whether combination treatment with doxorubicin produced synergistic growth inhibition. It was also analyzed the level of Caspase-8, Caspase-9, PARP, Beclin-1, and p-mTOR proteins and the expression of BCL-2, MTOR, PRKAA1, and PER2 genes in MDA-MB-231 cells after treatment with AITC.
1.2. Breast cancer
Brest cancer is major public health problem and most common cancer among women all around the world. One out of ten new cancer diagnosed cases, is female breast cancer. Among both gender, breast cancer is the second type after lung cancer [16]. Genetic risk factors, including
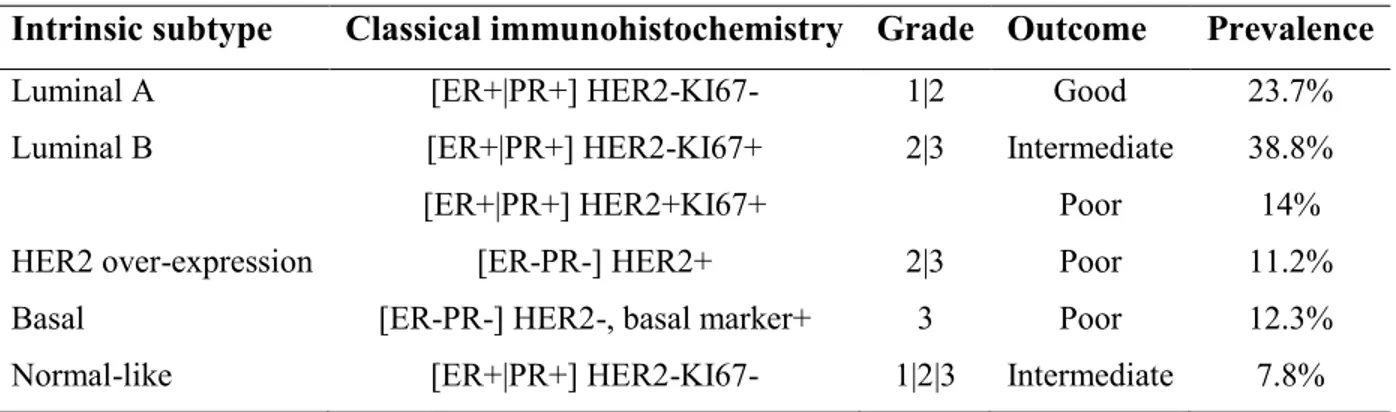
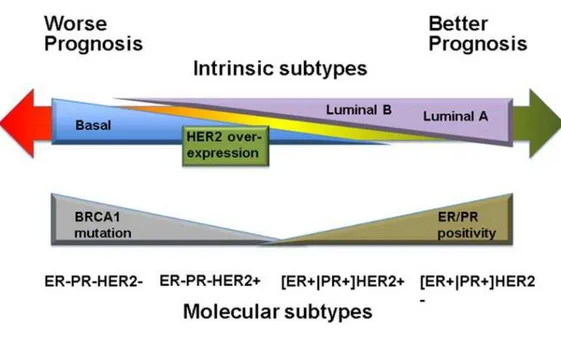
7 mutations on breast cancer susceptibility gene 1 (BRCA1) and BRCA2, are responsible for about 5-10% of all breast cancer incidences [17, 18]. There are several acquired risk factors for breast cancer which include early onset of menstruation, not having children, delayed birth of a first child, short duration of breast feeding, late menopause, use of hormone replacement therapy, aging, obesity, diabetes, alcohol consumption, and circadian disruption [19-26]. Breast cancer metastases into lung and bone and its poor response to conventional chemotherapy is one of the current major challenges [27]. Microarray gene expression analysis has discovered five intrinsic subtypes of breast cancers, human epidermal growth receptor 2 (HER2)-positive, hormone receptor (HR)-positive luminal A and B, basal and normal-like breast cancer (Table 1, Figure 1). These five subtypes are characterized by distinct phenotypes, molecular profiles, clinical behavior and response to therapy [28, 29].
Table 1. Summary of the breast cancer molecular subtypes.
Intrinsic subtype Classical immunohistochemistry Grade Outcome Prevalence
Luminal A [ER+|PR+] HER2-KI67- 1|2 Good 23.7%
Luminal B [ER+|PR+] HER2-KI67+ 2|3 Intermediate 38.8%
[ER+|PR+] HER2+KI67+ Poor 14%
HER2 over-expression [ER-PR-] HER2+ 2|3 Poor 11.2%
Basal [ER-PR-] HER2-, basal marker+ 3 Poor 12.3%
Normal-like [ER+|PR+] HER2-KI67- 1|2|3 Intermediate 7.8% ER= Estrogen receptor, PR= Progesterone receptor
8
Figure 1. Patient outcome based on breast tumor intrinsic subtypes.
1.3. Natural products
Natural products are natural functional elements with biological activities derived from plentiful natural sources such as plants. There are over 250,000 plant species and every year 4000 new natural products are discovered. In fact, many of chemotherapeutic drugs that are used nowadays, are derived from natural products isolated from natural origin, such as alkaloids, taxanes, and flavonoids [30]. There is an unending list of natural products being investigated for their remarkable beneficial effects in different therapeutic areas. In cancer therapy, natural product in general, doubtlessly provided not only selective benefits against cancer cells compared to normal cells, but also provided lead chemical structures, acting as a template for designing and development of new novel drugs. These templates are used in order to have similar or more benefits than natural products, followed by less possible side effects and resistance [31]. Most reported anticancer effects of natural products are including apoptosis and cell cycle arrest, pointing at the most important proteins being targeted by these natural products,
9 therefore hindering the cancer cell progression [32]. Considering natural products success in cancer therapy, their discovery and extractions was a revolution in cancer therapeutic regimes [33]. Natural products are better choice of chemotherapeutic agents due to their selectivity towards cancer cells, low toxicity and cost [34]. As well as their structure, that received great attention as lead template for design and development of synthetic compounds known as “natural products mimics”. These natural product mimics are expected to join their primary division with even better properties [35].
1.4. Allyl isothiocyanate
1.4.1. Chemistry
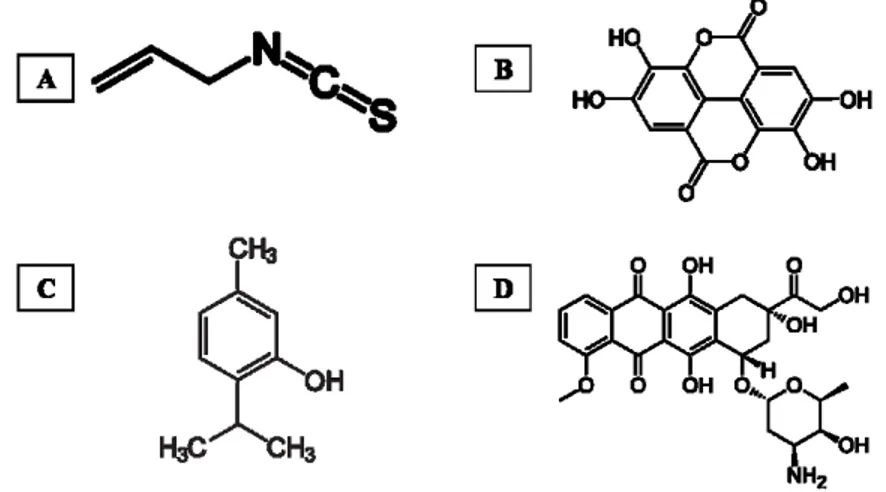
AITC (3-isothiocyanato-1-propene) is a volatile and sulphur containing organic compound (Figure 2A) and is an enzymatic hydrolysis product of the glucosinolate sinigrin, molecular formula CH2CHCH2NCS, molecular weight 99.15 g/mol, boiling point 151 °C. It is a colorless to pale yellow liquid that is slightly soluble in water, but well soluble in most organic solvents.
10
1.4.2. Sources
AITC is present as sinigrin in various cruciferous vegetables, such as Brussels sprouts (8.9 μmol/g dry wt), cauliflower (9.3 μmol/g dry wt), cabbage (7.8 μmol/g dry wt), horseradish (0.91-144 μmol/g dry wt), kale (10.4 μmol/g dry wt), and wasabi (0.015- 0.0162 μmol/g fresh wt) [36-38].
1.4.3. Absorption, biodistribution, metabolism, and excretion
More than 90% of a single oral dose of [14C]AITC (25 or 250 μmol/kg body weight) was absorbed in mice and rats, and in both instances nearly 80% of the administered doses was recovered in the urine [39, 40]. These results indicate extremely high bioavailability of AITC and that absorbed AITC is primarily eliminated in the urine. Another study showed that urinary elimination of AITC was very rapid, as approximately 75 and 0.6% of a single oral dose of AITC were detected in the urine collected in the first and second 24-h periods after dosing [41]. AITC is primarily metabolized through the mercapturic acid pathway in vivo. An initial conjugation through its –N=C=S group with glutathione gives rise to the corresponding conjugate, which then undergoes further enzymatic modifications to finally form n-acetylcysteine (NAC) conjugate, which is excreted in the urine. In rats dosed orally with [14C]AITC, approximately 80% of the 14C in the urine was present as the NAC conjugate, with the majority of the remaining radioactivity detected as thiocyanate [39, 40]. The NAC conjugate was also the major metabolite in humans, as 42-54% of the dose was recovered in the urine as NAC-AITC within 10-12 h in each volunteer who consumed AITC [42, 43].
11
1.4.4. Pharmacological activities
Many studies have shown that AITC has various beneficial effects, including anti-inflammatory, neuroprotective, hepatoprotective, gastroprotective, anti-lipogenic/adipogenic, and antimicrobial effects [44-50]. Moreover, studies have shown that AITC displays anticancer activity. AITC inhibited proliferation through induction of apoptosis and cell cycle arrest in breast [51, 52] and bladder [53, 54] cancer cells as well as in brain malignant glioma [55], suppressed epidermal growth factor-stimulated invasion and migration in colorectal adenocarcinoma cells [56], inhibited proliferation via induction of apoptosis and cell cycle arrest in prostate cancer cells in vitro [57] and in vivo [58], and induced apoptosis in leukaemia cells [59]. In addition to these studies, AITC has been reported to sensitize ovarian and lung cancer cells to chemotherapeutic drug cisplatin [60], and to exert synergistic therapeutic effects on lung cancer cells in combination with radiation [61].
1.5. Ellagic acid
1.5.1. Chemistry
EA (2,3,7,8-tetrahydroxy[1]-benzopyranol[5,4,3-cde]benzopyran-5,10-dione) is a phenolic acid (Figure 2B), molecular formula C14H6O8. It is a highly thermostable molecule (melting point of 350 °C), with a molecular weight of 302.197 g/mol, slightly soluble in water, alcohol, and ether, but soluble in caustic potash. Structurally, presents four rings representing the lipophilic domain, four phenolic groups and two lactones, which form hydrogen-bonds sides and act as electron acceptors respectively, and that represent the hydrophilic domain [62].
12
1.5.2. Sources
EA is found in some fruits such as blackberry (150.0 mg/100 g), cloudberry (315.1 mg/100 g), cranberry (12.0 mg/100 g), strawberry (77.6-79.9 mg/100 g), raspberry (119.8-323.5 mg/100 g), wolfberry (0.012-10.156 mg/100 g), grape seed (0.892-7.72 mg/100 g), grape pulp (0.002-0.008 mg/100 g), grape skin (0.064-0.385 mg/100 g), pecan (33.0 mg/100 g), and walnut (59.0 mg/100 g) [63].
1.5.3. Absorption, biodistribution, metabolism, and excretion
EA bioavailability is low in human [64] and animal models [65-67] due to their hydrophobic nature. Hydrolysis of ellagitannins release EA under physiological conditions, which is moderately absorbed and metabolized by gut microbiota to urolithins (dibenzopyran-6-one metabolites) through remotion of one of the two lactone groups and subsequent decarboxylation, and dehydroxylation reactions [68]. Urolithin D, urolithin C, urolithin A, and urolithin B are sequentially produced and absorbed in the intestine, as their lipophilicity increased [68]. The amount of ellagitannins and EA in the systemic circulation and peripheral tissues is almost negligible, whereas urolithins and their conjugates can reach concentrations at the micromolar level [69]. Furthermore, EA and its metabolites are subjected to phase II reactions including glucuronidation, sulfation and methylation that occurs in the wall of the large intestine and/or post-absorption in the liver [70-72]. It has been described the presence of urolithin A, urolithin B and dimethyl-EA-glucuronide in peripheral plasma, as well as glucuronides and methyl glucuronides of EA, urolithin A, C, and D in bile (enterohepatic circulation) [73]. Regarding tissue distribution of urolithins and their conjugates, urolithin A accumulates in prostate, intestinal, and colon tissues, whereas urolithin A glucuronide was primarily detected in liver and
13 kidney tissues from mice [74]. EA-derived metabolites, mainly urolithin A and B are excreted through the urine; EA and EA-O-glucuronide urinary excretion in humans is <1% of intake [75], whereas urolithin A is the main metabolite detected in feces in both pigs and humans [65, 72].
1.5.4. Pharmacological activities
EA has been reported to have antimutagenic, antigenotoxic, anti-apoptotic, anticarcinogenic, antibacterial, antiviral, antimalarial, antiallergic, anti-inflammatory, antiatherogenic; antidiabetic, antiepileptic, antidepressant, antianxiety, neuroprotective, pneumoprotective, nephroprotective, cardioprotective, and hepatoprotective activities [62]. It causes cell cycle arrest and to induce apoptosis in many human cancer cell lines such as bladder T24 [76], cervical carcinoma [77], leukaemia [78], breast, and prostate [79] cells.
1.6. Thymol
1.6.1. Chemistry
Thymol (2-isopropyl-5-methylphenol), a monoterpene phenol (Figure 2C), is a white crystalline substance that gives thyme its strong flavor, pleasant aromatic odor and strong antiseptic property. Its molecular formula is C10H14O and its density at 25 °C is 0.96 g/cm3 with a melting point ranging from 49 °C to 51 °C (322-324 K; 120-124 °F). It is highly soluble in alcohols, alkaline solutions and other organic solvents due to the deprotonation of phenol but it is slightly soluble in water at neutral pH and it absorbs maximum UV radiation at 274 nm [80]. It has low solubility in water and its unpleasant taste and smell makes it less palatable [81]. It also has low solubility in the hydrophobic domain of the bacterial cytoplasmic membrane due to its hydrophobicity [80].
14
1.6.2. Sources
Thymol is abundantly found in certain plants such as Thymus vulgaris (thyme) (16.4-42.6%), Ocimum gratissimum (clove basil) (35.40-46.60%), Thymus ciliates (79.1%), Satureja thymbra (33.8%), Trachyspermum ammi (ajwain) (35-60%), Carum copticum (49.0%), Satureja intermedia (34.5%), Thymbra capitata (14-42%), Thymus pectinatus (49.8%), Lippia sidoides (84.9%), and Nigella sativa (9.12×10⁻³%) (black cumin) seeds [82-92].
1.6.3. Absorption, biodistribution, metabolism, and excretion
Several studies have revealed that thymol is rapidly absorbed or degraded within the stomach and small intestine [80, 93]. In a study by Nieddu et al. [81], a single dose of thymol (0.5 g/kg) has been shown to be rapidly absorbed after oral administration and slowly eliminated within 24 h. Thymol is circulated as thymol sulfate. Thymol sulfate has been detected in plasma 20 min after administration. The maximum plasma levels (93.1 ± 24.5 ng/ml) of thymol were reported after 1.97 ± 0.77 h of administration. After administration the bioavailability of thymol measured in plasma as thymol sulfate was found to be about 16%. It is eliminated by kidneys and is measured in the urine as thymol conjugates. The volume of distribution (Vdss/f) of 14.7 L has revealed that thymol sulfate mainly resides in the extracellular space [94]. In healthy human volunteers, thymol was metabolized to thymol sulfate, thymol glucronide, and thymol thymohydroquinone sulfate and it was excreted in urine [95].
1.6.4. Pharmacological activities
Thymol is reported to have antibacterial, antifungal, inflammatory, antioxidant, anti-mutagenic, larvicidal, analgesic, anti-microbial, acaricidal, anticonvulsant, antiepileptogenic,
15 wound healing, anti-hemolytic, antiphlogistic, antileishmanial, and radioprotective properties [80]. In addition, studies have shown that thymol displays anticancer activity. Thymol inhibited cell proliferation in bladder [96], breast, leukemia, prostate [97], gastric [98], hepatocarcinoma [99], and lung [100] cancer, osteosarcoma [101], glioma [102] cells.
1.7. Doxorubicin
Doxorubicin (DOX) (Figure 2D) belongs to a group of anthracycline antibiotics, which are one of the most effective types of anticancer drugs currently used in the treatment of both solid and liquid tumours, including breast cancer [103, 104]. Doxorubicin acts by binding to DNA associated enzymes, it can intercalate the base pairs of the DNA’s double helix [105]. By binding to multiple molecular targets such as topoisomerase enzymes I and II, a range of cytotoxic effects occur in conjunction with antiproliferation, thus resulting in DNA damage [106]. The apoptosis pathway is triggered when the attempt to repair the breaks in DNA fail and cellular growth is inhibited at phases G1 and G2. DOX is also known to intercalate itself into the DNA, with the inhibition of both DNA and RNA polymerase, ultimately ceasing DNA replication and RNA transcription [107].
This process occurs as DOX enters the cell through diffusion using its higher affinity to bind to the cytoplasm’s proteasome. A DOX proteasome complex is formed when doxorubicin binds to the proteosome’s 20S subunit, where it is then translocated through the nuclear pore complexes into the nucleus. DOX has a higher affinity for nuclear DNA over the proteasome it is attached to, allowing it to dissociate itself from the proteasome and bind to the DNA [105]. Other doxorubicin actions include free radical generation which causes further DNA damage,
16 inhibition of macromolecule production, DNA unwinding/separation and increase in alkylation [108, 109]. A recent study reported doxorubicin’s ability to intercalate with not only nuclear DNA, but also mitochondrial DNA [110]. Furthermore, doxorubicin can affect the cell membrane directly by binding to plasma proteins causing enzymatic electron reduction of doxorubicin. This can cause the formation of highly reactive species of hydroxyl free radicals [107].
Results have suggested also that doxorubicin results in autophagy, being cytoprotective as a response to DNA damage. Nuclear enzyme (poly (ADP-ribose) polymerase-1) (PARP-1) activation is a vital event that decides whether the cell will undergo autophagy. Genotoxic stress can cause PARP-1 to hyperactivate, which in turn depletes both NAD+ and ATP. The cell will then experience energy failure that would be irreversible, resulting in cell death [109]. PARP-1’s role in doxorubicin-induced autophagy is made evident in the testing of PARP-1-deficient cells, where moderately high concentrations of doxorubicin were unable to induce cell death. Normally, when doxorubicin hyperactivates PARP-1 the cell experience cell death that shows characteristics of both autophagy and necrosis. This event shows evidence that the key event that triggers the cell to enter autophagy is the collapse of cellular energy as a result of PARP-1 hyperactivation. PARP-1 inhibition prevents cellular energy collapse and thus protects the cell from necrosis and delays doxorubicin induced autophagy, often resulting in apoptosis. This study shows PARP-1’s activation to be an important regulator of a cell’s fate. This is simply because PARP-1 can repair lesions caused by doxorubicin treatment, whilst during its inhibition PARP-1 cannot repair the DNA damage, resulting in cell death. Ultimately, PARP-1 requires a balance
17 between energy crisis and DNA damage, which depends on the dose of doxorubicin administered and PARP-1 activation [107].
18
2. Objectives of the study
The objectives of this research were to study the effects of AITC, EA, and thymol treatment on breast cancer (MDA-MB-231 and MCF-7) and non-tumorigenic breast (MCF-10A) cells, and to analyze the level of Caspase-8, Caspase-9, PARP, Beclin-1, and p-mTOR proteins, and the expression of BCL-2, MTOR, PRKAA1, and PER2 genes in MDA-MB-231 cells after treatment with AITC. The objective of this study was also to investigate potential synergistic effects of these compounds and DOX on breast cancer (MDA-MB-231) cells.
19
3. Materials and methods
3.1. Chemicals and reagents
AITC, EA, thymol, DOX, 3-(4,5-dimethylthiazol-2-yl)-2,5-diphenyltetrazolium bromide (MTT), propidium iodide (PI), ethanol, isopropanol were purchased from Sigma-Aldrich (St. Louis, Missouri, USA). AITC was dissolved in ethanol at a concentration of 10 mM, EA was dissolved in DMSO (dimethyl sulfoxide) at a concentration of 4 mg/ml, thymol was dissolved in ethanol at a concentration of 50 mM, DOX was dissolved in PBS at a concentration of 1 mM, and stored at 4 °C. Annexin V-FITC apoptosis detection kit was purchased from eBioscience Inc. (San Diego, California, USA), RIPA buffer was purchased from Thermo Fisher Scientific (Waltham, Massachusetts, USA). BCL-2, MTOR, PRKAA1, and PER2 gene primers were purchased from Integrated DNA Technologies (Coralville, IA, USA). Primary antibodies against Caspase-8, Caspase-9, PARP, Beclin-1, p-mTOR, NF-κB p65, and β-actin, and secondary antibodies were purchased from Cell Signaling Technology (Danvers, Massachusetts, USA).
3.2. Cell line and culture conditions
MDA-MB-231, MCF-7 human breast cancer cell lines and MCF-10A human breast epithelial cell line were purchased from Istituto Zooprofilattico Sperimentale della Lombardia e dell’Emilia Romagna (IZSLER, Brescia, Italy). MDA-MB-231 and MCF-7 cells were grown in Dulbecco's Modified Eagle Medium (DMEM) with high glucose (4500 mg/L), sodium pyruvate (110 mg/L) and L-glutamine (584 mg/L) supplemented with 10% fetal bovine serum and 1% penicillin-streptomycin. MCF-10A cells were grown in DMEM/F12 supplemented with 5% horse serum, 20 ng/ml EGF, 0.5 µg/ml hydrocortisone, 100 ng/ml cholera toxin, 10 µg/ml insulin and 1% penicillin-streptomycin. They were maintained at 37 °C and 5% CO2 in an incubator.
20 The growth medium was changed after 48 h or 72 h, and cells were trypsinized and subcultured when they reached 80-90% confluence.
3.3. Cell viability analysis
In order to analyze cell viability, we used MTT assay. Cells (2 × 10⁴/well) were seeded in 96-well plate. After 24 h, cells were treated with AITC (2.5, 5, 10, 20, 30, 40 µM), EA (2.5, 5, 7.5, 10, 15, 20 µg/ml), thymol (25, 50, 100, 150, 200, 250 µM), DOX (0.5, 1, 1.5 µM) alone or a combination. After 24 h or 48 h of treatment, some microscopic photographs were taken, 10 µl of MTT (5 mg/ml in PBS) was added to each well and the plate was incubated again for 3 h at 37 °C in incubator. Next, medium was removed, 200 µl of isopropanol was added, and the absorbance was read at 595 nm [111]. Cell viability rate was calculated following a formula [cell viability (%) = (average OD value of AITC-treated cells/average OD value of control cells) × 100].
3.4. Apoptosis analysis
For apoptosis analysis, MDA-MB-231 cells (1 × 10⁵/well) were cultured in 6-well plates for 24 h and treated with AITC at 10 µM. After 24 h of treatment, floating and adherent cells were collected and stained with Annexin V-FITC and PI following the manufacturer's instructions. Stained cells were then analyzed using an imaging flow cytometer named Flow Sight (Amnis Corporation, Washington, USA) and IDEAS Software version 6.2 (EMD Millipore, Burlington, Massachusetts , USA).
21
3.5. Cell cycle analysis
MDA-MB-231 cells (3.3 × 10⁵) were seeded in T25 flasks for 24 h and treated with AITC at 10 µM for 24 h. After that both floating and adherent cells were collected and fixed in 70% ethanol (cold) for 24 h. Ethanol was removed, cells were then washed twice with PBS, and resuspended in 1 ml of PBS containing 0.02 mg/ml PI, 0.2 mg/ml DNase-free RNase A, and 0.1% Triton X-100, and incubated for 15 min at 37 °C in incubator. After incubation, cells were analyzed using a flow cytometer [112].
3.6. RNA extraction and quantitative real-time PCR
MDA-MB-231 cells (3.3 × 10⁵) were seeded in T25 flasks. After 24 h, cells were treated with 10 µM AITC for 48 h. After incubation, the cells were collected for RNA extraction. Total RNA was isolated using the RNeasy Mini Kit(Qiagen) according to the manufacturer’s protocol. RNA concentrations and purities were determined using a Nanodrop 1000 spectrophotometer (Thermo Scientific, Wilmington, DE, USA). cDNA was synthesized using the High Capacity Kit (Applied Biosystems, USA) according to the manufacturer’s instructions. BCL-2, MTOR, PRKAA1, and PER2 gene expression levels were assayed using the TaqMan system (Applied Biosystems, Foster City, CA, USA). Each tube contained 2 µL of cDNA template, 5 µL of TaqMan 2×Master Mix (Applied Biosystems), 2.5 µL of water and 0.5 µL of 20×primers/probes (Assays-on-Demand gene expression products, Applied Biosystems). GAPDH was used as a housekeeping gene. The reaction was performed using the following thermalcycling conditions: 94 °C for 10 min, followed by 40 cycles of 94°C for 30 s and 60 °C for 1 min. The Ct (threshold cycle) value of each gene of interest was normalized to Ct value of GAPDH and the relative gene expression data were analyzed using the 2-∆CT method [113].
22
3.7. Western blotting
MDA-MB-231 cells (3.3 × 10⁵) were seeded in T25 flasks. After 24 h, cells were treated with 10 µM AITC for 48 h, and collected for protein expression analysis. Protein extraction and quantification as well as western blotting were performed according to protocol described elsewhere [111, 114, 115]. Briefly, cells were lysed in RIPA buffer supplemented with a cocktail of protease inhibitors (2 µg/ml aprotinin, 2 µg/ml leupeptin, 1 mM phenylmethyl-sulfonyl fluoride, and 2 µg/ml proteinin). Cell lysates were centrifuged to remove aggregates and cell debris, and stored at -80 °C until used. The protein levels were quantified using the Bradford assay. The protein samples (50 µg per lane) were boiled for 5 min, resolved using 12.5% SDS– PAGE, and transferred to a nitrocellulose membrane. Ponceau solution was used for the detection of proteins on nitrocellulose membranes. After blocking with 5% non-fat milk in PBS-Tween (0.1%), the membranes were incubated with primary antibodies overnight at 4 °C. The membranes were washed five times (5 min for each) in PBS-Tween (0.1%) and incubated for 3 h with corresponding secondary antibodies. After incubation, the membranes were washed five times (5 min for each) in PBS-Tween (0.1%) and blots were developed using the ECL detection system (Pierce Biotechnology). The band intensities were visualized and quantified with UVITEC Cambridge using the NineAlliance software.
3.8. Statistical analysis
Data were collected from three independent experiments and presented as mean ± SD (standard deviation). One-way ANOVA with post-hoc Tukey HSD (in case of multiple independent groups) and Student's T-Test (in case of two independent groups) with Bonferroni’s correction (in case of multiple testing) were used to evaluate the statistical significance and statistical
23 analyses were performed using SPSS 19.0 (Statistical Package for the Social Sciences Inc., Armonk, New York, USA) software. In figures, asterisk indicates the significant differences of data in comparison with the control. Data were considered statistically significant at p <0.05. IC50 values were calculated using GraphPad Prism 7.03 (GraphPad Software, San Diego, CA, USA). The combination index (CI) was evaluated by CompuSyn software (ComboSyn, Inc., Paramus, NJ) which is available at http://www.combosyn.com/feature.html. The CI value <1, =1, and >1 indicate synergism, additive effect and, antagonism, respectively.
24
4. Results
4.1. Effect of DOX on MDA-MB-231 cell growth
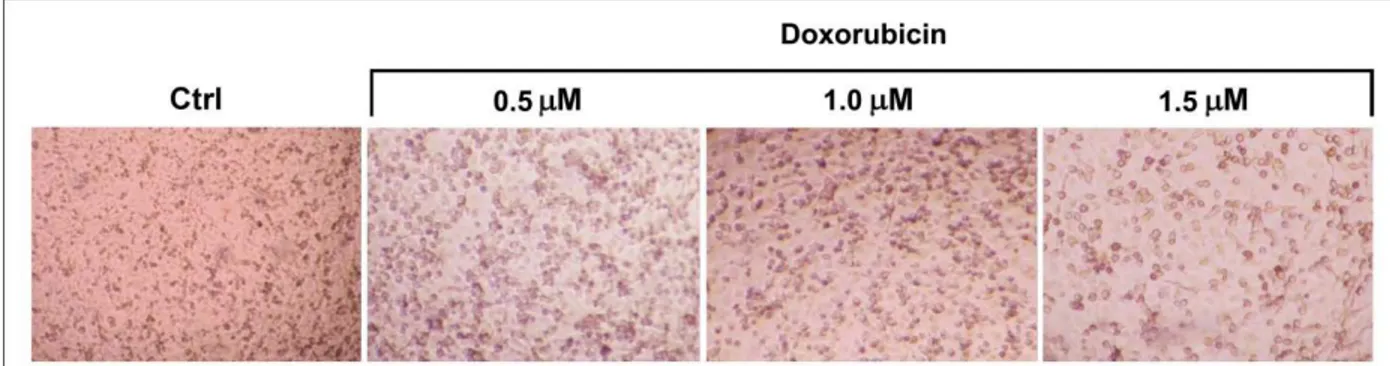
To determine the effect of DOX (0.5, 1, 1.5 µM) on MDA-MB-231 cell growth, MTT assay was performed after treating cells for 24 and 48 h. Some microscopic photographs of cells (control and after treatment with DOX for 48 h) and the results of MTT assay are shown in Figures 3 and 4, respectively. Treatment with DOX resulted in statistically significant (p < 0.05) growth inhibition of MDA-MB231 cells as compared to control cells.
Figure 3. Representative photographs of MDA-MB-231 cells (control and after treatment with
DOX for 48 h).
Figure 4. Graphical representation of the effect of DOX treatment on MDA-MB-231 cells as
measured by MTT assay. Cells were treated with DOX at indicated concentrations for 24 and 48 h. After incubation, cell viability was determined by the MTT assay. Values are presented as
25 mean ± SD and symbol asterisk indicates significant (p < 0.05) difference as compared to the control cells.
4.2. Effect of AITC alone and in combination with DOX on cell growth
4.2.1. AITC did not inhibit MDA-MB-231 cell proliferation while affected 7 and
MCF-10A cells
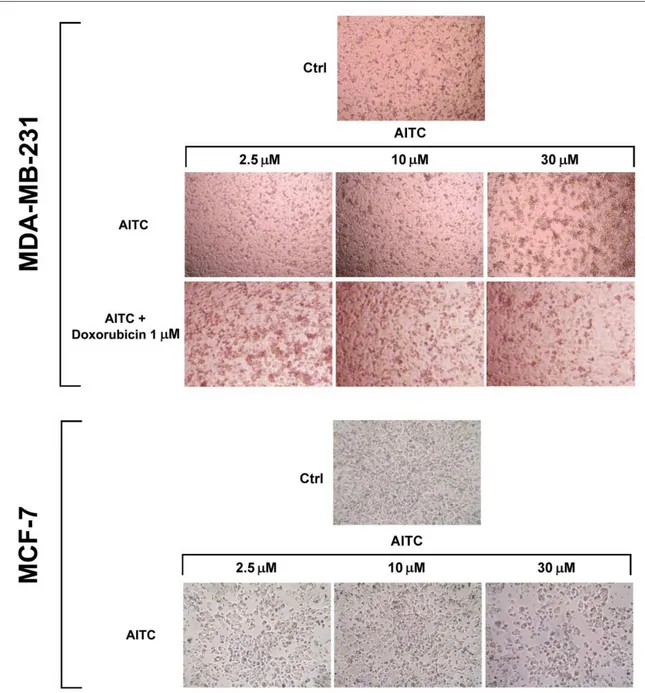
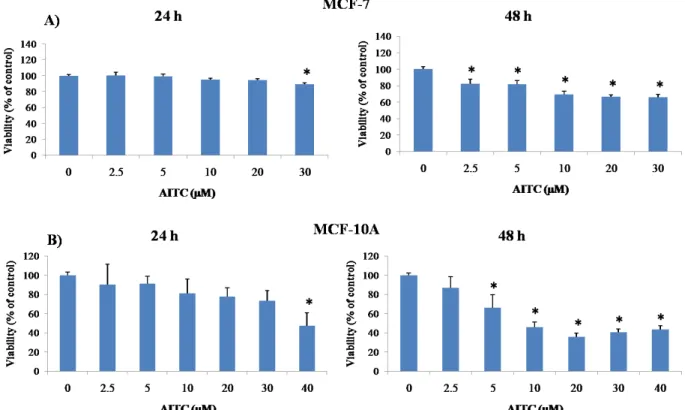
Experiments were planned to investigate whether AITC can inhibit proliferation of MDA-MB-231 breast cancer cells. For this study, 2.5, 5, 10, 20, 30 µM concentrations had been selected based on previous reports [51, 61]. Cells were treated with various concentrations of AITC for 24 and 48 h. AITC did not inhibit, rather slightly increased, the proliferation of these cells (Figures 5, 7, and 8). In contrast, AITC inhibited proliferation of MCF-7 cells in a dose and time-dependent manner (Figures 5 and 9). The IC50 values of AITC were 188.1 (at 24 h) and 126.0 µM (at 48 h) for MCF-7. The effect of AITC was also investigated on cell viability of MCF-10A non-tumorigenic breast cells. MCF-10A cells were treated with AITC at 0, 2.5, 5, 10, 20, 30, 40 µM for 24 and 48 h. Our results indicate that AITC shows toxic effects on this non-tumorigenic breast cell line (Figures 6 and 9).
26
Figure 5. Representative photographs of MDA-MB-231 and MCF-7 cells (control and after
27
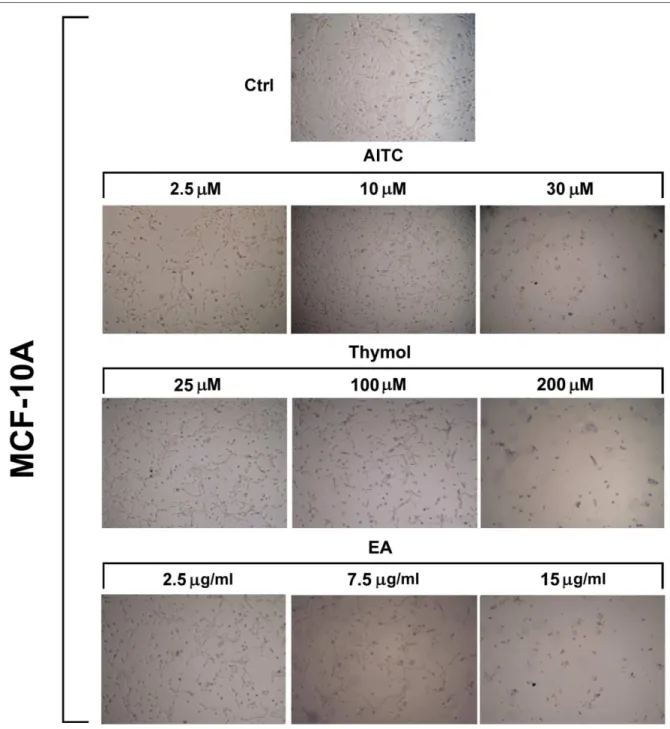
Figure 6. Representative photographs of MCF-10A cells (control and after treatment with AITC,
EA, and thymol for 48 h).
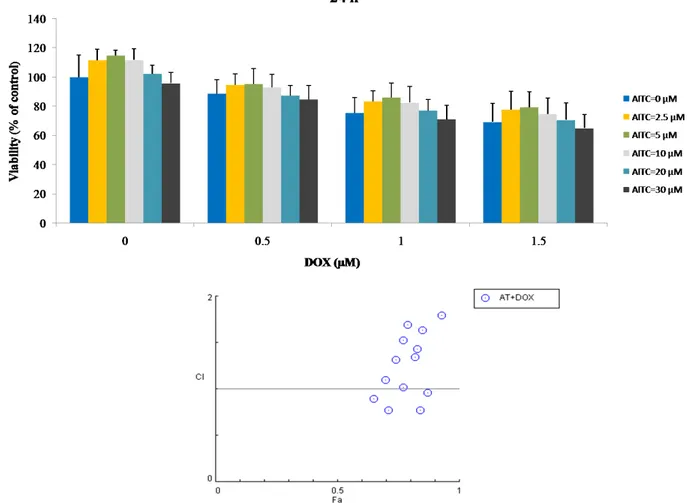
4.2.2. AITC did not synergistically sensitize MDA-MB-231 cells to DOX
To determine the synergistic effect of AITC and DOX, MDA-MB-231 cells were exposed to different concentration of AITC (2.5, 5, 10, 20, 30 µM) and DOX (0.5, 1, 1.5 µM) alone or in
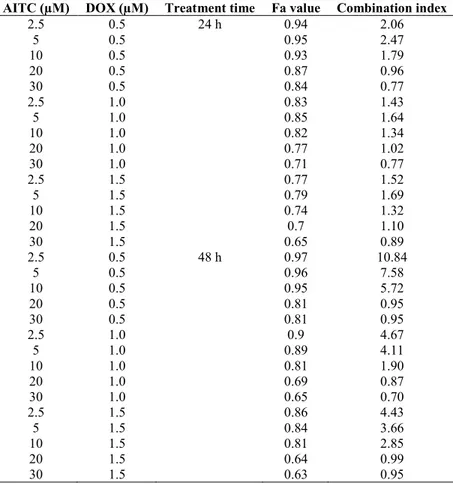
28 combination, and cell viability was detected. Combination treatment with DOX did not produce synergistic growth inhibition (Figures 7 and 8). In addition, combination index (CI) of each combined treatment was analyzed and shown in the Fa-Combination Index Plot (Table 2). Our results indicate that AITC has no potential to enhance the chemosensitivity of DOX.
Figure 7. Graphical representation of the effect of AITC, DOX, and their combination
treatments on MDA-MB-231 cells as measured by MTT assay. Cells were treated with AITC and DOX alone or in combination at indicated concentrations for 24 h. After incubation, cell viability was determined by the MTT assay and the combination index of each combination treatment was calculated by CompuSyn software (below). Values are presented as mean ± SD.
29
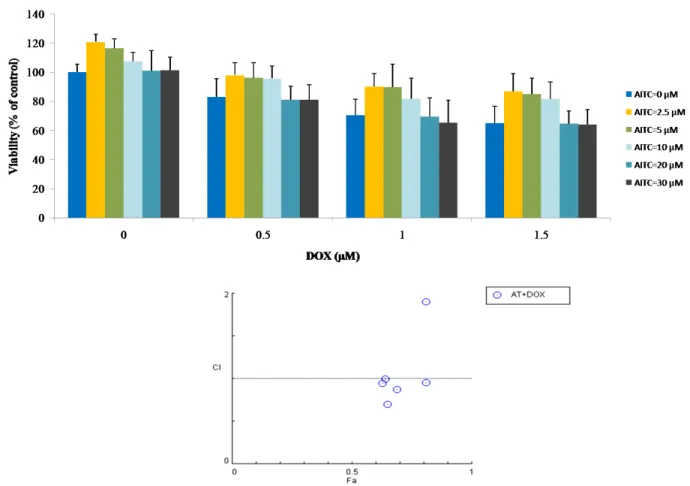
Figure 8. Graphical representation of the effect of AITC, DOX, and their combination
treatments on MDA-MB-231 cells as measured by MTT assay. Cells were treated with AITC and DOX alone or in combination at indicated concentrations for 48 h. After incubation, cell viability was determined by the MTT assay and the combination index of each combination treatment was calculated by CompuSyn software (below). Values are presented as mean ± SD.
30
Figure 9. Graphical representation of the effect of AITC treatments on MCF-7 and MCF-10A
cells as measured by MTT assay. MCF-7 (A) and MCF-10A (B) cells were treated with AITC at indicated concentrations for 24 and 48 h. After incubation, cell viability was determined by the MTT assay. Values are presented as mean ± SD and symbol asterisk indicates significant (p < 0.05) difference as compared to the control cells.
31
Table 2. Fa value and combination index of combined treatments of AITC and DOX in MDA-MB-231 cells.
AITC (µM) DOX (µM) Treatment time Fa value Combination index
2.5 0.5 24 h 0.94 2.06 5 0.5 0.95 2.47 10 0.5 0.93 1.79 20 0.5 0.87 0.96 30 0.5 0.84 0.77 2.5 1.0 0.83 1.43 5 1.0 0.85 1.64 10 1.0 0.82 1.34 20 1.0 0.77 1.02 30 1.0 0.71 0.77 2.5 1.5 0.77 1.52 5 1.5 0.79 1.69 10 1.5 0.74 1.32 20 1.5 0.7 1.10 30 1.5 0.65 0.89 2.5 0.5 48 h 0.97 10.84 5 0.5 0.96 7.58 10 0.5 0.95 5.72 20 0.5 0.81 0.95 30 0.5 0.81 0.95 2.5 1.0 0.9 4.67 5 1.0 0.89 4.11 10 1.0 0.81 1.90 20 1.0 0.69 0.87 30 1.0 0.65 0.70 2.5 1.5 0.86 4.43 5 1.5 0.84 3.66 10 1.5 0.81 2.85 20 1.5 0.64 0.99 30 1.5 0.63 0.95
4.2.3. AITC did not induce apoptosis and cell cycle arrest
Apoptosis was analyzed by flow cytometer in MDA-MB-231 cells after treatment with 10 µM AITC for 24 h. Approximately 3.2 and 6.0% of the AITC-treated cells were positive for Annexin V–FITC and PI after 24 h, respectively (Figures 10B-D). In comparison, 3.7 and 7.4% of the control cells were positive for Annexin V–FITC and PI, respectively (Figures 10-A, -C, -D). These results indicate that AITC did not induce, rather slightly decreased, apoptosis in these cells.
32
Figure 10. AITC did not induce apoptosis in MDA-MB-231 cells. (A and B) Flow cytometric
analysis of cell apoptosis. (C) Histogram showing dead and apoptotic rates of control and AITC-treated cells. (D) Representative flow cytometric images of propidium iodide (PI) and Annexin V positive cells.
Cell cycle control is important in cancer progression. Hence, it was studied the effects of AITC on cell cycle progression in MDA-MB-231 cells. Cytofluorimetric analysis indicated that AITC did not induce the arrest of phases of the cell cycle significantly. Approximately 12.2, 43.8, 9.8, 32.9, and 1.2% of AITC-treated cells were noted in G0/G1 (diploid), G0/G1 (aneuploid), S, G2, and M phases, respectively (Figures 11B-D). By contrast, approximately 11.8, 57.5, 8.9, 20.7, and 1.1% of control cells were noted in G0/G1 (diploid), G0/G1 (aneuploid), S, G2, and M phases,
33 respectively (Figures 11-A, -C, -D). These results suggest that AITC has no ability to induce the cell cycle arrest in MDA-MB-231 cells.
Figure 11. AITC did not induce cell cycle arrest in MDA-MB-231 cells. (A and B) Flow
cytometric analysis of cell cycle. (C) Histogram showing rate of control and AITC-treated cells of different cell cycle phases. (D) Representative flow cytometric images of cell cycle phases. *p < 0.05.
4.2.4. AITC upregulated BCL-2 and MTOR expression, while induced no changes in PRKAA1
and PER2 expression
In this study, it was also measured the expression levels of selected BCL-2, MTOR, PRKAA1, and PER2 genes in MDA-MB-231 cells after treatment with AITC (10 µM) for 48 h. It was observed that AITC significantly increased the expression of BCL-2 and MTOR (Figure 12). In
34 contrast, AITC did not affect the expression of PRKAA1 and PER2 (Figure 12). These results suggest that AITC may not inhibit, rather may promote, breast cancer cell growth.
Figure 12. Relative gene expression levels of BCL-2, MTOR, PRKAA1, and PER2 in
MDA-MB-231 cells after treatment with 10 µM AITC for 48 h. *p < 0.05.
4.2.5. AITC did not affect Caspase-8, Caspase-9, PARP, p-mTOR, and NF-κB p65 proteins level, while downregulated Beclin-1 protein level
Next, experiments were performed to study the expression levels of some selected Caspase-8, Caspase-9, PARP, Beclin-1, and p-mTOR proteins (Figure 13). These all genes are aberrantly expressed in breast cancer. A number of previous studies have reported that phytochemicals can modulate the expressions of these molecules in various cancer cells including breast cancer [63, 116-120]. Hence, it was analyzed the expression levels of these proteins by western blot technique. Cells were treated with 10 µM AITC for 48 h and we found that AITC did not affect the level of Caspase-8, Caspase-9, PARP, p-mTOR, and NF-κB p65 significantly. In contrast,
35 AITC decreased the level of Beclin-1 significantly. These results indicate that AITC shows no growth inhibitory effect on MDA-MB-231 cells.
Figure 13. Protein levels of Beclin-1, Caspase-8, Caspase-9, PARP, p-mTOR, and NF-κB p65 in
MDA-MB-231 cells after treatment with 10 µM AITC for 48 h. Protein expressions are also shown in the blotted membrane after ponceau staining. β-actin was used as a loading control. *p < 0.05.
4.3. Effect of EA alone and in combination with DOX on cell growth
4.3.1. EA inhibited MDA-MB-231 cell proliferation while affected MCF-10A cells
Experiments were planned to investigate whether EA can inhibit proliferation of MDA-MB-231 breast cancer cells. For this study, 2.5, 5, 7.5, 10, 15 µg/ml concentrations had been selected based on previous reports [121]. Cells were treated with various concentrations of EA for 24 and 48 h. As presented in Figures 14-16, EA inhibited the growth of MDA-MB-231 cells in a dose and time-dependent manner. The IC50 value of EA was 2.18 µg/ml for 24 h. We also investigated the effect of EA on cell viability of MCF-10A non-tumorigenic breast cells. MCF-10A cells
36 were treated with EA at 2.5, 5, 7.5, 10, 15, 20 µg/ml for 24 and 48 h. EA significantly (p < 0.05) inhibited the growth of non-tumorigenic breast cell line (Figures 6 and 17).
Figure 14. Representative photographs of MDA-MB-231 cells (control and after treatment with
EA and EA+DOX for 48 h).
4.3.2. EA synergistically sensitized MDA-MB-231 cells to DOX
To determine the synergistic effect of EA and DOX, MDA-MB-231 cells were exposed to different concentration of EA (2.5, 5, 7.5, 10, 15 µg/ml) and DOX (0.5, 1, 1.5 µM) alone or in combination, and cell viability was detected. Combination treatment with DOX produced synergistic growth inhibition (Figures 15 and 16). In addition, CI of each combined treatment was analyzed and shown in the Fa-Combination Index Plot. Our results indicate that EA has
37 strong potential to enhance the chemosensitivity of DOX. CI value <1 at different drug combination doses indicated a synergistic interaction between EA and DOX (Table 3).
Figure 15. Graphical representation of the effect of EA, DOX, and their combination treatments
on MDA-MB-231 cells as measured by MTT assay. Cells were treated with EA and DOX alone or in combination at indicated concentrations for 24 h. After incubation, cell viability was determined by the MTT assay and the combination index of each combination treatment was calculated by CompuSyn software (below). Values are presented as mean ± SD and symbol asterisk indicates significant (p < 0.05) difference as compared to the control cells.
38
Figure 16. Graphical representation of the effect of EA, DOX, and their combination treatments
on MDA-MB-231 cells as measured by MTT assay. Cells were treated with EA and DOX alone or in combination at indicated concentrations for 48 h. After incubation, cell viability was determined by the MTT assay and the combination index of each combination treatment was calculated by CompuSyn software (below). Values are presented as mean ± SD and symbol asterisk indicates significant (p < 0.05) difference as compared to the control cells.
39
Figure 17. Graphical representation of the effect of EA treatments on MCF-10A cells as
measured by MTT assay. MCF-10A cells were treated with EA at indicated concentrations for 24 and 48 h. After incubation, cell viability was determined by the MTT assay. Values are presented as mean ± SD and symbol asterisk indicates significant (p < 0.05) difference as compared to the control cells.
Table 3. Fa value and combination index of combined treatments of EA and DOX in MDA-MB-231 cells.
EA (µg/ml) DOX (µM) Treatment time Fa value Combination index
2.5 0.5 24 h 0.48 0.81 5 0.5 0.4 0.91 7.5 0.5 0.31 0.73 10 0.5 0.23 0.52 15 0.5 0.19 0.53 2.5 1.0 0.44 0.79 5 1.0 0.39 0.97 7.5 1.0 0.27 0.62 10 1.0 0.22 0.53 15 1.0 0.18 0.52 2.5 1.5 0.42 0.83 5 1.5 0.36 0.92 7.5 1.5 0.29 0.79 10 1.5 0.2 0.50 15 1.5 0.16 0.46 2.5 0.5 48 h 0.44 0.83 5 0.5 0.35 0.94 7.5 0.5 0.25 0.73 10 0.5 0.2 0.66 15 0.5 0.15 0.61 2.5 1.0 0.4 0.79 5 1.0 0.31 0.81 7.5 1.0 0.23 0.68 10 1.0 0.17 0.54 15 1.0 0.14 0.57 2.5 1.5 0.33 0.61 5 1.5 0.25 0.60 7.5 1.5 0.2 0.57 10 1.5 0.15 0.47 15 1.5 0.1 0.36
40
4.4. Effect of thymol alone and in combination with DOX on cell growth
4.4.1. Thymol did not inhibit MDA-MB-231 cell proliferation while affected MCF-10A cells
To determine the effect of thymol on MDA-MB-231 cell growth, MTT assay were performed after treating cells for 24 and 48 h. For this study, 25, 50, 100, 150, 200 µM concentrations had been selected [96]. As shown in Figures 18-20, thymol (25, 50, 100, and 150 µM) did not inhibit, rather slightly increased, the proliferation of these cells. We also investigated the effect of thymol on cell viability of MCF-10A cells. MCF-10A cells were treated with thymol at 25, 50, 100, 150, 200, 250 µM for 24 and 48 h. Thymol significantly (p < 0.05) affected the growth of non-tumorigenic breast cell line (Figures 6 and 21).
Figure 18. Representative photographs of MDA-MB-231 cells (control and after treatment with
41
4.4.2. Thymol did not synergistically sensitize MDA-MB-231 cells to DOX
To investigate the synergistic effect of thymol and DOX, MDA-MB-231 cells were exposed to different concentration of thymol (25, 50, 100, 150, 200 µM) and DOX (0.5, 1, 1.5 µM) alone or in combination, and cell viability was detected. Combination treatment with DOX did not produce synergistic growth inhibition (Figures 19 and 20). In addition, CI of each combined treatment was analyzed and shown in the Fa-Combination Index Plot (Table 4). Our results indicate that thymol has no potential to enhance the chemosensitivity of DOX.
Figure 19. Graphical representation of the effect of thymol, DOX, and their combination
treatments on MDA-MB-231 cells as measured by MTT assay. Cells were treated with thymol and DOX alone or in combination at indicated concentrations for 24 h. After incubation, cell
42 viability was determined by the MTT assay and the combination index of each combination treatment was calculated by CompuSyn software (below). Values are presented as mean ± SD.
Figure 20. Graphical representation of the effect of thymol, DOX, and their combination
treatments on MDA-MB-231 cells as measured by MTT assay. Cells were treated with thymol and DOX alone or in combination at indicated concentrations for 48 h. After incubation, cell viability was determined by the MTT assay and the combination index of each combination treatment was calculated by CompuSyn software (below). Values are presented as mean ± SD and symbol asterisk indicates significant (p < 0.05) difference as compared to the control cells.
43
Figure 21. Graphical representation of the effect of thymol treatments on MCF-10A cells as
measured by MTT assay. MCF-10A cells were treated with thymol at indicated concentrations for 24 and 48 h. After incubation, cell viability was determined by the MTT assay. Values are presented as mean ± SD and symbol asterisk indicates significant (p < 0.05) difference as compared to the control cells.
Table 4. Fa value and combination index of combined treatments of thymol and DOX in MDA-MB-231 cells.
Thymol (µM) DOX (µM) Treatment time Fa value Combination index
25 0.5 24 h 0.87 0.96 50 0.5 0.91 1.42 100 0.5 0.94 2.22 150 0.5 0.93 1.97 200 0.5 0.81 0.69 25 1.0 0.76 0.97 50 1.0 0.76 0.98 100 1.0 0.78 1.09 150 1.0 0.77 1.05 200 1.0 0.72 0.82 25 1.5 0.69 1.06 50 1.5 0.69 1.06 100 1.5 0.7 1.11 150 1.5 0.68 1.03 200 1.5 0.64 0.88 25 0.5 48 h 0.81 0.96 50 0.5 0.84 1.23 100 0.5 0.87 1.67 150 0.5 0.86 1.55 200 0.5 0.78 0.84 25 1.0 0.69 0.90 50 1.0 0.74 1.20 100 1.0 0.74 1.22 150 1.0 0.72 1.09 200 1.0 0.67 0.84 25 1.5 0.64 1.04 50 1.5 0.66 1.16 100 1.5 0.68 1.29 150 1.5 0.63 1.00 200 1.5 0.6 0.88
44
5. Discussion
A large number of previous studies have shown that natural compounds can inhibit cancer initiation, development, and progression [122]. They have been proposed as potential cancer preventive agents, although some natural compounds such as isothiocyanates show carcinogenesis promoting effects [123].
In this study, it has been demonstrated that AITC cannot inhibit, rather can promote, the proliferation of MDA-MB-231 breast cancer cells. Also, combination of AITC with DOX did not produce synergistic growth inhibition. In contrast, AITC can inhibit the proliferation of MCF-7 breast cancer cells. It has been observed that AITC did not induce apoptosis and as well it did not affect cell cycle progression of MDA-MB-231 cells, as demonstrated by flow cytometry. It has also been found that AITC failed to modulate the expression of Caspase-8, Caspase-9, PARP, and p-mTOR proteins, but reduced the expression of Beclin-1 proteins. In addition, AITC increased the expression of BCL-2 and MTOR genes, and did not affect PRKAA1 and PER2 genes. It has also been demonstrated that EA can inhibit MDA-MB-231 breast cancer cells and combination with DOX produced synergistic growth inhibition. In this study, it has been demonstrated that thymol cannot inhibit the proliferation of MDA-MB-231 breast cancer cells. Also, combination of thymol with DOX did not produce synergistic growth inhibition. Importantly, it has been observed that all three compounds significantly affected the MCF-10A non-tumorigenic breast cells.
AITC can inhibit the proliferation of MCF-7 cells while cannot MDA-MB-231 cells. The possible reason for this diverse effect of AITC is that MDA-MB-231 cells do not have estrogen
45 receptor while MCF-7 cells have, and AITC may act on estrogen receptor. It has not been used the MCF-7 cells for the further study since the MTT results confirmed the previous report [52].
Apoptosis is an important biological process by which cell death occurs and is generally characterized by DNA and nuclear fragmentation, chromatin condensation, cytoplasmic membrane blebbing, and messenger RNA degradation. Apoptosis is regulated by various factors such as Fas receptors, caspases, and Bcl-2 family members [4, 124, 125]. This process is defective in various diseases including cancer. It has been found that AITC at 10 µM did not induce apoptosis in MDA-MB-231 breast cancer cells, as demonstrated by flow cytometry. Earlier studies have shown that AITC increased Caspase-8 in MDA-MB-231 cells [52] and HL60 human leukaemia cells [59], increased Caspase-9 in 231 [52] and MDA-MB-468 breast [51], UM-UC-3 bladder [54] cancer cells, GBM 8401 brain malignant glioma cells [55], decreased Bcl-2 in MDA-MB-231 [52] and MDA-MB-468 [51] breast cancer cells, PC-3 prostate cancer cells in vitro [57] and in vivo [58], increased PARP in MDA-MB-231 breast cancer [52] and SW620 colorectal adenocarcinoma cells [126]. It has been further studied the expression of these molecules in AITC-treated cells. Unexpectedly, it has been found that AITC (10 µM) did not affect the expression of Caspase-8, Caspase-9, and PARP proteins, as well as increased the expression of BCL-2 gene. These results suggest that AITC could not induce apoptosis in MDA-MB-231 cells.
Previous studies reported that AITC induced S phase cell cycle arrest in bladder cancer [127] and lung cancer [61] cells, and G2/M phase cell cycle arrest in bladder cancer [127], lung cancer [61], MDA-MB-468 breast cancer [51], brain malignant glioma [55], prostate cancer [57], and
46 leukemia [59] cells. In this study, it has been observed that AITC did not induce cell cycle arrest significantly. These results suggest that AITC may not inhibit the growth of MDA-MB-231 cells.
Beclin-1 plays an important role in autophagic and cell death process and interacts with Bcl-2 family members [128]. This molecule is aberrantly expressed in breast cancer and has been suggested as a therapeutic target [129]. It has been found that AITC decreased Beclin-1 level. Study reported that overexpressed Beclin-1 may promote autophagy in autophagy-defective breast cancer cells [130]. Based on our results, it can be suggested that AITC may downregulate the autophagic-factor Beclin-1 in MDA-MB-231 cells.
mTOR, a serine/threonine kinase, regulates cell proliferation, tumorigenesis, and autophagy [131]. The abnormal expression of mTOR is illustrated in breast cancer cells [132, 133]. Previous studies reported that isothiocyanates can suppress mTOR in cancer cells [134-137]. In this study, it has been found that AITC upregulated MTOR expression. Although MTOR was upregulated in AITC-treated cells, p-mTOR protein level was not significantly upregulated, and this difference is likely that this is not due to a simple difference in sensitivity between the two assays.
NF-κB has been reported to regulate the expression of genes involved in tumor development and progression [138]. It is overexpressed in breast cancer [139]. Various natural products including AITC have been shown to inhibit this oncogenic factor in breast cancer [119, 140]. In this study, it has been observed that AITC did not affect NF-κB p65 significantly, which suggests that AITC has no ability to suppress this molecule in breast cancer.
47
PRKAA1, a subunit of the AMPK pathway, has been reported to play critical roles in cell proliferation [141], autophagy [142]. It has been shown that activation of AMPKα1 and AMPKα suppressed the growth of colon cancer [143] and breast cancer [144] cells, respectively. Results of this study revealed that AITC did not affect the expression of PRKAA1 in MDA-MB-231 cells, indicating AITC may not inhibit MDA-MB-231 breast cancer cell growth.
PER2 is a well known circadian clock gene and is involved in regulating circadian rhythms. It is aberrantly expressed in breast cancer [145, 146]. PER2 may act as tumor suppressor gene [147, 148]. Studies have shown that PER2 can regulate cell cycle-related molecules Cyclin D and Cyclin E [149], and cell adhesion-related molecule β-catenin [150]. It has been found that AITC did not affect PER2 expression,suggesting AITC may not modulate this molecule in MDA-MB-231 breast cancer cells.
Previous studies reported that EA can inhibit MDA-MB-231 cell growth [151-153]. This study also confirms that EA has the strong potential to inhibit MDA-MB-231 cell growth. This study also reports that thymol cannot inhibit the proliferation of these cells, although it was reported that thymol inhibits the proliferation of the MDA-MB-231 cells [97]. Until today, there is no report on effect of AITC, EA, or thymol on breast cancer cells in combination with DOX.
48
6. Conclusions
6.1. AITC
AITC does not inhibit the proliferation of MDA-MB-231 breast cancer cells. AITC may not suppress, rather may promote, the aberrant expression of molecules related to proliferation, apoptosis, andautophagy in this breast cancer cells. Moreover, AITC can display cytotoxic effect on healthy breast cells. Although, AITC has been suggested as a potential anticancer agent, this compound may not have potential inhibitory effect in triple negative breast cancer. The results of this in vitro study warrant more preclinical and clinical studies on the beneficial and harmful effects of AITC in healthy and cancer cells.
6.2. EA
The results of this present study indicate that EA can inhibit the proliferation of MDA-MB-231 breast cancer cells. This compound in combination with DOX can also inhibit this cancer synergistically. Importantly, EA can display cytotoxic effect on healthy breast cells. Further detailed investigations may be required.
6.3. Thymol
Thymol does not inhibit the proliferation of MDA-MB-231 breast cancer cells. This compound in combination with DOX also does not produce synergistic growth inhibition. In addition to these, thymol can show cytotoxic effect on healthy breast cells. More preclinical and clinical studies on the beneficial and harmful effects of this compound are required in healthy and cancer cells.
49
7. Acknowledgments
I am very grateful to the Polytechnic University of Marche, Ancona, Italy for granting a scholarship. This scholarship greatly helped and encouraged me for this study.
I am very grateful to Dr. Massimo Bracci who supervised my work. He had done enough for me. Especially, his great supports, suggestions, and encouragements always helped me during the whole work. His friendly manner was a great support.
I thank Prof. Lory Santarelli who was my tutor. She supported me a lot. I would also like to thank Prof. Roberto Di Primio who supported me indirectly for several purposes of this study. I thank Dr. Guendalina Lucarini and Dr. Raffaella Lazzarini who helped me in many cases.
I would like to thank all fellows of the lab who helped me to learn and to conduct the experiments during this period. I would also like to thank Giulia Sorgentoni and Miriam Caffarini (Histology lab) who helped me to learn many things at the beginning of the study.
I thank my parents, uncles, brothers, sisters, and friends. Their blessings and supports gave me the strength to complete this study.
50
8. References
1. Ferlay, J.; Soerjomataram, I.; Dikshit, R.; Eser, S.; Mathers, C.; Rebelo, M.; Parkin, D. M.; Forman, D.; Bray, F., Cancer incidence and mortality worldwide: sources, methods and major patterns in GLOBOCAN 2012. Int J Cancer 2015, 136, E359-86.
2. Siegel, R. L.; Miller, K. D.; Jemal, A., Cancer Statistics, 2017. CA Cancer J Clin 2017, 67, 7-30.
3. Parton, M.; Dowsett, M.; Smith, I., Studies of apoptosis in breast cancer. BMJ 2001, 322, 1528-32.
4. Hengartner, M. O., The biochemistry of apoptosis. Nature 2000, 407, 770-6.
5. Stennicke, H. R.; Jurgensmeier, J. M.; Shin, H.; Deveraux, Q.; Wolf, B. B.; Yang, X.; Zhou, Q.; Ellerby, H. M.; Ellerby, L. M.; Bredesen, D.; Green, D. R.; Reed, J. C.; Froelich, C. J.; Salvesen, G. S., Pro-caspase-3 is a major physiologic target of caspase-8. J Biol Chem 1998, 273, 27084-90.
6. Li, H.; Zhu, H.; Xu, C. J.; Yuan, J., Cleavage of BID by caspase 8 mediates the mitochondrial damage in the Fas pathway of apoptosis. Cell 1998, 94, 491-501.
7. Oliver, F. J.; de la Rubia, G.; Rolli, V.; Ruiz-Ruiz, M. C.; de Murcia, G.; Murcia, J. M., Importance of poly(ADP-ribose) polymerase and its cleavage in apoptosis. Lesson from an uncleavable mutant. J Biol Chem 1998, 273, 33533-9.
8. Satoh, M. S.; Lindahl, T., Role of poly(ADP-ribose) formation in DNA repair. Nature
1992, 356, 356-8.
9. Nicholson, D. W.; Ali, A.; Thornberry, N. A.; Vaillancourt, J. P.; Ding, C. K.; Gallant, M.; Gareau, Y.; Griffin, P. R.; Labelle, M.; Lazebnik, Y. A.; et al., Identification and inhibition of the ICE/CED-3 protease necessary for mammalian apoptosis. Nature 1995, 376, 37-43.
51 10. Zhong, Y.; Wang, Q. J.; Li, X.; Yan, Y.; Backer, J. M.; Chait, B. T.; Heintz, N.; Yue, Z., Distinct regulation of autophagic activity by Atg14L and Rubicon associated with Beclin 1-phosphatidylinositol-3-kinase complex. Nat Cell Biol 2009, 11, 468-76.
11. Baeuerle, P. A.; Baltimore, D., NF-kappa B: ten years after. Cell 1996, 87, 13-20.
12. Gupta, S., Molecular signaling in death receptor and mitochondrial pathways of apoptosis (Review). Int J Oncol 2003, 22, 15-20.
13. Xu, Y.; Toh, K. L.; Jones, C. R.; Shin, J. Y.; Fu, Y. H.; Ptacek, L. J., Modeling of a human circadian mutation yields insights into clock regulation by PER2. Cell 2007, 128, 59-70.
14. Gwinn, D. M.; Shackelford, D. B.; Egan, D. F.; Mihaylova, M. M.; Mery, A.; Vasquez, D. S.; Turk, B. E.; Shaw, R. J., AMPK phosphorylation of raptor mediates a metabolic checkpoint. Mol Cell 2008, 30, 214-26.
15. DeBerardinis, R. J.; Thompson, C. B., Cellular metabolism and disease: what do metabolic outliers teach us? Cell 2012, 148, 1132-44.
16. Ferlay, J.; Héry, C.; Autier, P.; Sankaranarayanan, R., Global Burden of Breast Cancer. In Breast Cancer Epidemiology, Li, C., Ed. Springer New York: New York, NY, 2010; pp 1-19.
17. Lillie, S. E.; Brewer, N. T.; O'Neill, S. C.; Morrill, E. F.; Dees, E. C.; Carey, L. A.; Rimer, B. K., Retention and use of breast cancer recurrence risk information from genomic tests: the role of health literacy. Cancer Epidemiol Biomarkers Prev 2007, 16, 249-55.
18. Campeau, P. M.; Foulkes, W. D.; Tischkowitz, M. D., Hereditary breast cancer: new genetic developments, new therapeutic avenues. Hum Genet 2008, 124, 31-42.
19. Bozovic-Spasojevic, I.; Azambuja, E.; McCaskill-Stevens, W.; Dinh, P.; Cardoso, F., Chemoprevention for breast cancer. Cancer Treat Rev 2012, 38, 329-39.
52 20. Files, J. A.; Stan, D. L.; Allen, S. V.; Pruthi, S., Chemoprevention of breast cancer.
Womens Health (Lond) 2012, 8, 635-46.
21. Fagundes, C. P.; Lindgren, M. E.; Shapiro, C. L.; Kiecolt-Glaser, J. K., Child maltreatment and breast cancer survivors: social support makes a difference for quality of life, fatigue and cancer stress. Eur J Cancer 2012, 48, 728-36.
22. Narod, S. A., Hormone replacement therapy and the risk of breast cancer. Nat Rev Clin Oncol 2011, 8, 669-76.
23. Park, S. Y.; Kolonel, L. N.; Lim, U.; White, K. K.; Henderson, B. E.; Wilkens, L. R., Alcohol consumption and breast cancer risk among women from five ethnic groups with light to moderate intakes: the Multiethnic Cohort Study. Int J Cancer 2014, 134, 1504-10.
24. Crujeiras, A. B.; Diaz-Lagares, A.; Carreira, M. C.; Amil, M.; Casanueva, F. F., Oxidative stress associated to dysfunctional adipose tissue: a potential link between obesity, type 2 diabetes mellitus and breast cancer. Free Radic Res 2013, 47, 243-56. 25. Pierobon, M.; Frankenfeld, C. L., Obesity as a risk factor for triple-negative breast
cancers: a systematic review and meta-analysis. Breast Cancer Res Treat 2013, 137, 307-14.
26. Jia, Y.; Lu, Y.; Wu, K.; Lin, Q.; Shen, W.; Zhu, M.; Huang, S.; Chen, J., Does night work increase the risk of breast cancer? A systematic review and meta-analysis of epidemiological studies. Cancer Epidemiol 2013, 37, 197-206.
27. Hasanpourghadi, M.; Pandurangan, A. K.; Karthikeyan, C.; Trivedi, P.; Mustafa, M. R., Mechanisms of the anti-tumor activity of Methyl 2-(-5-fluoro-2-hydroxyphenyl)-1 H-benzo[d]imidazole-5-carboxylate against breast cancer in vitro and in vivo. Oncotarget
2017, 8, 28840-28853.
28. De Laurentiis, M.; Cianniello, D.; Caputo, R.; Stanzione, B.; Arpino, G.; Cinieri, S.; Lorusso, V.; De Placido, S., Treatment of triple negative breast cancer (TNBC): current options and future perspectives. Cancer Treat Rev 2010, 36 Suppl 3, S80-6.
53 29. Dai, X.; Li, T.; Bai, Z.; Yang, Y.; Liu, X.; Zhan, J.; Shi, B., Breast cancer intrinsic subtype classification, clinical use and future trends. Am J Cancer Res 2015, 5, 2929-43. 30. Hasanpourghadi, M.; Looi, C. Y.; Pandurangan, A. K.; Sethi, G.; Wong, W. F.; Mustafa,
M. R., Phytometabolites Targeting the Warburg Effect in Cancer Cells: A Mechanistic Review. Curr Drug Targets 2017, 18, 1086-1094.
31. Darnell, J. E., Jr., STATs and gene regulation. Science 1997, 277, 1630-5.
32. Akl, M. R.; Ayoub, N. M.; Ebrahim, H. Y.; Mohyeldin, M. M.; Orabi, K. Y.; Foudah, A. I.; El Sayed, K. A., Araguspongine C induces autophagic death in breast cancer cells through suppression of c-Met and HER2 receptor tyrosine kinase signaling. Mar Drugs
2015, 13, 288-311.
33. Nobili, S.; Lippi, D.; Witort, E.; Donnini, M.; Bausi, L.; Mini, E.; Capaccioli, S., Natural compounds for cancer treatment and prevention. Pharmacol Res 2009, 59, 365-78.
34. Torquato, H. F.; Goettert, M. I.; Justo, G. Z.; Paredes-Gamero, E. J., Anti-Cancer Phytometabolites Targeting Cancer Stem Cells. Curr Genomics 2017, 18, 156-174. 35. Newman, D. J.; Cragg, G. M.; Snader, K. M., Natural products as sources of new drugs
over the period 1981-2002. J Nat Prod 2003, 66, 1022-37.
36. Kushad, M. M.; Brown, A. F.; Kurilich, A. C.; Juvik, J. A.; Klein, B. P.; Wallig, M. A.; Jeffery, E. H., Variation of glucosinolates in vegetable crops of Brassica oleracea. J Agric Food Chem 1999, 47, 1541-8.
37. Hao, G.; Wang, Q.; Liu, B.; Liu, J., Phytochemical profiling of five medicinally active constituents across 14 Eutrema species. Fitoterapia 2016, 110, 83-8.
38. Loebers, A.; Muller-Uri, F.; Kreis, W., A young root-specific gene (ArMY2) from horseradish encoding a MYR II myrosinase with kinetic preference for the root-specific glucosinolate gluconasturtiin. Phytochemistry 2014, 99, 26-35.
54 39. Ioannou, Y. M.; Burka, L. T.; Matthews, H. B., Allyl isothiocyanate: comparative
disposition in rats and mice. Toxicol Appl Pharmacol 1984, 75, 173-81.
40. Bollard, M.; Stribbling, S.; Mitchell, S.; Caldwell, J., The disposition of allyl isothiocyanate in the rat and mouse. Food Chem Toxicol 1997, 35, 933-43.
41. Munday, R.; Zhang, Y.; Fahey, J. W.; Jobson, H. E.; Munday, C. M.; Li, J.; Stephenson, K. K., Evaluation of isothiocyanates as potent inducers of carcinogen-detoxifying enzymes in the urinary bladder: critical nature of in vivo bioassay. Nutr Cancer 2006, 54, 223-31.
42. Shapiro, T. A.; Fahey, J. W.; Wade, K. L.; Stephenson, K. K.; Talalay, P., Human metabolism and excretion of cancer chemoprotective glucosinolates and isothiocyanates of cruciferous vegetables. Cancer Epidemiol Biomarkers Prev 1998, 7, 1091-100.
43. Jiao, D.; Ho, C. T.; Foiles, P.; Chung, F. L., Identification and quantification of the N-acetylcysteine conjugate of allyl isothiocyanate in human urine after ingestion of mustard. Cancer Epidemiol Biomarkers Prev 1994, 3, 487-92.
44. Ahn, M.; Kim, J.; Bang, H.; Moon, J.; Kim, G. O.; Shin, T., Hepatoprotective effects of allyl isothiocyanate against carbon tetrachloride-induced hepatotoxicity in rat. Chem Biol Interact 2016, 254, 102-8.
45. Subedi, L.; Venkatesan, R.; Kim, S. Y., Neuroprotective and Anti-Inflammatory Activities of Allyl Isothiocyanate through Attenuation of JNK/NF-kappaB/TNF-alpha Signaling. Int J Mol Sci 2017, 18.
46. Wagner, A. E.; Boesch-Saadatmandi, C.; Dose, J.; Schultheiss, G.; Rimbach, G., Anti-inflammatory potential of allyl-isothiocyanate--role of Nrf2, NF-(kappa) B and microRNA-155. J Cell Mol Med 2012, 16, 836-43.
47. Kim, Y. J.; Lee, D. H.; Ahn, J.; Chung, W. J.; Jang, Y. J.; Seong, K. S.; Moon, J. H.; Ha, T. Y.; Jung, C. H., Pharmacokinetics, Tissue Distribution, and Anti-Lipogenic/Adipogenic Effects of Allyl-Isothiocyanate Metabolites. PLoS One 2015, 10, e0132151.