Oxygen cost of dynamic leg exercise on a cycle
ergometer: effects of gravity acceleration
M . G I R A R D I S ,1 D . L I N N A R S S O N ,2 C . M O I A ,1 D . R . P E N D E R G A S T3 and G . F E R R E T T I1
1 DeÂpartement de Physiologie, Centre MeÂdical Universitaire, 1 rue Michel Servet, 1211 GeneÁve, Switzerland
2 Environmental Physiology Laboratory, Department of Physiology and Pharmacology, Karolinska Institute, Stockholm, Sweden 3 Department of Physiology, State University of New York at Buffalo, Buffalo, New York, USA
ABSTRACT
A model of the metabolic internal power ( _Eint) during cycling, which includes the gravity acceleration (ag) as a variable, is presented. This model predicts that _Eintis minimal in microgravity (0 g; g 9.81 m s±2), and increases linearly with a
g, whence the hypothesis that the oxygen uptake ( _VO2) during cycling depends on ag. Repeated _VO2measurements during steady-state exercise at 50, 75 and 100 W on the cycle ergometer, performed in space (0 g) and on Earth (1 g) on two subjects, validated the model. _VO2was determined from the time course of decreasing O2fraction during rebreathing. The gas volume during rebreathing was determined by the dilution principle, using an insoluble inert gas (SF6). Average _VO2for subject 1 at each power was 0.99, 1.21 and 1.52 L min±1at 1 g (n 3) and 0.91, 1.13 and 1.32 L min±1at 0 g (n 5). For subject 2 it was 0.90, 1.12 and 1.42 L min±1at 1 g, and 0.76, 0.98 and 1.21 L min±1at 0 g. These values corresponded to those predicted from the model. Although resting _VO2was lower at 0 g than at 1 g, the net (total minus resting) exercise _VO2was still smaller at 0 g than at 1 g. This difference re¯ects the lower _Eintat 0 g. Keywords exercise, gravity acceleration, humans, internal work, oxygen uptake.
Received 14 December 1998, accepted 19 April 1999
The overall metabolic power developed by humans during dynamic leg exercise on a cycle ergometer is the sum of at least two components: (i) external power, or the power required to overcome the resistance applied to the ergometer, (ii) internal power, or the rate of energy expenditure required to move the lower limbs without opposition against an external load. The metabolic external power at any given pedalling fre-quency ( fp) is a linear function of mechanical power, and thus of the resistance applied to the ergometer (Dickinson 1929, Garry & Wishart 1931, Henry & De Moor 1950, Banister & Jackson 1967, Whipp & Wasserman 1969, Gaesser & Brooks 1975). The reciprocal of the slope of this relationship has been de®ned as the delta-ef®ciency of exercise (Gaesser & Brooks 1975).
The relationship between metabolic power and mechanical power takes different y-intercepts when weights are added to the legs (Kamon et al. 1973) or gravity acceleration (ag) is increased (Bjurstedt et al. 1968). Cotes (1969) was the ®rst to attribute these
differences to changes in the cost of lifting the mass of the legs during pedalling. This qualitative statement introduced the concept of internal power during cycling, which became the object of several investigations (Kaneko & Yamazaki 1978, Wells et al. 1986, Luhtanen et al. 1987, Widrick et al. 1992). The fpand the mass of the legs (mL) were identi®ed as two of the determinants of internal power (Wells et al. 1986, Widrick et al. 1992, Francescato et al. 1995).
In this paper we propose a more complete model of metabolic internal power during cycling, which adds ag to fp and mL as an independent determinant of it. In fact, owing to asymmetries in the pedalling cycle, the rotational movement of the legs is opposed, besides the external load, by the gravitational force and by inertial forces. Inertia accounts for a small fraction of the overall acceleration, and can be neglected in the present context. Gravity acceleration however, cannot be ignored as a determinant of internal work, although it was in previous studies, probably because it was considered invariant on Earth.
The present model (see Theory) predicts that the metabolic internal power increases linearly with ag, and is minimal in microgravity. This being the case, the rate of oxygen uptake ( _VO2) during cycling against a given external load would partly depend on gravity accelera-tion. Lower _VO2 values would be expected at the steady-state of given submaximal powers in micro-gravity (0 g; g 9.81 m s±2) than on Earth (1 g).
Validation of this model was performed by means of _
VO2 values obtained during dynamic leg exercise on the cycle ergometer at various submaximal powers (i) on Earth (1 g) vs. a long-term space ¯ight (0 g), and (ii) on Earth vs. the human centrifuge at 3 g. The former data are new and unpublished, so they are presented in detail in the Methods and Results sections. The latter data are from the literature (Bjurstedt et al. 1968, Rosenhamer 1968, Nunneley & Shindell 1975), and are introduced in Discussion.
THEORY
During exercise at submaximal powers below the so-called lactate threshold, the net (total minus resting)
_
VO2of the whole body is equivalent to the net rate of energy expenditure ( _E ). _E is equal to the sum of the rates of energy expenditure required to overcome external ( _Eext) and internal ( _Eint) powers. _Eext is a linear function of the external mechanical power applied on the ergometer ( _w), as follows:
_
Eext _wDgÿ1 1
where the constant Dg, that is the reciprocal of the slope of this relationship, is the delta-ef®ciency of dynamic leg exercise (Gaesser & Brooks 1975). This yields:
_
E _wDgÿ1 _E
int 2
_
Eint is independent of _w, is a power function of the pedalling frequency (fp) (di Prampero et al. 1979) and is a linear function of the weight of the legs, that is the product of the mass of the legs (mL) times ag. For a given fpthis implies:
_
Eint emLag 3
where the constant e, which has the dimension of a velocity, contains the length of the pedal lever and the fourth power of fp. The equation relating e to fp has been derived, by introducing ag and correcting for appropriate units, from the empirical data of Francescato et al. (1995), obtained over an fp range from 40 to 100 min±1: e 0:112f4:165 P 4 where e is in m s±1and f pin s±1. Substitution of Eqn 4 in Eqn 3 yields: _ Eint 0:112mLagfP4:165 5
where _Eint is in W, mL is in kg and ag is in m s±2. Francescato et al. described also a quadratic equation relating Dg to fpduring cycling, as follows:
Dg 0:13f2
P ÿ 0:18fP 0:326 6
Substitution of Eqns 5 and 6 in Eqn 2 yields: E _w 0:13f2
Pÿ 0:18fP 0:326ÿ1 0:112mLagfP4:165
7 Eqn 7 describes the overall relationship between _E, mL, ag, fpand _w during exercise on the cycle ergometer. It is noteworthy that at 0 g, the second term of the right-hand branch of Eqn 7, designating _Eint, equals 0, so that _E is equal to _Eext, and therefore varies only as a function of w and fp.
It follows from Eqn 7 that, at any given power output below the so-called lactate threshold, the oxygen uptake at the exercise steady-state ( _VO2) varies with ag, being minimal at 0 g (space ¯ight) irrespective of the mL, and being increased in hypergravity environments, as can be obtained in the human centrifuge, with re-spect to the values usually observed on Earth, at 1 g.
It is noteworthy that the internal power includes also a component related to frictional and visco-elastic forces developing inside the contracting muscles. This component cannot be quanti®ed, is likely independent of ag and is not taken into account as such in this model. Yet it is measured with _E and is likely, although in formally inappropriate manner, concealed in the ®rst term of the right-hand branch of Eqn 7, as it is ex-pected to vary with _w and fp.
METHODS Subjects
A total of 10 determinations of steady-state _VO2during submaximal dynamic leg exercise were obtained on two subjects (age 37 years and body mass before ¯ight 75.1 kg for subject 1; age 39 years and body mass before ¯ight 68.9 kg for subject 2), who ¯ew onboard the Russian Space Station Mir for 6 months. Both subjects were perfectly aware of the procedures and of their implicit risks, and gave their informed consent. Ethical and medical approval to the experiments was given by the Medical Board of the European Space Agency.
The mLwas not measured, and it was assumed to be 32.2% of total body mass on Earth (Winter 1979). This estimate was used for the data obtained at 1 g, prior to the space ¯ight. No attempt of estimating mLat 0 g was made, because, according to Eqn 5, the _Eintat 0 g is by de®nition equal to 0 W, irrespective of mL.
Measurements and calculations
The _VO2 was measured by a closed circuit method during rebreathing. The rebreathing bag was ®lled with a mixture containing O2, a soluble inert gas (N2O, added for other purposes) and an insoluble inert gas (SF6), balanced with N2. This mixture was diluted with ambient air using a calibrated syringe, to spare gas during the ¯ight. The initial O2 fraction in the bag ranged between 0.326 and 0.375, in order to avoid the occurrence of hypoxia at the end of the rebreathing manoeuvre. The volume of the rebreathing bag was empirically established prior to the ®rst experiment, it was increased with the power output and ranged between 2.5 and 3.5 L. During rebreathing, the dry fractions of O2, CO2 and SF6 (FO2, FCO2 and FSF6, respectively) at the mouth were continuously monitored by a photo-acoustic gas analyser (RMS-II, Innovision A/S, Odense, Denmark), stored on a magnetic disk and subsequently analysed by means of Matlab software (Mathworks, USA). The combined accuracy of the gas delivery system and the SF6analysis for determining gas volumes by dilution was checked repeatedly before and during the ¯ight by adding known volumes of air to the rebreathing bag with the calibration syringe.
The knowledge of bag volume (Vbag; L) and initial bag FSF6 [FSF6(t0)] allowed computation of the overall closed circuit volume (i.e. bag volume + dead space volume + alveolar volume, Vsys) from the time course of FSF6 [FSF6(t); from the third breath onward] using the dilution principle:
Vsys t FSF6 t0VbagFSF6 tÿ1 9
The amount of oxygen in the system at any breath (VO2(t ); (L) was obtained by multiplying Vsys(t ) times the corresponding end tidal oxygen fraction [FetO2(t )]. VO2(t ) is linearly related to the rebreathing time (tR; min), the slope being equal to _VO2: this allows computation of
_
VO2(L min±1) by the least mean square method. Four-to-seven breaths, at the end of which the FO2inside the bag ranged between 0.246 and 0.193, could be used for the computation of _VO2. The regression lines with a correlation coef®cient below 0.95 were discarded. In all experiments, three rebreathing manoeuvres were per-formed at the exercise steady-state. Application of this procedure provided at least two valid _VO2 measure-ments at each power output, which were then averaged. The heart rate was measured continuously by elec-trocardiography. As it did not increase signi®cantly (mean increase 9.7 4.6%) during rebreathing at rest, correction of _VO2 for heart rate changes, as suggested by Kallay et al. (1990), was not performed.
The steady-state gas exchange ratio (R) was calcu-lated from the time course of FO2 and FCO2 at the mouth during regular breathing, by means of the
alve-olar gas equations (Otis 1964). To this purpose, the O2 and CO2traces were recorded between the second and the third rebreathing manoeuvres. End tidal gas frac-tions were assumed to be equivalent to alveolar gas fractions. The average steady-state CO2output ( _VCO2) was calculated by multiplying R times the correspond-ing average value for _VO2.
Experimental design _
VO2, R and _VCO2were determined at rest and during steady-state exercise requiring 50, 75 and 100 W power outputs performed on an electrically braked cycle ergo-meter (Innovision A/S, Odense, Denmark). The subjects were requested to pedal at an fpof 60 min±1. The ergo-meter used during the space ¯ight was identical to that used on Earth. Both were calibrated by the manufacturer prior to the study and were shown to maintain their calibrated power levels for longer than one year. At each power output, rebreathing was performed at 3, 9 and 12 min of exercise. Breath-by-breath O2and CO2 frac-tions were obtained between the ®rst and the second rebreathing. Experiments at 1 g were carried out 172, 116 and 73 days before the ¯ight on both subjects. The same protocol was repeated during a 180-day ¯ight on board the Russian Space Station Mir (0 g, cabin temperature during the ¯ight ranging between 20.6 and 24.5 °C, barometric pressure ranging between 710 and 788 mmHg) on days: 12, 54, 80, 122, 144 and 13, 59, 81, 117, 143 after the launch on subject 1 and 2, respectively. Thus, for each power output, a total of six and ten ob-servations could be performed at 1 g and 0 g, respectively. Statistical analysis
Comparison between data at 1 g and at 0 g was per-formed by the one-tailed unpaired t-test. Comparison of the measured _VO2with the corresponding values pre-dicted from the model was performed by means of one-tailed paired t-test (n 48). The relationship between
_
VO2and power was determined by regression analysis and the comparison between regression lines was per-formed according to Kleinbaum et al. (1988). The comparison of the slope of a regression line with the slope of the identity line was performed as described by Kleinbaum et al. (1988), testing the hypothesis H0: b1 1. Data were considered signi®cantly different when P < 0.05.
RESULTS
The individual values of _VO2and _VCO2are reported in Table 1. The _VO2rates at 0 g appear not to vary with the time of ¯ight. At 0 g, lower _VO2values were found for subject 2 than for subject 1, mostly because of lower resting _VO2in the former. For both subjects, the _VO2s
at 0 g were signi®cantly and systematically lower than at 1 g at all powers. The overall mean differences between the two conditions were 0.105 L min±1 (n 92; P < 0.05) and 0.138 L min±1 (n 92; P < 0.05) for subject 1 and 2, respectively. The differences in _VO2 between 0 and 1 g during exercise were partly owing to a lower resting _VO2in the former than in the latter con-dition. However, also the net (total minus resting) _VO2 values during exercise were smaller at 0 g than at 1 g (0.046 and 0.103 L min±1, average difference for subject 1 and 2, respectively), although this difference was not signi®cant for subject 1.
The R was the same in both conditions (0.92 0.07 and 0.89 0.07 for subject 1, 0.93 0.07 and 0.89 0.05 for subject 2, mean of all determinations at 1 g and 0 g, respectively). As a consequence, _VCO2 turned out to be lower at 0 g than at 1 g, the overall mean difference being 0.140 L min±1 (n 32; P 0.09) and 0.163 L min±1(n 32; P 0.08) for subject 1 and 2, respectively.
The measured _VO2 is plotted in Fig. 1 against the corresponding _VO2values predicted from Eqn 7, after
proper unit conversion. At 1 g, the measured _VO2 appears to be equal to the predicted V_O2 (y 1.013x ± 0.005, R 0.945, equal to the identity line). At 0 g, a positive intercept is observed, the slope being lower than 1 (y 0.819x + 0.146, R 0.968, different from the identity line).
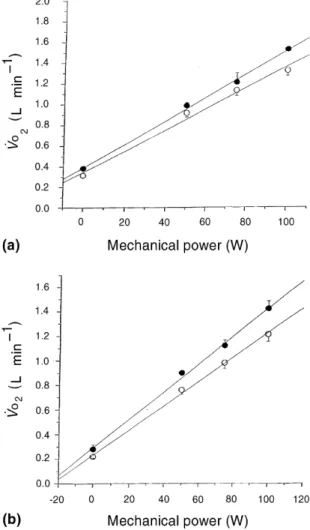
The linear increases of _VO2(L min±1) as a function of mechanical power ( _w;W) are shown in Fig. 2 for
both 0 and 1 g. Regression analysis indicates that: (i) the y-intercept at 0 g (0.349 and 0.235 L min±1) was lower than at 1 g (0.393 and 0.295 L min±1) and (ii) the slope at 0 g was smaller than at 1 g (P < 0.05). The slope of this line is the reciprocal of the Dg of dynamic leg exercise (Gaesser & Brooks 1975). Thus Dg was inev-itably greater at 0 g than at 1 g (28.3 and 29.0% at 0 g in subjects 1 and 2, respectively, to be compared with 25.6 and 25.4% at 1 g, respectively).
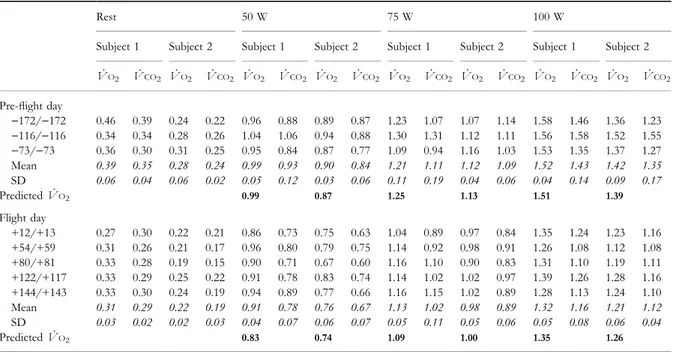
Table 1 Oxygen uptake and carbon dioxide output for the two subjects before and during the space-¯ight
Rest 50 W 75 W 100 W
Subject 1 Subject 2 Subject 1 Subject 2 Subject 1 Subject 2 Subject 1 Subject 2 _ VO2 V_CO2 V_O2 V_CO2 V_O2 V_CO2 V_O2 V_CO2 V_O2 V_CO2 V_O2 V_CO2 V_O2 V_CO2 V_O2 V_CO2 Pre-¯ight day )172/)172 0.46 0.39 0.24 0.22 0.96 0.88 0.89 0.87 1.23 1.07 1.07 1.14 1.58 1.46 1.36 1.23 )116/)116 0.34 0.34 0.28 0.26 1.04 1.06 0.94 0.88 1.30 1.31 1.12 1.11 1.56 1.58 1.52 1.55 )73/)73 0.36 0.30 0.31 0.25 0.95 0.84 0.87 0.77 1.09 0.94 1.16 1.03 1.53 1.35 1.37 1.27 Mean 0.39 0.35 0.28 0.24 0.99 0.93 0.90 0.84 1.21 1.11 1.12 1.09 1.52 1.43 1.42 1.35 SD 0.06 0.04 0.06 0.02 0.05 0.12 0.03 0.06 0.11 0.19 0.04 0.06 0.04 0.14 0.09 0.17 Predicted _VO2 0.99 0.87 1.25 1.13 1.51 1.39 Flight day +12/+13 0.27 0.30 0.22 0.21 0.86 0.73 0.75 0.63 1.04 0.89 0.97 0.84 1.35 1.24 1.23 1.16 +54/+59 0.31 0.26 0.21 0.17 0.96 0.80 0.79 0.75 1.14 0.92 0.98 0.91 1.26 1.08 1.12 1.08 +80/+81 0.33 0.28 0.19 0.15 0.90 0.71 0.67 0.60 1.16 1.10 0.90 0.83 1.31 1.10 1.19 1.11 +122/+117 0.33 0.29 0.25 0.22 0.91 0.78 0.83 0.74 1.14 1.02 1.02 0.97 1.39 1.26 1.28 1.16 +144/+143 0.33 0.30 0.24 0.19 0.94 0.89 0.77 0.66 1.16 1.15 1.02 0.89 1.28 1.13 1.24 1.10 Mean 0.31 0.29 0.22 0.19 0.91 0.78 0.76 0.67 1.13 1.02 0.98 0.89 1.32 1.16 1.21 1.12 SD 0.03 0.02 0.02 0.03 0.04 0.07 0.06 0.07 0.05 0.11 0.05 0.06 0.05 0.08 0.06 0.04 Predicted _VO2 0.83 0.74 1.09 1.00 1.35 1.26
Day 0 is the day of launch. _VO2is oxygen uptake, _VCO2is carbon dioxide output, both given in L min)1. SD is standard deviation. The reported _
VO2values are measured gross _VO2values. Measured resting _VO2values and Eqn 8 have been used to compute the predicted _VO2, reported in bold, for pre¯ight (1 g) and ¯ight (0 g).
Figure 1 A comparison of measured and predicted values of oxygen uptake. Measured oxygen uptake is plotted as a function of predicted oxygen uptake ( _VO2, L min±1). The dashed line is the identity line. Continuous lines are the regression lines for 1 g (g 9.81 m s±2) (d) and 0 g (s). Regression equations are: at 1 g, y 1.013x ± 0.005, R 0.945; at 0 g, y 0.819x + 0.146, r 0.968. The latter equation is signi®cantly different from the identity line.
The individual linear relationships between heart rate and _VO2at 1 and 0 g are reported in Fig. 3. No signi®cant differences between the two tested condi-tions were found for either subject. Extrapolation of the regression lines to the predicted maximal heart rates for the age of each subject allows an estimate of the individual maximal _VO2at 1 and 0 g. Estimated max-imal _VO2 values were 3.11 and 2.87 L min±1for sub-ject 1, and 2.83 and 2.80 L min±1for subject 2, at 1 g and 0 g, respectively. The highest submaximal _VO2 values measured in this study correspond thus to about one half of the individual maximal _VO2.
DISCUSSION
The generalized model describing the factors that affect the rate of energy expenditure during dynamic leg ex-ercise on the cycle ergometer appears to be a valid
predictor of _Eintand of the _VO2changes as a function of agat a given imposed external load. The _VO2values measured in this study correspond to the theoretical values that were obtained from the model. The exception was subject 1 at 0 g, probably because he tended to vary his fpat higher powers, so that his data did not entirely ful®l the constraints of the model for fp 60 min±1. Unfortunately, although the subjects were asked to pedal at fp 60 min±1, fp was not recorded by the operator: this needs to be acknowledged as a limitation of this study. Nevertheless, the hypothesis derived from the generalized model of _Eint, that the
_
VO2during submaximal dynamic exercise on the cycle ergometer at 0 g would be lower than that at the same absolute power at 1 g is supported by the results.
The observation of lower resting _VO2values at 0 g than at 1 g is consistent with a decrease in postural muscle contractions in the former condition (Prisk et al. 1995), but is at variance with the reported ®nding of a higher resting _VO2 from previous space missions (Michel et al. 1977). Clearly enough, this ®nding cannot entirely explain the observed decrease in _VO2 during exercise at 0 g. In fact, in agreement with the data of Michel et al. (1977), net _VO2( _VO2minus resting _VO2) at 0 g is still lower than at 1 g, the difference being signi®cant in subject 2. It has been proposed that the
Figure 2 Oxygen uptake as a function of power. Oxygen uptake ( _VO2, L min±1) as a function of external mechanical power (in W), for subjects 1 (a) and 2 (b). Data are plotted as mean and standard deviation. Filled circles, data at 1 g (g 9.81 m s±2); open circles, data at 0 g. Regression lines at 1 and 0 g were calculated on individual
_ VO2values.
Figure 3 Estimate of maximal oxygen consumption at 0 g. Heart rate as a function of oxygen consumption at 1 g (d) and 0 g (s) for the two subjects who ¯ew for 6 months in the Russian Space Station Mir.
difference between net _VO2at 1 and at 0 g be owing to an increase in the time constant of the _VO2 kinetics caused by microgravity adaptation (Convertino 1996). The results of the present study do not support this hypothesis. If the _VO2 kinetics were slow enough to affect the measured _VO2, the _VO2 values obtained in the three subsequent rebreathing manoeuvres (at min 3, 9 and 12 of exercise) would have increased progres-sively, which was not the case.
The lower net _VO2during submaximal exercise on the cycle ergometer at any given power output at 0 g than at 1 g is rather a consequence of a lower _Eint at 0 g. In fact Eqns 3 and 5 show that _Eint: (i) is a linear function of ag, (ii) is independent of the external me-chanical power, and (iii) at 0 g is equal to 0 W, which implies that it is not affected by the changes in mLthat occur during microgravity exposure (Le Blanc et al. 1995). Incidentally, it is noteworthy that _Eintis directly proportional to mL, which may explain why obese subjects have a higher oxygen cost of cycling at a given work rate than lean individuals (AÊstrand et al. 1960, Anton-Kuchly et al. 1984). At 0 g _Eint 0 W, the difference between the y-intercept of the linear rela-tionship between _VO2 and _w (Fig. 2) at 1 g and the y-intercept of the same relationship at 0 g includes the differences in resting _VO2plus the _Eintat 1 g. Such a difference for subject 2 is remarkably close to the _Eint values that can be estimated from Eqn 5, after cor-recting for the decreased resting _VO2at 0 g.
If indeed _Eint includes all the gravity-dependent components of internal work during dynamic leg exercise on the cycle ergometer, the _VO2 vs. power lines at 1 g and 0 g ought to be parallel, the difference between them being equal to _Eint. However, this is not the case, because the difference between net _VO2at 1 and 0 g ( _VO2, 1 g ± _VO2, 0 g; mL O2min±1) becomes progressively greater as external power is increased (on average 35, 40 and 135 mL O2min±1 at 50, 75 and 100 W, respectively), and the slopes of the lines relating
_
VO2to external power, shown in Fig. 2, are lower at 0 g than at 1 g (greater Dg). The discrepancy between _Eint and _VO2, 1 g ± _VO2, 0 g might be caused by changes in fp. This would also explain the observation that the relationship between measured and predicted _VO2has a slope lower than 1 and a signi®cant positive y-inter-cept (see Fig. 1). In fact subject 1 reportedly tended to increase his fpat increasing power outputs at 0 g.
A progressively greater respiratory work at increas-ing external powers is a possible alternative explanation of this ®nding. Indeed, the _VO2, 1 g ± _VO2, 0 g dif-ference appears compatible with known values of respiratory work during exercise in humans (Cerretelli & di Prampero 1987). However, the hypothesis that respiratory work explains the entire difference between
_
VO2, 1 g ± _VO2, 0 g and _Eint implies that the
respi-ratory work at 0 g be lower than at 1 g at any power output. To our knowledge no data were reported on respiratory work during space ¯ight. Further investi-gations need to be carried out on this subject.
At higher powers than the so-called lactate thresh-old, a steady _VO2level is not always attained, but a slow and continuous increase in _VO2 occurs (Whipp & Wasserman 1972, Linnarsson 1974, Camus et al. 1988). The comparison between measured and theoretical
_
VO2values, as performed in this study, is valid only as far as the exercise _VO2is obtained at external powers below the lactate threshold. This was probably the case for both subjects, as their gas exchange ratio is below 1, and low heart rate values were attained even at the highest _w. Extrapolation of the heart rate vs. _VO2 relationship to the predicted individual maximum sug-gests that (i) the highest investigated _w was approxi-mately one half of the estimated maximum, and (ii) the predicted maximal _VO2at 0 g was similar to that at 1 g. The latter estimate agrees with the few data reported in the literature, showing that the maximal _VO2at 0 g is either increased after a long-term space ¯ight with an intense training regimen (Michel et al. 1977) or un-changed after short-term space ¯ight (Levine et al. 1996). As any given _VO2level is attained at a higher _w at 0 g than at 1 g, unchanged maximal _VO2values imply higher maximal mechanical powers in the former than in the latter condition. Thus, the maximal working capacity should be greater in microgravity than on Earth. The opposite would occur on planets with masses greater than that of the Earth, and not only because of the upward displacement of the _VO2vs. _w relationship at 1 g, but also because the maximal _VO2decreases in the latter condition (Pendergast et al. 1987). Because of exponent 4 for fpin Eqns 4 and 5, the variations of maximal aerobic power as a function of ag would become greater if the frequency of movement is increased. Application of Eqn 7 allows a comparison of the present results with the data obtained at higher g-values in the human centrifuge. During exercise on a cycle ergometer in the centrifuge the difference between
_
VO2 at 3 and 1 g (Bjurstedt et al. 1968, Rosenhamer 1968, Nunneley & Shindell 1975) appears to be very close to that expected from Eqn 3. For instance, Bjurstedt et al. (1968) reported a mean difference (three different power outputs) between net _VO2at 3 and 1 g of about 0.137 L min±1 which is quite similar to that calculated from Eqn 3 (0.134 L min±1) after the inser-tion of appropriate data (fp 60 r.p.m., mL 32.2% of body weight 21.4 kgm). Bjurstedt et al. (1968) attributed this difference to an increased work of respiratory and postural muscles at 3 g. This hypothesis was questioned by Nunneley & Shindell (1975) who suggested that the observed _VO2 difference was too large to be explained by increased respiratory and
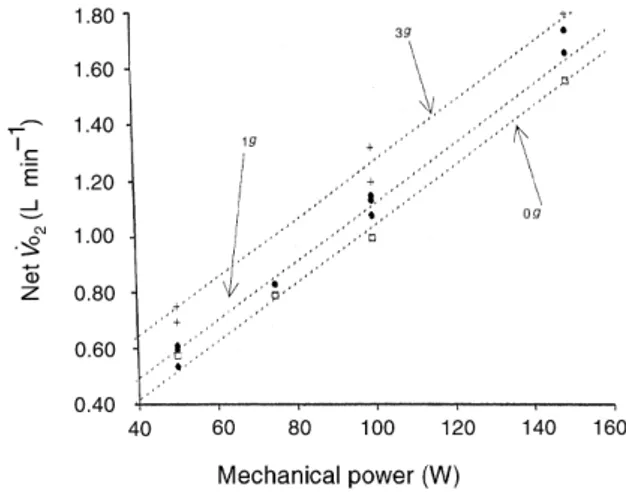
postural work alone. In addition, the data by Bjurstedt et al. (1968) did not show any increase in the _VO2 difference although the difference in ventilation between the 3 g and the 1 g condition became progres-sively larger. Using the mLof subject 1 and assuming a constant fp value of 60 r.p.m., we were able to plot (Fig. 3) the relationship between _VO2 and _w for dif-ferent values of ag from Eqn 7. In Fig. 4, the experi-mental values measured by others (Rosenhamer 1968, Bjurstedt et al. 1968, Nunneley & Shindell 1975) as well as in the present study are also reported. Differences in fp and in mL may account for the error between ex-perimental and theoretical data. The results of Fig. 3 justify the contention that changes in _Eintexplain the
_
VO2 differences at any given _w between 0, 1 and 3 g. The results of this study do not allow refutation of the hypothesis that the _VO2during dynamic leg exercise on a cycle ergometer depends on ag.
The experiments described in this study were part of the EUROMIR 95 long-term space mission, jointly organized by the European Space Agency and the Russian Space Agency. The experiments on Earth were carried out at the European Astronaut Centre, Cologne, Germany. The experiments in microgravity were carried out in the Russian Space Station Mir. The study was supported by the European Space Agency, the Federal Swiss Prodex Fund (grant n°142967), the National Swedish Space Board of the Swedish Medical Research Council (grant n°5020), and the National Aeronautics and Space Administration, USA (grant n° NAGW 3937). The European Space Agency also provided technical support to the experiment. The excellent collaboration obtained from the prime and back-up crew of EUROMIR 95 is acknowledged.
REFERENCES
Anton-Kuchly, B., Roger, P. & VareÁne, P. 1984. Determinants of increased energy cost of submaximal exercise in obese subjects. J Appl Physiol 56, 18±23.
AÊstrand, I., AÊstrand, P.O. & Stunkard, A. 1960. Oxygen intake of obese individuals during work on a bicycle ergometer. Acta Physiol Scand 50, 294±299.
Banister, E.W. & Jackson, R.C. 1967. The effect of speed and load changes on oxygen intake for equivalent power output during bicycle ergometry. Int Z Angew Physiol 24, 284±290.
Bjurstedt, H., Rosenhamer, G. & Wigertz, O. 1968. High-G environment and response to graded exercise. J Appl Physiol 25, 713±719.
Camus, G., Atchou, G., BruÈckner, J.C., Giezendanner, D. & di Prampero, P.E. 1988. Slow upward drift of _VO2during
constant-load cycling in untrained subjects. Eur J Appl Physiol 58, 197±202.
Cerretelli, P. & di Prampero, P.E. 1987. Gas exchange in exercise. In: L.E. Farhi & S.M. Tenney (eds) Handbook of Physiology. The Respiratory System. Gas Exchange, Sect. 3, Vol. IV, pp. 297±339. American Physiological Society, Bethesda MD, USA.
Convertino, V.A. 1996. Exercise and adaptation to microgravity environments. In: M.J. Fregly & C.M. Blatteis (eds) Handbook of Physiology. Environmental Physiology, Vol. II, pp. 815±843. Oxford University Press, New York.
Cotes, J.E. 1969. Relationships of oxygen consumption, ventilation and cardiac frequency to body weight during standardized submaximal exercise in normal subjects. Ergonomics 12, 415±427.
Dickinson, S. 1929. The ef®ciency of bicycle pedalling as affected by speed and load. J Physiol Lond 67, 242±255. di Prampero, P.E., Cortili, G., Mognoni, P. & Saibene, F. 1979. Equation of motion of a cyclist. J Appl Physiol 47, 201±206.
Francescato, M.P., Girardis, M. & di Prampero, P.E. 1995. Oxygen cost of internal work during cycling. Eur J Appl Physiol 72, 51±57.
Gaesser, G.A. & Brooks, G.A. 1975. Muscular ef®ciency during steady-rate exercise: effects of speed and work rate. J Appl Physiol 38, 1132±1139.
Garry, R.C. & Wishart, G.M. 1931. On the existence of a most ef®cient speed in bicycle pedalling, and the problem of determining human muscular ef®ciency. J Physiol Lond 72, 426±437.
Henry, F.M. & De Moor, J. 1950. Metabolic ef®ciency of exercise in relation to work load at constant speed. J Appl Physiol 2, 481±487.
Kallay, M.C., Hyde, R.W. & Smith, R.J. 1990. Assessment of rebreathing O2consumption in humans with normal and
diseased lungs. J Appl Physiol 68, 1443±1452.
Kamon, E., Metz, K.F. & Pandolf, K.B. 1973. Climbing and cycling with additional weights on the extremities. J Appl Physiol 35, 367±370.
Kaneko, M. & Yamazaki, T. 1978. Internal mechanical work due to velocity changes of the limb in working on a bicycle ergometer. In: E. Asmussen & K. Jorgensen (eds) Biomechanics VI-A, pp. 86±92. University Park Press, Baltimore, MD, USA.
Kleinbaum, D.G., Kupper, L.L. & Muller, K.E. 1988. Applied Regression Analysis and Other Multivariate Methods. PWS-Kent, Boston.
Figure 4 Effect of gravity acceleration on oxygen uptake during exercise. Net oxygen uptake (net _VO2) as a function of mechanical power as from Eqn 8 at varying gravity acceleration (0, 1, 3 g; g 9.81 m s±2, ...). +, data at 3 g (from Bjurstedt et al. 1968); d, data at 1 g (present study, and from Bjurstedt et al. 1968, Michel et al. 1977); h, data at 0 g (present study, and from Michel et al. 1977).
Le Blanc, A., Rowe, R., Schneider, V., Evans, H. & Hedrick, T. 1995. Regional muscle loss after short duration space¯ight. Aviat Space Environ Med 66, 1151±1154.
Levine, B.D., Lane, L.D., Watenpaugh, D.E., Gaffney, F.A., Buckey, J.C. & Blomqvist, C.G. 1996. Maximal exercise performance after adaptation to microgravity. J Appl Physiol 81, 686±694.
Linnarsson, D. 1974. Dynamics of pulmonary gas exchange and heart rate changes at start and end of exercise. Acta Physiol Scand 425 (Suppl), 1±68.
Luhtanen, P., Rahkila, P., Rusko, H. & Viitasalo, J.T. 1987. Mechanical work and ef®ciency in ergometer bicycling at aerobic and anaerobic thresholds. Acta Physiol Scand 131, 331±337.
Michel, E.L., Rummel, J.A., Sawin, C.F., Buderer, M.C. & Lem, J.D. 1977. Results of Skylab medical experiment M171. Metabolic activity. In: S. Johnson & L.F. Dietlein (eds) Biomedical Results from Skylab, pp. 372±387. National Aeronautics and Space Administration, Washington, DC. Nunneley, S.A. & Shindell, D.S. 1975. Cardiopulmonary
effects of combined exercise and +Gz acceleration. Aviat Space Environ Med 46, 878±882.
Otis, A.B. 1964. Quantitative relationship in steady-state gas exchange. In: W.O. Fenn & H. Rahn (eds) Handbook of Physiology. Respiration, Sect. 3, Vol. I, pp. 681±698. American Physiological Society, Washington, DC.
Pendergast, R.D., Olszowka, A.J., Rokitka, M.A. & Farhi, L.E. 1987. Gravitational force and cardiovascular system. In: P. Dejours (ed.) Comparative Physiology of Environmental Adaptations, pp. 15±26. Karger, Basel, Switzerland. Prisk, G.K., Elliott, A.R., Guy, H.J.B., Kosonen, J.M. & West,
J.B. 1995. Pulmonary gas exchange and its determinants during sustained microgravity on Spacelabs SLS-1 and SLS-2. J Appl Physiol 79, 1290±1298.
Rosenhamer, G. 1968. In¯uence of increased gravitational stress on the adaptation of cardiovascular and
pulmonary function to exercise. Acta Physiol Scand 276 (Suppl), 1±61.
Wells, R., Morrissey, M. & Hughson, R. 1986. Internal work and physiological responses during concentric and eccentric cycle ergometry. Eur J Appl Physiol 55, 295±301. Whipp, B.J. & Wasserman, K. 1969. Ef®ciency of muscular
work. J Appl Physiol 26, 644±648.
Whipp, B.J. & Wasserman, K. 1972. Oxygen uptake kinetics for various intensities of constant-load work. J Appl Physiol 33, 351±356.
Widrick, J.J., Freedson, P.S. & Hamill, J. 1992. Effect of internal work on the calculation of optimal pedalling rates. Med Sci Sports Exerc 24, 376±382.
Winter, D.A. 1979. Biomechanics of Human Movement. Wiley, New York.