UNIVERSITY OF BRESCIA
Department of Molecular and Translational Medicine
Corso di Dottorato di Ricerca in
Scienze Biomediche e Medicina Traslazionale
BIO/14
Cycle XXXIII
Estrogen and Progesterone receptors in experimental cell models of
human adrenocortical cancer: interaction between tamoxifen and
progesterone
PhD Student
Elisa Rossini
Supervisor
2
Index
Abstract (Italian version)………... 4
Abstract (English version)………. 7
1. Introduction………...9
1.1The adrenal gland………. 9
1.2 Physiology of the adrenal gland………. 11
1.2.1 Mineralcorticoid secretion: the renin-angiotensin-aldosterone axis……….. 13
1.2.2 Glucocorticoids secretion: the hypotalamus-pituitary-adrenal axis (HPA) axis... 13
1.2.3 Adrenal androgens secretion………. 13
1.3 Adrenocortical Carcinoma………. 14
1.3.1 General characteristics, epidemiology and pathogenesis………. 14
1.3.2 Diagnosis……….. 15
1.3.3 Therapy……….… 16
1.4 Hormonal approach in ACC therapy.……… 17
1.4.1 Estrogens in ACC……….. 17
1.4.2 Progesterone role in ACC……….. 19
2. Aim of the study………. 26
3. Material and methods……… 27
3.1 ACC cell lines and primary cultures……… 27
3.2 Immunohistochemistry……… 27
3.3 Immunofluorescence……… 31
3
3.5 Measurement of cell viability and proliferation………... 32
3.6 Drug combination experiments……… 33
3.7 Quantitative RT-PCT (q-RT-PCR)……….. 33
3.8 miRNA analysis………... 34
3.9 Western blot………. 34
3.10 17β-Estradiol measurement using ELISA assay………... 35
3.11 Statistical analysis………. 35
4. Results………. 36
4.1 Estrogens in the ACC cell models……….. 36
4.1.1 Tamoxifen induced ER-β nuclear translocation in NCI-H295R cell line…….. 40
4.2 Pg in the ACC cell models……….. 42
4.3 Effect of drug combined treatment on ACC cell viability……….. 45
4.4 Pg and tamoxifen reduced SF-1 expression in NCI-H295R cells………... 48
4.5 PgR and ER expression in ACC tissues……….. 50
5. Discussion……….... 53
4
Abstract (Italian version)
I recettori del progesterone (PgR) e i recettori degli estrogeni (ER) sono espressi con diversa intensità sia nella corteccia surrenalica sana che neoplastica, ma attualmente il loro ruolo nella regolazione della proliferazione delle cellule della corticale del surrene non è ancora completamente conosciuto. I risultati precedentemente pubblicati dal nostro gruppo di ricerca hanno dimostrato che il progesterone (Pg) ha un marcato effetto citotossico sulle cellule del Carcinoma AdrenoCorticale (ACC), mentre il tamoxifene ha effetto citotossico in vitro sul modello sperimentale NCI-H295R. In questo lavoro abbiamo studiato l’espressione del PgR e dei ER in una coorte di pazienti con diagnosi di ACC e l’attività del tamoxifene sia come singola terapia che in combinazione con Pg/mitotano in modelli sperimentali di cellule di ACC, sia primitivi che metastatici.
I modelli sperimentali utilizzati sono stati le due line cellulari NCI-H295R e MUC-1 e la cultura primaria ACC115m. I tessuti tumorali dei pazienti con diagnosi di ACC (n=35) sono stati inclusi in paraffina ed analizzati per lo studio dell'espressione dei recettori. L'espressione di ER e PgR è stata studiata mediante immunoistochimica (IHC), immunofluorescenza (IF) e q-RT-PCR. La misurazione dell'estradiolo è stata eseguita tramite saggio ELISA indiretto. La vitalità e la proliferazione cellulare sono state valutate rispettivamente mediante MTT e conta cellulare con discriminazione Trypan Blue. Gli esperimenti di combinazione sono stati condotti seguendo il metodo di Chou-Talalay. L'espressione del Fattore Steroidogenico 1 (SF-1) è stata studiata mediante q-RT-PCR e western blot. L’estrazione dei miRNA e la retrotrascrizione sono state eseguite utilizzando rispettivamente il miRNeasy kit (Qiagen, Milan, Italy) e il miScript II RT kit (Qiagen). Successivamente, la variazione dei livelli di miRNA è stata analizzata mediante q-RT-PCR.
L'analisi in IF condotta sui modelli cellulari di ACC ha rivelato l'espressione di entrambi i sottotipi ER nella linea cellulare NCI-H295R, con una prevalenza di ER-β rispetto ad ER-α. Al contrario, i modelli cellulari metastatici rappresentati dalla linea cellulare MUC-1 e dalla
5
coltura primaria ACC115m hanno mostrato un'espressione molto debole per entrambi i sottotipi recettoriali, sia a livello genico che proteico. Per quanto riguarda l’espressione di PgR, è stato rilevato nella linea cellulare NCI-H295R, ma risulta essere poco espresso nei modelli di ACC metastatici. Il trattamento delle cellule con tamoxifene e con Pg ha indotto citotossicità in modo concentrazione-dipendente ed allo stesso modo si è verificata una riduzione del tasso di proliferazione cellulare, in particolare nelle cellule NCI-H295R, che si sono mostrate più sensibili al tamoxifene rispetto alla linea cellulare metastatica MUC-1 ed alla coltura primaria metastatica ACC115m, in accordo con la diversa espressione recettoriale, anche se non si può escludere la presenza di alterazioni di vie intracellulari target dell’azione di PgR e ER nella progressione tumorale. Quando le cellule NCI-H295R sono state esposte al tamoxifene in combinazione con il Pg, non è stato osservato alcun effetto sinergico. Inoltre, combinando il mitotano con il tamoxifene, abbiamo osservato un effetto additivo a concentrazioni di farmaco molto basse, con una percentuale di effetto citotossico fra il 10 ed il 18%, mentre l’effetto diventa antagonista con combinazioni di concentrazioni più alte. La citotossicità indotta dai due farmaci nella linea cellulare NCI-H295R potrebbe essere mediata dalla riduzione dell'espressione proteica del Fattore Steroidogenico 1 (SF-1), che controlla la steroidogenesi surrenalica, senza alcun cambiamento nei livelli di mRNA. Ciò potrebbe essere spiegato dal significativo aumento nell'espressione dei miRNA23 a/b. Non sono state invece osservate variazioni significative dell'espressione di SF-1 nella linea cellulare metastatica MUC-1. Infine, l’analisi IHC ha rilevato bassi livelli di ER nei campioni tissutali di ACC, mentre il PgR è risultato espresso in modo eterogeneo, confermando così quanto osservato nei modelli sperimentali in vitro.
Questi risultati ci permettono di concludere che PgR ed ER sembrano avere un ruolo nella vitalità e nella proliferazione delle cellule di ACC. In particolare i nostri precedenti risultati sull'effetto citotossico in vitro del Pg, sono stati confermati anche in modelli cellulari di ACC metastatici. Per quanto riguarda gli estrogeni, la stimolazione di ER-β sembra indurre un effetto
6
citotossico. Il meccanismo con il quale il tamoxifene esercita l'effetto citotossico è ancora oggetto di indagine e si potrebbe ipotizzare che il tamoxifene possa mediare la sua attività citotossica agendo come agonista per ER-β. In seconda ipotesi, il tamoxifene potrebbe esercitare il suo effetto citotossico agendo come antagonista su ER-α, lasciando quindi il β-estradiolo endogeno in grado di legarsi selettivamente ad ER-β, che agisce come un soppressore tumorale in una varietà di tessuti. Inoltre, non si può escludere un effetto non genomico del tamoxifene.
Per quanto riguarda gli esperimenti di combinazione farmacologica, i nostri risultati in vitro non hanno mostrato un vantaggio nella combinazione del tamoxifene con Pg o mitotano. Dopo il trattamento con entrambi Pg e tamoxifene abbiamo osservato una riduzione dell'espressione di SF-1, che sembra essere mediata dai miRNA 23 a/b.
7
Abstract (English version)
Progesterone (Pg) and estrogen (E) receptors (PgR and ER) are expressed at different intensity in both normal and neoplastic adrenal cortex, but their role in the physiological regulation of adrenal cell proliferation is not yet fully understood. Previous results obtained by our research group demonstrated that Pg has a marked cytotoxic activity on AdrenoCortical Carcinoma (ACC) cells; while tamoxifen is cytotoxic in NCI-H295R experimental cells model. Here we investigated the PgR and ER expression in a cohort of ACC patients, and the in vitro activity of tamoxifen as a single treatment or in combination with Pg/mitotane on viability of different ACC cell models, primitive or metastatic.
NCI-H295R, MUC-1 cell lines and the ACC115m primary cell culture were used as experimental models. Paraffin-embedded ACC samples (n=35) were included for the receptor expression study. ER and PgR expression was studied by immunohistochemistry (IHC), immunofluorescence (IF) and q-RT-PCR. Estradiol measurement was done by indirect ELISA assay. Cell viability and proliferation was evaluated by MTT and direct cell counting, with Trypan Blue discrimination. Combination experiments were conducted with Chou-Talalay method. Steroidogenic Factor 1 (SF-1) expression was investigated by q-RT-PCR and western blot. The miRNA experiments were conducted following the manufacturer instructions and analyzed by q-RT-PCR.
IF analysis on ACC cell models revealed both ER subtypes expression in NCI-H295R, with a prevalence of ER-β over the ER-α. On the contrary, metastasis-derived MUC-1 cell line and ACC115m primary culture, displayed a very weak expression of ER-α and ER-β both at gene and protein level. Concerning PgR, it was expressed in NCI-H295R cells and the signal fails in metastatic ACC cell models. Exposure of ACC cells to tamoxifen and to Pg induced cytotoxicity and a reduction in the cell proliferation rate in a concentration-dependent manner. In particular NCI-H295R cells were more sensitive to tamoxifen compared to metastatic MUC-1 cell line and ACCMUC-1MUC-15m primary culture, according to the different receptors expression; even
8
if altered intracellular pathways target of PgR and ER in tumor progression cannot be excluded. When NCI-H295R cells were exposed to the Pg/tamoxifen combination, no synergic effect was observed. Again, combining mitotane and tamoxifen, we observed an additive effect at very low drug concentrations, while the effect became antagonist combining higher concentrations of drugs. NCI-H295R induced cytotoxicity could be mediated by the reduction of SF-1 protein expression, whit no change in the mRNA. This could be explained by the significant increase in miRNA23a/b expression. Instead, no significant variations of SF-1 protein expression were observed in metastatic MUC-1 cell line. Finally, IHC detected low levels of ERs in ACC samples, while PgR was heterogeneously expressed, thus confirmed the results obtained in the
in vitro experimental models.
These results allow us to conclude that PgR and ER seemed to play a role in ACC cell viability and cell proliferation. In particular our previous results on Pg cytotoxic effect in ACC was confirmed also in metastatic cell models. Concerning estrogens, ER-β stimulation mediated a cytotoxic effect in ACC cells. The mechanism by which tamoxifen exert the cytotoxic effect is still under investigation and it could be hypothesized that tamoxifen could mediate its cytotoxic activity by acting as an agonist for ER-β. On the other hand, tamoxifen could exert this effect as ER-α antagonist, leaving β-estradiol able to selective bind ER-β, that acts as a tumor suppressor in a variety of tissues. Furthermore, a non-genomic effect of tamoxifen cannot be excluded. Regarding combined experiments, our in vitro results did not indicate an advantage in combining tamoxifen with Pg or mitotane in ACC experimental cell models. After both Pg and tamoxifen treatment we observed a reduction of SF-1 expression, that seems to be mediated by miRNA23a/b.
9
1. Introduction
1.1. The adrenal gland
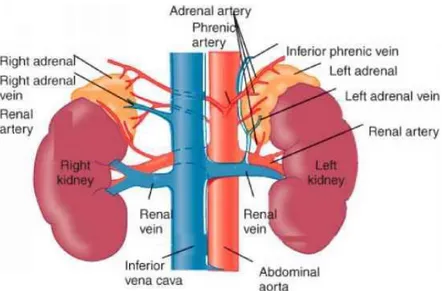
The adrenal glands are retroperitoneal endocrine structures, localized on the apical pole of each kidney. These are triangular, golden-yellow glands, and their weight is about 6 - 11 grams each. They are surrounded by perirenal adipose tissue, separated from the underlying kidney by a fibrous tissue. Small accessory glands, consisting mainly of cortical tissue called cortical
bodies, can occur in the areolar tissue near the major adrenal glands. The adrenal glands are
richly vascularized in relation to their size.
Figure 1. Anatomy of human adrenal gland
(Mitch Medical Healthcare - Physiology, anatomy and biochemistry of the adrenal gland)
Indeed, each gland is supplied by the upper, middle and lower adrenal artery, whose main branches can be double or multiple (Fig. 1). The external connective tissue capsule is richly vascularized, forming the so-called subcapsular plexus [1].
Small lymphatic channels from both the medulla and the cortex drain at hilum level, from which lymphatic vessels emerge directly to the lateral groups of the para-aortic lymph nodes.
10
The adrenal gland presents abundant autonomous innervation. Both the cortical and medullary fibers contain acetylcholinesterase (AChE) -positive axons, which appear to originate from the celiac plexus.
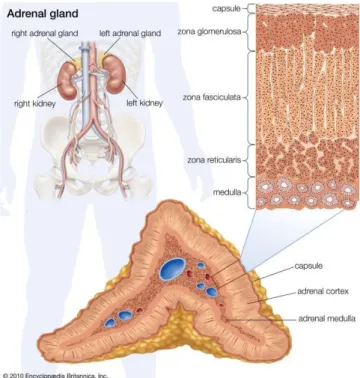
In section, the adrenal gland shows an external yellow, cortical zone, which forms the main mass, and a dark red medullary zone [1]. Functionally, each gland can be divided into an external portion called cortical and an internal, the medulla, different for histology, embryonic derivation and hormone production (Fig. 2).
Figure 2. Histology of human adrenal gland
(Encyclopædia Britannica, Inc. 2010)
The cortical zone arises from mesodermal cells, in proximity of the cranial pole of the kidney. These cells form the endocrine cell cords, which differentiate into steroidogenic cells. In the adult, the adrenal cortex is centripetally divided in zona glomerulosa (ZG), zona fasciculata (ZF) and zona reticularis (ZR), that produce, respectively, mineralocorticoids (aldosterone), glucocorticoids (cortisol) and adrenal androgens (DHEA and derivatives) [2].
11
The ZG, below the capsule, consists of small polyhedral cells arranged in spheroid groups. The ZF is intermediate zone and it consists of polyhedral sorted cells. The ZR, in the innermost section, contains an irregular network of rounded cord cells (Fig. 2).
The internal medullary portion arises from the neuroectodermal tissue, in particular from chromaffin cells (pheochromocytes). These cells, innervated by cholinergic preganglionic sympathetic neurons, synthesize adrenaline [2].
1.2 Physiology of the adrenal gland
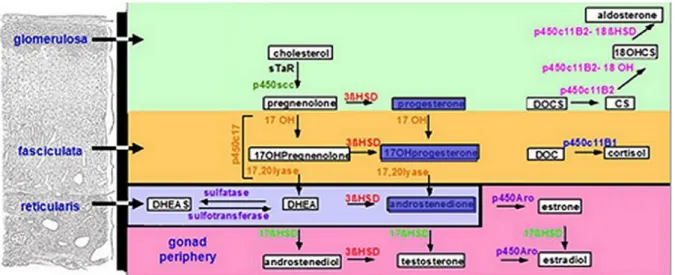
The function of the adrenal gland is to produce steroid hormones. Three main types of hormones are produced: mineralocorticoids (aldosterone, deoxycorticosterone), glucocorticoids (cortisol, corticosterone) and androgens (sex steroids). The steroidogenesis is the dynamic biochemical process by which the precursor cholesterol is converted to biologically active steroid hormones (Fig. 3).
Figure 3. Human adrenal steroidogenesis
(Gary D. Hammer. Adrenal Physiology & Steroid Pharmacology. University of Michigan – Open Michigan)
The human adrenal synthesizes cholesterol in two different ways: de novo from acetate, or from LDL derived from dietary. ACTH (AdrenoCorticoTrophin Hormone) adrenal gland stimulation
12
is essential for the adrenal steroidogenesis and it is activated by the hypothalamus-pituitary-adrenal (HPA) axis (Fig. 4).
Figure 4. HPA axis
(Gary D. Hammer. Adrenal Physiology & Steroid Pharmacology. University of Michigan – Open Michigan)
CRH (Corticotropin-Releasing Hormone) hypothalamic secretion, and the consequent ACTH secretion at pituitary gland level, follow a circadian rhythm, under the control of the suprachiasmatic nucleus of the hypothalamus. The MC2R receptor (MelanoCortin 2 Receptor), interacting with MRAP (Melanocortin 2 Receptor Accessory Protein), creates a complex, carried to the adrenal cortex membrane and binding the circulating ACTH. ACTH stimulation results in 3'-5'-cyclic adenosine monophosphate (cAMP) production, which activates the protein-kinase A, that in turn promotes the displacement of cholesterol from external mitochondrial membrane (OMM) to the inner mitochondrial membrane (IMM) by Steroidogenic Acute Regulatory protein (StAR). Here, the CYP11A1 and p450scc enzyme convert cholesterol to pregnenolone, which is the precursor for all steroids [3].
13
1.2.1. Mineralcorticoid secretion: the renin-angiotensin-aldosterone axis
Aldosterone is the primary mineralocorticoid produced by ZG cells under the angiotensin II control, potassium and, to a lesser extent, ACTH. The secretion of aldosterone is restricted to the glomerulosa cells due to the specific presence of the enzyme aldosterone synthase, CYP11B2 [4]. Mineralcorticoids synthesis requires the action of three enzymes: 3 – β
hydroxysteroid dehydrogenase type 2 (HSD3B2) also known as delta Δ5-4-isomerase, which catalyzes the oxidative conversion of Δ5-3β-hydroxysteroids to the Δ4-3-keto configuration;
2,21-hydroxylase (CYP21A2, P450c21) which converts progesterone in 11-desossicosticosterone and aldosterone synthetase (CYP11B2, P450c11AS) which catalyzes the final three steps of aldosterone synthesis.
1.2.2. Glucocorticoids secretion: the hypotalamus-pituitary-adrenal axis (HPA) axis
In humans, the main glucocorticoid produced by ZF is cortisol and its production is under ACTH control. Pregnenolone could be converted in progesterone, by HSD3B2; or in its hydroxylated form by CYP17A1. Both these products are converted in 17OH- progesterone that became substrate of CYP21A2, leading to 11-deoxicortisol synthesis.
Finally, the 11β-hydroxylase (CYP11B1, P450c11β), an enzyme closely related to CYP11B2, completes the cortisol synthesis.
1.2.3. Adrenal androgens secretion
The synthesis of adrenal androgens occurs at ZR level. Dehydroepiandrosterone (DHEA) and its sulfated form (DHEAS) are the two more abundant adrenal steroids. The CYP17A1 is the only enzyme necessary for the DHEA and androstenedione synthesis starting from, respectively, pregnenolone and progesterone. Although the CYP17A1 is present in both ZF and ZR, its 17,20-lyase reaction is enhanced about 10 times in ZR from the cytochrome b5 cofactor (CYB5A), which is absent in ZF [5].
14
1.3 Adrenocortical Carcinoma
1.3.1. General characteristics, epidemiology and pathogenesis
AdrenoCortical Carcinoma (ACC) is a rare cancer with an estimated incidence of 0.7 to 2.0 persons per million populations/year in adulthood and 0.2 - 0.3 new cases per million populations/ year in pediatric age [6,7]. It is a highly malignant tumor, showing in most cases an excess of steroid hormone production. ACC presents a wide inter-individual variability in biological features and clinical behavior [6].
ACC can potentially develop at any age, but has two peaks of incidence at the first decade of life and between 40 and 60 years [8]. It is more prevalent in female. It is more frequent as a sporadic form, especially as adrenal incidentaloma [9]. The prevalence of adrenal incidentaloma increases with age, ranging from 1% around 40 years of age up to 7% for people around 70s. However, a cohort study indicated that 50 to 75% of the adrenal incidentalomas had a metastatic localization [10].
Although mainly sporadic, it may occur in association with hereditary syndromes such as Lynch syndrome (with gene mutations in MLH1, MHS2, MHS6, EPCAM and PMS2), Li-Fraumeni syndrome (with TP53 mutation), multiple endocrine neoplasm (MEN 1, MEN 2 with RET gene mutation), familial adenomatous polyposis (FAP, with TP53 mutation) and Beckwith-Wiedemann syndrome (with constitutional increase in IGF2).
ACC presents mutations in TP53 in about 33% of cases. This mutation appears to be characterized by a peculiar allelic loss at the 17p13 locus, found in 85% of ACC [11]. Furthermore, transcriptome analysis revealed that IGF-II (locus 11p15) is overexpressed in 90% of ACC and that, approximately 33% of ACC presents activating somatic mutations of the β-catenin gene [11].
Patients with functioning ACC (about 60% of cases [6]), show symptoms of an excess of hormone production. In non-functioning tumors, prevalent symptoms are associated with the
15
presence of an abdominal mass, with a generalized malaise; abdominal pain, sense of fullness, nausea, constipation, fatigue, paraneoplastic fever were detected [12].
Secretory ACC can cause a variety of different symptoms depending on the type of hormone(s) secreted. However, often ACC patients produce excess hormones that is not clinically evident, due to an inefficient production of steroids by the adrenal tumor cells.
Clinically, the adrenal hyperfunction syndromes are represented by hypercortisolism, with Cushing's syndrome (50 to 60 % of the secreting forms), hypersecretion of sex hormones, with virilization for women with hyperandrogenism (20-30% of the secreting forms) and feminization for men with hyperestrogenism (5% of the secreting forms) and finally primary hyperaldosteronism, with Conn syndrome (present in less than 2-3% of the secreting forms) [6]. Hypercortisolism should be underlined, due to its immunosuppressive effect that could promote tumor progression [13,14].
ACC often spreads to the retroperitoneum and infiltrates the kidney. Bloodstream metastases are the main ones, being present at the time of diagnosis in approximately half of the cases [15]. The most common sites of metastasis are the kidney (60%), regional lymph nodes (40%), lungs (40%), surface peritoneal and, more rarely, bone [16]. Poorly differentiated ACCs tend to metastasize to the skin as well [17].
1.3.2. Diagnosis
The European Network for the Study of Adrenal Tumors (ENS@T) suggests a preoperative hormonal workup for suspected ACC [6]. In particular, the evaluation of glucocorticoids (basal cortisol, ACTH), sex steroids and precursors (DHEAS, 17-hydroxyprogesterone, testosterone, AD, 17-β estradiol), as well as mineralocorticoids (potassium, aldosterone / renin ratio) is recommended. Compared to normal adrenal cortex, the synthesis of steroid hormones in ACC is relatively inefficient, resulting in elevated levels of steroid hormone precursors. Although most of these metabolites are not routinely measured, they can be detected by gas chromatography / mass spectrometry [18].
16
In general, most ACCs are large, heterogeneous with irregular margins and masses may be associated with necrosis, or hemorrhage calcification. Regarding imaging investigations, TC is recommended followed by nuclear magnetic resonance (RMN) and 18F - fluoro deoxy glucose-PET (FDG-glucose-PET) [19]. Finally, in recent years, a new tracer, metomidate, has been introduced to demonstrate adrenocortical origin as it binds specifically to CYP11B enzymes, which catalyze the final stages of steroid synthesis [20].
Fine needle aspiration (FNA) or biopsy is not indicated due to the difficulty of differentiating between benign and malignant lesions and the hemorrhagic risk and in particular, for the risk of dissemination [6]. Evaluation of the pathological anatomy is the key for the final diagnosis of ACC [21]. The determination of the expression of the steroidogenic factor 1 (SF-1) is proved to be the most valid marker [22], with a sensitivity of 89% and a specificity of 100% [23]. Other possible markers can be used for diagnostic purposes, namely α-inhibin, melan-A and calretinin [24, 25]. The histopathology classification refers to the Weiss score, which still remains the best validated score [26].
1.3.3. Therapy
Currently the only curative therapeutic approach for ACC is complete resection. ENS@T suggests two different therapeutic approaches depending on whether it is a resectable ACC or not [6]. The ACC guidelines recommend resection "en bloc", thus open surgery is the standard surgical approach for confirmed or highly suspected ACC. Adrenal surgery should only be performed in centers that have at least 10 adrenalectomies/year [27]. However, for tumors < 6 cm with no evidence of local invasion, laparoscopic adrenalectomy is reasonable if the surgeon has sufficient experience in this method [6].
On the other hand, in case of non-resectable advanced ACC the adjuvant therapy aims to control symptoms and prolongation of life [6]. Patients with advanced or metastatic ACC have a poor prognosis, with a 5-years average survival less than 15%. However, there is a great heterogeneity in the outcome of this category of patients [28]. In presence of extra abdominal
17
limited metastases, the resection of the primary ACC must take place in association with therapies aimed at long-term control of metastases. Other local therapies such as radiotherapy, radiofrequency ablation or chemoembolization can be useful as a therapeutic contribution [6]. The Hyperthermic Intraperitoneal Chemotherapy (HIPEC) value in the management of relapses is therefore less appreciable, however its use deserves attention as it can positively influence the oncological outcomes [29]. Furthermore, in advanced and unresectable cancers, the use of mitotane alone or in combination with etoposide-doxorubicin-cisplatin (EDP-M) is recommended according to the main prognostic parameters such as Ki-67 > 10%, tumor mass and uncontrolled symptoms. EDP-M scheme gives better results than single chemotherapy [30] due to a synergy of the two strategies. In fact, mitotane inhibits in vitro multidrugresistance 1 (MDR1) protein, improving the effectiveness of chemotherapy [31]. In case of progression, mitotane monotherapy is switched to the EDP/M scheme or to the use of other therapeutic options such as gemcitabine plus capecitabine or streptozocin plus mitotane [6].
1.4 Hormonal approach in ACC therapy: focus on sex hormones
One of the factors influencing the clinical phenotype of ACC patients is the functional activity of the tumor, which may result in different endocrine syndromes [32]. Manifestations of adrenal steroids hormone excess represent the most common presentation of ACC in up to 60% of cases [33].
1.4.1 Estrogens role in ACC
Estrogens (E) influence growth, function and tumorigesis in hormone-dependent tissues such as mammary gland, ovary and uterus in female and testis, prostate gland in male [34], but it remains to be elucidated their influence in adrenocortical growth and function of the adult, as well as in the tumorigenesis. To suggest the possible involvement of E in adrenocortical tumor development there is the clinical observation that ACC is more prevalent, up to 60%, in women compared to men [6]. Again, functioning ACC seems to be significantly more frequent in women, while non-functioning carcinomas are more frequent in males [35]. Moreover a
case-18
control study demonstrated that use of estro-progestins was a risk-factor for the development of adrenocortical carcinomas [36]. Furthermore, it cannot be exclude a specific effect of pregnancy on ACC. Concerning this aspect, very few studies have been conducted, for instance Abiven-Lepage et al. conducted a retrospective study on 110 female patients, twelve of them were pregnant or in the first 6 months after delivery [37]. Among pregnant patients, 66% were ACC diagnosed (III, IV Ens@t stage) against 39% in non-pregnant women. In pregnant females, one-year survival rate was 50%, three-years 28%, five-years 13% and 0% at 8 years; significantly worse than in the non-pregnancy group. Thus, it could be concluded that pregnancy was associated with a shorter survival (P = 0.013) and a shorter disease-free survival compared to control group, although this last difference was not statistically significant. This is also due to the difficulty in the diagnosis, since pregnant hormones mask ACC. Furthermore it has been suggested that cortisol hypersecretion due to pregnancy is associated with a worse prognosis [38].
On the other hand, de Corbière et al. conducted a retrospective multicenter observational analysis on 270 women of ENS@T database [39]. Unlike the previous study, they included 17 women becoming pregnant during the follow up. They observed that the occurrence of a pregnancy was not associated with a shorter survival, but only 1 woman with pregnancy died during the follow-up period, compared with 8 women in the control group. Disease-free survival tends also to be shorter in the 34 control patients without pregnancy than in the 17 patients with pregnancy, although the difference was not significant either. The median recurrence-free survival could not be estimated, because less than half of the patients in both groups experienced a relapse.
It has been largely demonstrated that the effects of E on target tissues are mediated by the two isoforms of Estrogen Receptor (ER): α and β, which act as transcription factors [40]. In adrenal cortex, ER-β is expressed in the glomerular and fasciculated area during adulthood, while at the prepubertal age, it is mainly located in the reticular area [35, 41]. ER-α histotype appears to be
19
poorly expressed [35, 41]. During the course of neoplastic degeneration there is an unpredictable rearrangement of the expression of these receptors, and data concerning the expression of the ERs are controversial. Indeed, a negativity for ER-α and an increase of the ER-β in the ACC has been reported by immunohistochemical analysis [42], while other studies demonstrate, through western blot and reverse transcription-PCR (RT-PCR), low ER-β levels and / or high levels of ER-α, thus inducing an increase in the ER-α / ER-β ratio compared to that observed in healthy tissue [43]. These conflicting data suggest extreme variability in the expression of sex hormone receptors in ACC.
In the ACC cell model NCI-H295R, it has been shown that ER-β gene expression is higher compared to ER-α and the selective estrogen receptor modulator (SERM) 4-OH-tamoxifen inhibits cell proliferation [44]. The type I antiestrogens tamoxifen, is used in the treatment of ER-positive breast cancer [45] and, due to its nature, it displays a dose-, cells-, tissue- dependent effects [46]. Indeed, it acts as antiestrogen or pro-estrogenic agent depending on the nature of the target tissue and on the presence/absence of co-activators/co-repressors [47]. Furthermore, its metabolites show similar antiestrogenic activity and these aspects make the pharmacology of tamoxifen complex. As previously reported, literature suggests that tamoxifen decreases proliferation rate of ACC both in vitro and in vivo [48]. A recent study showed that tamoxifen induces a cell cycle arrest of NCI-H295R in G1 phase and cell death activating apoptotic mechanisms, requiring the MAPK kinase pathway activation [48].
1.4.2 Progesterone role in ACC
The involvement of Pg in ACC was indicated by results obtained by our group, studying the role of Abiraterone Acetate (AA) for the management of Cushing’s syndrome [49]. AA is a potent inhibitor of 17alpha-hydroxylase/17,20-lyase (CYP17A1), a key enzyme for steroid hormone synthesis [50]. Due to its ability to inhibit androgen synthesis by the adrenal gland, AA is effective in metastatic castration-resistant prostate cancer (CRPC) [51,52]. Besides reducing androgen levels, the drug rapidly impairs cortisol synthesis [53] and the AA efficacy
20
in controlling Cushing’s syndrome was observed by our group in ACC patient [54]. We demonstrated that AA significantly and steadily reduced cortisol secretion at all concentrations in NCI-H295R cells, expressing CYP17A1 enzyme leading to a consistent decrease in testosterone and its precursors, whereas the CYP17A1 substrate Pg significantly increased. These results were confirmed in the in vivo animal models of immune-deficient mice [49] and zebrafish embryos [55]. Further, in NCI-H295R cells and in ACC primary cell cultures, AA reduced the cell viability and this effect was mediated by Pg [49].
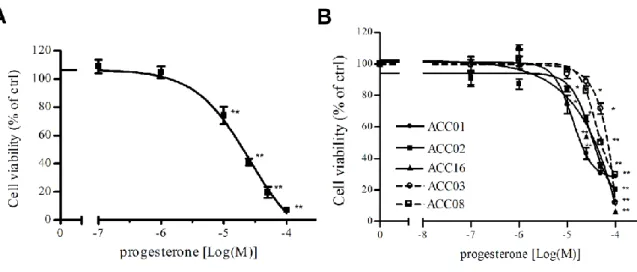
Thus, the role of Pg in ACC was further investigated and I was involved in this project. Pg acts through its nuclear receptors (PgRs), which are expressed in two different isoforms: the full length PgR-B and the short form PgR-A. In humans, both PgR isoforms are present in normal adrenal tissue and in ACC [42], whereas NCI-H295R cells display a higher expression of PgR-B than PgR-A [42]. NCI-H295R cells and five ACC primary cultures were exposed to increasing concentrations of Pg and we observed a decrease of cell viability in a concentration-dependent manner, as shown in Fig. 5.
Figure 5. Cytotoxic effect of Pg in ACC cell models. (A) NCI-H295R cell line and (B) five
ACC primary cells cultures were treated with increasing concentrations of Pg (0.1 – 160 µM) and then cell viability was measured by MTT assay. Results are expressed as percent of viable
21
cells vs untreated cells (ctrl). Data are the mean ± S.E.M. of three independent experiments performed in triplicate. *P < 0.01 vs ctrl; **P < 0.001 vs ctrl.
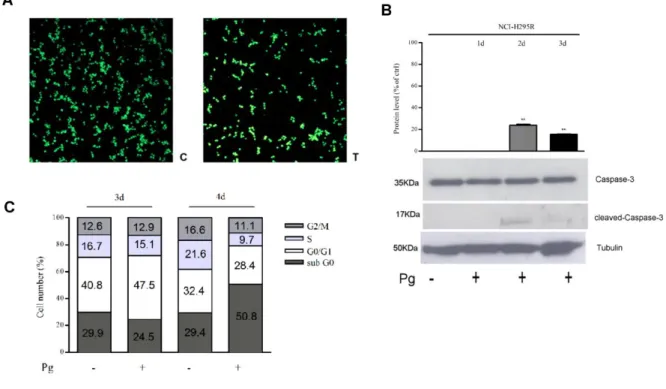
Interestingly, Pg effect is more evident in secreting tumor compared to non-secreting primary cultures, depending on the level of PgR expression, that is low in non-secreting ACC [56]. To provide explanation on the mechanism underlying progesterone-induced NCI-H295R cell toxicity we investigated the possible involvement of apoptosis mechanisms. As reported in Fig. 6A results demonstrated that after 4 days of NCI-H295R Pg IC50 treatment, the number of
NCI-H295R apoptotic cells were 39 ± 2%, while necrotic and living cells were 2 ± 2% and 59 ± 3% respectively.
Figure 6. Pg induces apoptosis in NCI-H295R cells. (A) Untreated cells (c) and 25 µM Pg
treated cells (t) were marked with Acridine Orange / Etidium Bromide. Viable (green), apoptotic (yellow) and necrotic (red) cells were scored under a confocal laser-scanning microscope. Magnification, 10x. Apoptotic cells: untreated vs treated cells: P < 0.001.
22
(B) NCI-H295R were treated for 1-2-3 days with Pg IC50 and quantification of Caspase-3 and
cleaved Caspase-3 was conducted by WB. Densitometric analysis of blots (n = 3) with specific levels of cleaved-Caspase-3 normalized to the corresponding tubulin levels. Bars represent the mean ± S.E.M; **P < 0.01 vs untreated cells. (C) Cell cycle analysis after 72 and 96 hours Pg
treatment.
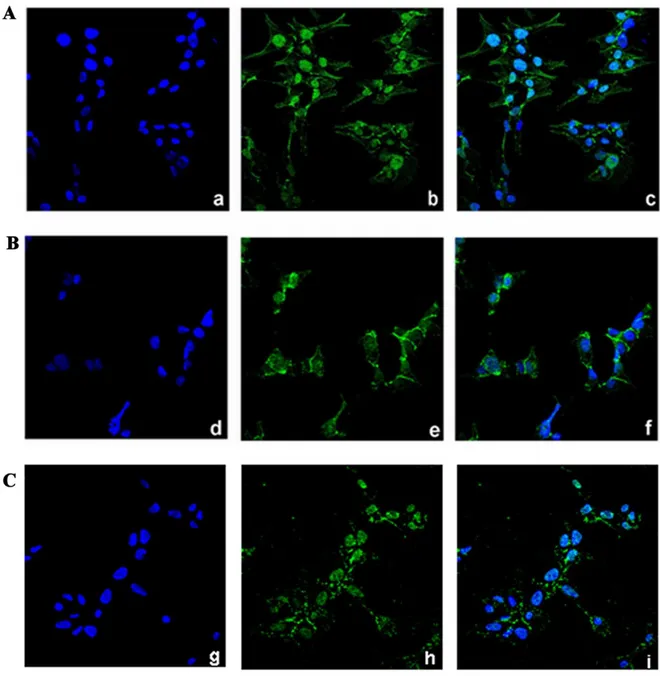
We next examined the expression of total Caspase-3 and the cleaved-Caspase-3, that plays a central role in the execution phase of cell apoptosis [57], in Pg-treated NCI-H295R cells in comparison to untreated cells (Fig.6B). Pg exposure for 2 days significantly increases the expression of cleaved-Caspase-3 (% of increase vs untreated cells: 23.9 ± 1.6; P < 0.05) while total Caspase-3 levels are not affected. Finally, the analyses of the cell cycle progression by flow cytometry in untreated and Pg treated NCI-H295R cells don’t show significant differences in cell distribution up to 4 days of treatment (Fig. 6C). However, we observed that treatment with Pg for 4 days increased the proportion of cells in the sub-G0 phase: 29.7 ± 4.6% untreated cells, 50.3 ± 5.1% Pg-treated cells (P < 0.05), suggestive of DNA fragmentation. Taken together these observations allow us to affirm that apoptosis is the main mechanism mediating the Pg cytotoxicity in this ACC cell model. The reduction of nuclear translocation of β-catenin can contribute to the cytotoxic effect of the drug (Fig. 7) [56].
23
Figure 7. Pg treatment affects the subcellular localization of β-catenin in NCI-H295R cells.
Cells were treated with Pg (25 µM) alone or in combination with mifepristone (100 nM) for 3 days. Untreated (A), Pg-treated (B) Pg-mifepristone-treated (C) cells were analyzed for β-catenin localization following by incubation with Hoechst for nuclear staining. Panels a, d, g: Hoechst; panel b, e, h: β-catenin; panel c, f, i: merge (Magnification, 40x).
When NCI-H295R cells were co-treated with Pg and mitotane, we observed a synergic effect compared to each single compound at a Fraction Affected (Fa) = 0.09 - 0.86 with range of Combination Index (CI): 0.08 to 0.88 (Fig.8).
24
Figure 8. Cytotoxic effect of mitotane is enhanced by Pg in NCI-H295R cells. (A) Cells were
treated with increasing concentration of mitotane (25 nM - 40 μM) for 4 days. Cell viability was analyzed by MTT assay. **P < 0.01 vs untreated cells. (B) Cells were exposed to increasing
concentrations of Pg and mitotane alone or in combination at 1:4 fixed molar ratio (Pg: mitotane) for 4 days; then cell viability was measured by MTT assay. (C) Cell viability from B was converted to Fraction affected (Fa) values and resulting data were analyzed with CompuSyn software to obtain combination index (CI) plot. Fa = 0: 100% cell viability; Fa = 1: 0% cell viability; CI value < 0.9, synergism, CI = 0.9-1.1 additive effect and CI > 1.1 antagonism.
Interestingly, Pg effect on ACC seems the result of a multifactorial process, involving both the genomic pathway through the nuclear PgRs and the non-genomic pathway by the membrane Pg receptors, namely mPRs and PGRMC1 [58,59]. Indeed, these receptors are functionally
25
active in NCI-H295R cells, as, when cells were treated with the IC50 value of Pg, we observed
a reduction of phospho-Erk protein level (% of decrease: 30.39 ± 1.14) at very early time, 15’ after Pg exposure (not shown). These results suggest the involvement of MAPK kinase pathway, activated by the membrane PgR.
26
2. Aim of the study
ACC is a rare endocrine tumor, associated with a poor prognosis. As literature reported, steroids hormones play a crucial role in the development and malignant progression of endocrine tumors. In particular, in endocrine tumors such as breast, endometrial and ovarian cancers, sex hormones produced in situ by the tumor induce cell proliferation of target cells, functioning as autocrine growth factors and as mitogenic factors [60].
Currently, the pharmacological therapy for both primitive and metastatic ACC is mitotane alone on in combination with the EDP scheme. However, mitotane has a low safety profile and is also characterized by complex pharmacokinetics [6]. Indeed, the ACC progression often occurs, despite the therapy. Thus, other therapeutic strategies are needed and the identification of new effective drugs in the context of ACC treatment is a priority.
Based on the intrinsic characteristics of ACC, such as the expression of ER, PgR and aromatase, hormonal production with hyperandrogenism and hyperestrogenism up to 30% of ACC cases [6], the un-meet therapeutical need and previous results of our group, the aim of this work was to evaluate the potential effects of sexual steroid treatments in in vitro experimental cell models of ACC and whether it could give the basis for a new pharmacological approach, using drugs already approved in the context of other endocrine pathologies.
We studied the effect of the agonist and antagonist drugs of the main sex steroid hormone receptors expressed in ACC, both as a single treatment, in combination or in association with mitotane.
Previous results indicated that PgR stimulation induced a cytotoxic effect on ACC cells [56], while tamoxifen has been used as a SERM. The study was conducted on NCI-H295R primitive ACC cell line and on metastatic ACC cell models, namely MUC-1 cell line kindly given by Dr. Hantel and ACC115m primary culture, established in our lab and derived from a patient with a metastatic ACC underwent surgery at the A.S.S.T. Spedali Civili of Brescia.
27
3. Materials and methods
3.1 ACC cell lines and primary culture
The human NCI–H295R cell line, derived from a primitive ACC in a female patient [61], was obtained from the American Type Culture Collection (ATCC) and cultured as indicated. MUC-1 cell line, established form a neck metastasis of an EDP-M treated male patient, was kindly given by Dr. Hantel and cultured as suggested [62]. Media and supplements were supplied by Merck (Merck Italia, Milan, Italy). Human ACC primary cells were derived from a male patient who underwent surgical removal of metastatic ACC, in progression after EDP-M. The local Ethical Committee approved the project and written informed consent was obtained from the patient. The primary culture ACC115m was obtained as previously described [63] and maintained in MUC-1 medium supplemented with L-Glutamine (2 mM) and amphotericin B (2.5μg/mL). Each cell model was tested for mycoplasma and periodically authenticated by BMR Genomics (BMR Genomics, Padova, Italy).
3.2 Immunohistochemistry
Tissue samples were obtained from formalin-fixed and paraffin embedded blocks from surgical samples. The clinical characteristics of the patients are reported in Table 1.
Table 1. Clinical and immunohistochemical characteristics of ACC patients.
Code Tumor specimen Histology Diseas e stage Hormone hypersecretion
ACC03 Male 57yr Abdominal
metastasis
Mitotic index: NA,
Ki-67: NA IV NA
ACC04 Female 62 yr Abdominal
metastasis
Mitotic
index: >50/50 HPF,
28
ACC06 Male 39 yr Abdominal
relapse
Mitotic index: NA,
Ki-67: 20-40% IV No
ACC07 Female 46 yr Primary tumor
Mitotic index: 10/HPF,
Ki-67: 70% IV No
ACC08 Female 39 yr Abdominal
metastasis
Mitotic index: NA,
Ki-67: NA IV No
ACC10 Female 45 yr Abdominal
relapse
Mitotic index: 32/20 HPF,
Ki-67: >20% IV No
ACC11 Female 70 yr Abdominal
relapse
Mitotic index: 20-30/20 HPF,
Ki-67: 15% IV Androgens
ACC12 Female 48 yr Thoracic
metastasis
Mitotic index: Na,
Ki-67: NA IV NA
ACC13 Male 55 yr Primary tumor
Mitotic
index:>50/10 HPF,
Ki-67: 40% IV No
ACC14 Female 54 yr Primary tumor
Mitotic
index: >5/50 HPF,
Ki-67: <5% II NA
ACC16 Male 54 yr Primary tumor
Mitotic
index: >50/10 HPF,
Ki-67: 50% IV NA
ACC17 Male 47 yr Primary tumor
Mitotic index: 2/50 HPF,
Ki-67: 25% III Cortisol
ACC23 Female 58 yr Primary tumor
Mitotic index: 25/10 HPF,
29
ACC24 Female 44 yr Primary tumor
Mitotic index: <1/10 HPF,
Ki-67: 3-5% IV Androgens
ACC26 Female 30 yr Abdominal
metastasis
NA
IV No
ACC27 Female 24 yr Lung metastasis NA IV Cortisol
ACC29 Female 51 yr Primary ACC
Mitotic index: 2/50 HPF;
Ki-67: <5%
IV Cortisol
ACC30 Male 39 yr Primary tumor
Mitotic index: 5-15/10 HPF,
Ki-67: 5-25% IV No
ACC32 Male 66 yr Primary ACC
Mitotic
index: >5/50 HPF; Ki-67: 20%
II No
ACC38 Female 34 yr Primary tumor
Mitotic
index: >50/10 HPF,
Ki-67: 5-60% II NA
ACC40 Female 30 yr Primary tumor
Mitotic index: 10-12/10 HPF,
Ki-67: 5-10% IV Androgens
ACC48 Female 19 yr Abdominal
metastasis
Mitotic index: NA,
Ki-67: 2% III Cortisol
ACC50 Female 28 yr Abdominal
metastasis
Mitotic
index: >20/50 HPF,
Ki-67: 40% IV Cortisol
ACC55 Male 57 yr Peritoneal
metastasis
Mitotic index: Na, Ki-67not
homogenous: 8-10%; 15-20%
IV No
ACC64 Female 60 yr Mitotic index: NA,
30 Abdominal
metastasis
ACC68 Female 53 yr Abdominal
metastasis
Mitotic index: NA,
Ki-67: 60% III Cortisol Androgens
ACC71 Female 29 yr Abdominal
metastasis
Mitotic index: NA,
Ki-67: 5% IV
Androgens Aldosterone
ACC74 Female 78 yr Primary tumor
Mitotic index: <1/50 HPF,
Ki-67: <1% NA NA
ACC75 Female 55 yr Primary tumor
Mitotic index: 15/10 HPF,
Ki-67: 25-30% IV No
ACC79 Male 72 yr Abdominal
metastasis
Mitotic index: NA,
Ki-67: 10-15% III NA
ACC81 Male 59 yr Primary tumor
Mitotic index: NA,
Ki-67: 70% IV No
ACC85 Male 45 yr Abdominal
metastesis
Mitotic index: NA,
Ki-67: 20% IV Estrogens
ACC91 Female 62 yr Abdominal
metastasis
Mitotic index: NA,
Ki-67: 20% IV No
ACC99 Male 82 yr Abdominal
metastasis
Mitotic index: NA,
Ki-67: 85% IV No
ACC103 Male 41 yr Primary tumor
Mitotic index: 3-4/10 HPF,
Ki-67: 15% III Cortisol
ACC115 Male 57 yr Linfonodal
metastasis Mitotic index: 58/10 HPF; Ki-67: 22% IV No NA = not available
31
Two μm thick sections were used for routine Haematoxylin and Eosin (H&E) staining and immunohistochemistry using the automatic stainer BenchMark ULTRA IHC/ISH System (Ventana). Diagnosis of cortical cell carcinoma was revised according to the most recent WHO criteria [64]. The following primary antibodies were used: anti-PgR clone 1E2, anti-ER clone SP1. All the primary antibodies were from “ready to use” kits from Ventana. Antigen retrieval was performed by incubation for 64 minutes for PgR and ER at 95°C in Ultra Cell Conditioning Solution (Ultra CC1, Ventana). Signal was revealed using the ultraView Universal DAB Detection kit (Ventana) followed by diaminobenzydine as chromogen and Hematoxylin for nuclear counterstain. Digital images were acquired by an Olympus XC50 camera mounted on a BX51 microscope (Olympus, Tokyo, Japan) using CellF Imaging software (Soft Imaging System GmbH, Münster, Germany). Expression of PgR and ER was semi-quantitatively scored on representative tumor areas based on both percentage [score ranges: 0 (0-5%), 1 (6-29%), 2 (30-69%), 3 (≥70%)] and intensity (score ranges: 0, no expression; 1, weak; 2, moderate; 3, high) of immunoreactive (IR) neoplastic cells.
3.3 Immunofluorescence
Cells were grown onto 12 mm poly-L-lysine coated coverslips for 4 days and were then fixed with paraformaldehyde 4% (w/v) (Immunofix, Bio-Optica, Milan, Italy) for 15 min at 4°C and permeabilized with 20% MetOH and 0.1% Triton X-100 in PBS for 10 minutes. Non-specific binding was blocked by incubation in PBS containing 0.1% Triton X-100 and 0.2% of BSA for 45 minutes. Cells were incubated with anti-PgR (0.125 µg/ml, Cell Signaling Technology, Danvers, Massachusetts, USA), anti-ER-β (2 µg/ml, Abcam, Cambridge, UK) and anti-ER-α (1.6 µg/ml, Invitrogen, Carlsbad, CA, USA) primary antibodies o/n at 4 °C. After extensive washes, the anti-rabbit Alexa Fluor 488 and anti-mouse Alexa Fluor 555 (Immunological Sciences, Rome, Italy) secondary antibodies, and Alexa Fluor 647 Phalloidin (Invitrogen) were applied at final concentration of 2 µg/ml for 1 hour at rt. After rinsing in PBS, coverslips were mounted using DAPI-containing Vectashield mounting medium (Vector Laboratories,
32
Burlingame, CA, USA). Slides were observed by a LSM 880 Zeiss confocal laser microscope (Carl Zeiss S.p.A., Milan, Italy) equipped with Plan-Apochromat 63x/1.4 numerical aperture oil objective or by a LSM 510 Zeiss confocal laser microscope (Carl Zeiss S.p.A.) equipped with Plan-Apochromat 63x/1.4 numerical aperture oil objective. Images were then reconstructed using Zeiss ZEN 2.3 Imaging Software (Carl Zeiss S.p.A.). The specific mean fluorescence intensity of the pixels was quantified using ZEN Black software (Carl Zeiss S.p.A) and/or NIH ImageJ software (Nation Institute of Health. Bethesda, MD, USA). Several fields, randomly chosen, were acquired and analyzed for each experimental condition.
3.4 Cell treatments
Cells were treated with increasing concentrations of Pg (0.1-160 µM; Merck Italia, Milan, Italy) and tamoxifen (0.1-20 µM; Selleckchem Chemicals-DBA Italia, Segrate, Milan, Italy); both drugs were solubilized in DMSO. Preliminary experiments of concentration-response curves were conducted in the ACC cell cultures, in order to establish the optimal drug concentration range and length of treatment. All experiments were conducted in charcoal-dextran-treated serum (CTS).
3.5 Measurement of cell viability and proliferation
Cell viability was assessed by 3-(4,5-Dimethyl-2-thiazol)-2,5-diphenyl-2H-tetrazolium bromide (MTT) dye reduction assay as described in Fiorentini et al. [65]. Briefly, untreated and drugs-treated cells were incubated with MTT dye (at final concentration of 0.5 mg/mL) and solubilized with DMSO. Absorbance was determined at 540/620 nm by a spectrophotometer (GDV, Rome, Italy). Cell proliferation rate was evaluated with TC20 automated cell counter (Bio-Rad Laboratories, Segrate, Milan, Italy). Briefly, cells were grown in 24-well plates, dislodged by trypsinization and suspended in culture medium followed by trypan blue dilution (1:2). The parameter settings were established according to the manufacturer instructions. Ten microliters of each sample were loaded into the opening of the TC20 counting slide. The cell counter automatically detects the presence of the counting slide and initiates the count.
33
Preliminary validation studies were performed in order to establish the optimal gate for each cell models.
3.6 Drug combination experiments
Combination experiments were performed to evaluate the interaction of tamoxifen and Pg/mitotane on NCI-H295R cell viability, according to the Chou and Talalay method [66]. Cells were treated for 4 days using increasing concentrations of Pg (7.4 – 84.3 µM) and tamoxifen (0.8 – 13.5 µM) or mitotane (1.51 – 17.21 µM) as single drug and in combination, as recommended for the most efficient data analysis [67]. The drug concentration curve for the combination has been designed for each ACC cell model based on the respective IC50 of each
drug and the used molar ratio is the result of the relationship between the IC50 value of each
drug, as recommended [67]. Optical densities were then converted to Fraction affected (Fa, range from 0 to 1 where Fa = 0 indicating 100% of cell viability and Fa = 1 indicating 0% of cell viability) and analyzed using the CompuSyn software (ComboSyn inc. Paramus, NJ, USA) to calculate the Combination Index (CI). A CI value < 1, = 1 and > 1 indicates synergism, additive effect and antagonism respectively.
3.7 Quantitative RT-PCR (q-RT-PCR)
Gene expression was evaluated by q-RT-PCR (ViiA7, Applied Biosystems, Milan, Italy) using SYBR Green as fluorochrome, as described elsewhere [68]. Sequences of oligonucleotide primers were reported in Table 2. Reactions were performed under the following conditions: 1 cycle at 95 °C for 10 min, 40 cycles at 95 °C for 15 s, 62 °C for 1 min. Differences of the threshold cycle (Ct) values between the β actin housekeeping gene and the gene of interest (ΔCt) were then calculated.
34
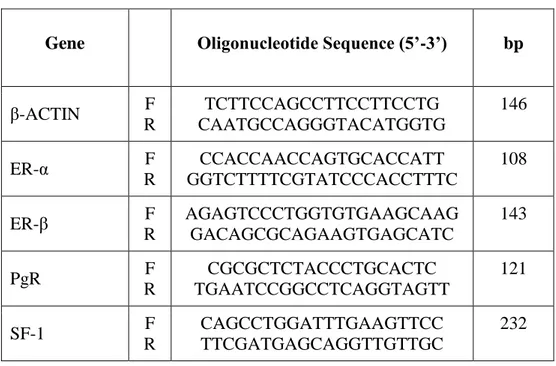
Table 2. Sequences of gene oligonucleotide primers for qRT-PCR
Gene Oligonucleotide Sequence (5’-3’) bp
β-ACTIN F R TCTTCCAGCCTTCCTTCCTG CAATGCCAGGGTACATGGTG 146 ER-α F R CCACCAACCAGTGCACCATT GGTCTTTTCGTATCCCACCTTTC 108 ER-β F R AGAGTCCCTGGTGTGAAGCAAG GACAGCGCAGAAGTGAGCATC 143 PgR F R CGCGCTCTACCCTGCACTC TGAATCCGGCCTCAGGTAGTT 121 SF-1 F R CAGCCTGGATTTGAAGTTCC TTCGATGAGCAGGTTGTTGC 232 3.8 miRNA analysis
Total RNA, including miRNAs, was extracted from cells using the miRNeasy kit (Qiagen, Milan, Italy) and 1 µg was transcribed into cDNA using miScript II RT kit (Qiagen), following the manufacturer’s protocol. q-RT-PCR was performed with a miScript System (Qiagen) [69]. Reactions were performed under the following conditions: 95°C 15 min; 94°C 15 s, 55°C 30 s, 70°C 30 s, 40 cycles. Sequences of miR-23 used were: miR23a: 5'AUCACAUUGCCAGGGAUUUCC; miRNA23b: 5'AUCACAUUGCCAGGGAUUACC. Variations in expression of miR-23a/b among different samples were calculated after normalization to U6.
3.9 Western Blot
Cells were homogenized in cold RIPA buffer and total protein concentrations were determined by Bio-Rad Protein Assay (Bio Rad Laboratories Inc.). Proteins (30 μg/lane) were separated by electrophoresis on a 4–12% NuPAGEbis-tris gel system (Life Technologies, Carlsbad, CA, USA) and electroblotted to a nitrocellulose membrane (GE Healthcare, Illinois, USA). Membranes were incubated with an anti-SF1 (0.234 µg/ml; Cell Signaling Technology,
35
Danvers, Massachusetts, USA), and anti-GAPDH (1 µg/ml Merk Millipore, Burlington, MA, USA) primary antibodies according to the manufacturer's instructions. Secondary HRP-labelled anti-mouse and anti-rabbit antibodies (Santa Cruz Biotechnologies, Heidelberg, Germany) were applied for one hour at room temperature at final concentration of 0.08 µg/ml. The specific signal was visualized using the Westar ƞc ultra 2.0 ECL (Cyanagen, Bologna, Italy). Densitometric analysis of the immunoblots was performed using the NIH ImageJ Software.
3.10 17β-estradiol measurement using indirect ELISA assay
17β-estradiol production was determined in the conditioned cell medium by an enzyme immunoassay method using Estradiol Human ELISA kit (Invitrogen, Carlsbad, CA, USA) according to the manufacturer’s instructions. Briefly, cells were plated at the density of 1 × 10⁶ cells/well in 6 wells plate in 1 ml of complete medium; 24 hours later medium was replaced with charcoal-dextran-treated serum medium and 24 hours later supernatants were collected and diluted 1:15 before testing. Medium alone was used as a blank. A standard 17β-estradiol curve using a nonlinear regression analysis using the four-parameter logistic equation performed with GraphPad Prism version (5.02) was used to compare the absorbance values and to derive pg/mL 17β-estradiol concentration.
3.11 Statistical analysis
The analysis of the data was carried out by the GraphPad Prism version 5.02 software (GraphPad Software, La Jolla, CA), using the one-way ANOVA, with Bonferroni's multiple comparisons test considering P < 0.05 as threshold for significant difference. IC50 values for
each drug were calculated by non-linear regression of the concentration–response curves. All results are expressed as mean ± SEM of three independent experiments, unless otherwise specified. Cytotoxicity experiments were carried out at least three times, each point run in triplicate.
36
4. Results
4.1 Estrogens in the ACC cell models
Due to the suggested different role of ER in cell viability, we evaluated whether the ER-α and ER-β subtypes were differentially expressed in ACC experimental cell models. ACC cell lines and the ACC115m primary cell culture were then investigated for ER gene and protein subtype expression. Results on gene expression are reported in Table 3, while the mRNA translation into the respective protein was demonstrated by immunofluorescence and reported in Fig. 9A. The immunofluorescence signal was then quantified and reported in Fig. 9B.
Table 3. ER gene expression in ACC cell lines and primary cell culture
Target gene NCI-H295R MUC-1 ACC115m ER-α 10.88 ± 0.36 > 15.00 11.50 ± 0.83 ER-β 9.81 ± 0.38 > 15.00 13.43 ± 0.68
Results are expressed as differences of the threshold cycle (Ct) between the gene of interest and the housekeeping gene β-actin (ΔCt) ± S.D.
Concerning the ACC cell lines, NCI-H295R cells expressed both ER subtypes, although the gene and the protein both indicated low level of expression, with a prevalence of ER-β over the ER-α (Table 3 and Fig. 9A). Metastasis-derived MUC-1 cell line and ACC115m primary culture, displayed a very weak expression of ER-α and ER-β, both at gene (Table 3) and protein level (Fig. 9A; quantified in the Fig. 9B). We would like to underline the peculiar sub-cellular localization of the ER subtypes, as we can observe a prevalent nuclear localization of ER-β (green).
38
Figure 9. ER-α and ER-β protein expression in ACC cell models. (A) Cells were seeded on
poly-lisine pre-treated coverlips following by incubation with DAPI for nuclear staining. Panels (A): DAPI; panels (B): phallodin; panels (C): ER-α (red)/β (green); panels (D): merge. The scale bar of 20 µm is automatically inserted by the software ZEN Black. (B) The specific mean fluorescence intensity of the pixels of acquired images was quantified using NIH ImageJ software and normalized for area in order to minimize the differences dimension among each cell lines and primary culture. Several fields, randomly chosen, were acquired and then analyzed for each experimental condition. Quantified analysis was conducted by GraphPad Prism 5.02 software.
NCI-H295R cell line express the CYP19A1 enzyme [49] and produced 17β-estradiol (10.01 ± 0.77 ng/ml). As it has been shown that exogenous E administration induces cell growth in NCI-H295R cell line [44 and unpublished results], to explore the possible involvement of ERs in ACC cytotoxicity and cell proliferation rate, ACC cells were treated with increasing concentrations of tamoxifen for 4 days and then evaluated for cell viability. The ACC cell line NCI-H295R displayed a concentration-dependent cytotoxicity, with the IC50 of 5.43 µM (95%
39
Figure 10. Cytotoxic effect of tamoxifen on NCI-H295R cell model. (A) Cells were treated
with increasing concentrations of tamoxifen as previously described. Cell viability was evaluated by MTT assay. Results are expressed as percent of viable cells vs untreated cells. (B) Cells were treated with low, intermediate and high dose of tamoxifen and then the proliferation rate was estimated by directly counted as describe in methods. Data are the mean ± SEM of three independent experiments performed in triplicate. *P < 0.0001 vs ctrl; §P < 0.01 vs ctrl.
MUC-1 cell line and ACC115m primary culture resulted resistant to tamoxifen, and this could find its rationale in the very low ER expression in these ACC cell models. As shown in Fig. 11, tamoxifen exposure did not show any effect on cell viability up to 15 µM and then a sharp decrease at 17.5 µM and 20 µM, more evident in ACC115m. Whether this effect is ER-dependent or not needs to be determined.
40
Figure 11. Cytotoxic effect of tamoxifen on metastatic ACC cell models. Cells were treated
with increasing concentrations of tamoxifen as described in methods. Cell viability was evaluated by MTT assay. Results are expressed as percent of viable cells vs untreated cells and data are the mean ± SEM of three independent experiments performed in triplicate. *P < 0.0001
vs ctrl.
4.1.1 Tamoxifen induced ER-β nuclear translocation in NCI-H295R cell line
To evaluate whether the tamoxifen effect involved a selected ER subtype, NCI-H295R cells were exposed to the tamoxifen IC50 and cells were fixed and analyzed with the fluorescent
microscope at different times. Fig. 12A shows that tamoxifen treatment induced a time-dependent increase of nuclear signal of ER-β, thus suggesting a significant nuclear translocation after 12 hours of drug exposure (Fig. 12B), that was maintained up to 24 hours (Fig. 12B), without any modification of the amount and localization of ER-α (not shown). These results suggested that ER-β could be the subtype mainly involved in the tamoxifen effect.
42
Figure 12. Effect of tamoxifen on ER-β in NCI-H295R cells. (A) Cells were treated for
different times with tamoxifen IC50 value. Slides were observed by a LSM 510 Zeiss confocal
laser microscope (Carl Zeiss S.p.A.) with 63X magnification. Images were then reconstructed using Zeiss ZEN 2.3 Imaging Software (Carl Zeiss S.p.A.). (B) The specific mean fluorescence intensity of the pixels of acquired images was quantified using ZEN Black software (Carl Zeiss S.p.A). Several fields, randomly chosen, were acquired and then analyzed for each experimental condition. Quantified analysis was conducted by GraphPad Prism 5.02 software. *P < 0.0001
vs ctrl; #P < 0.01 vs ctrl.
4.2 Pg in the ACC cell models
As above described, NCI-H295R cells express PgR [49] and Pg exerts a concentration-dependent cytotoxic effect on NCI-H295R cells line as well as in ACC primary cell cultures expressing PgR [56]. Here, we confirmed this result in other ACC cell models, studying the Pg effect in metastasis-derived cell models, namely MUC-1 cell line and in ACC115m primary cells. We firstly assessed the PgR expression in these cells by q-RT-PCR. The ΔCt ± SD obtained were MUC-1: 12.71 ± 0.62; ACC115m: 10.39 ± 0.04 (cDNA belonging from NCI-H295R cells was used as internal positive control: ΔCt ± SD:9.48 ± 0.57), thus suggesting that PgR gene expression was present. Although a direct relationship between mRNA and proteins cannot be directly established, a correlation between the gene expression and the immunofluorescent signal in these ACC cell models could be observed. Indeed, PgR signal in MUC-1 cells and ACC115m primary cell culture was weaker compared to NCI-H295R cells, that, on the other hand, present a non-homogenous intensity between cells, although the mean signal intensity was over 2-time higher compared to MUC-1 and ACC115m cells. These results are reported in Fig.13A and included NCI-H295R cells as positive control. The immunofluorescence signal quantification is reported in Fig. 13B.
44
Figure 13. PgR protein expression in ACC cell models. (A) Cells were seeded on poly-lisine
pre-treated coverlips following by incubation with DAPI for nuclear staining. Panels (A): DAPI; panels (B): phallodin; panels (C): PgR; panels (D): merge. The scale bar of 20 µm is automatically inserted by the software ZEN Black. (B) The specific mean fluorescence intensity of the pixels of acquired images was quantified using NIH ImageJ software and normalized for area in order to minimize the differences dimension among each cell lines and primary culture. Several fields, randomly chosen, were acquired and then analyzed for each experimental condition. Quantified analysis was conducted by GraphPad Prism 5.02 software.
A modest cytotoxic effect of both ACC cell models derived from metastatic patients was observed when cells were exposed to increasing Pg concentrations, suggesting that these cells were less sensitive to Pg compared to NCI-H295R cells. Indeed the IC50 was 67.58 µM (95%
CI: 63.22 – 73.04 µM) for MUC-1 cells and 51.76 µM (95% CI: 46.45 – 57.67 µM) for ACC115m cells (Fig.14A), while in NCI-H295R cells was 25.5 µM (95% CI: 19.9 – 32.9 µM) [56]. Pg treatment also affected the cell proliferation rate on each ACC cell models, as reported in Fig. 14B.
45
Figure 14. Cytotoxic effect of Pg on MUC-1 cell line and ACC115m primary culture. (A)
Cells were treated with increasing concentrations of Pg as previously described. Cell viability was evaluated by MTT assay. Results are expressed as percent of viable cells vs untreated cells. (B) Cells were treated with low, intermediate and high dose of Pg and then the proliferation rate was estimated by direct count as describe in methods. Data are the mean ± SEM of three independent experiments performed in triplicate. *P < 0.0001 vs ctrl; #P < 0.001 vs ctrl.
4.3 Effect of drug combined treatment on ACC cell viability
Due to the sensitivity of NCI-H295R cell line to both Pg and tamoxifen, we thus evaluated whether the cytotoxic effect of tamoxifen on NCI-H295R cell viability could be enhanced by Pg, applying the Chou-Talaly method for drug combination experiments [66, 67]. Cells were exposed to increasing concentrations of tamoxifen (1.2 – 13.5 µM) and Pg (7.4 – 84.3 µM) at 1:6.17 fixed molar ratio as described in Methods for 4 days and then analyzed for cell viability by MTT assay (Fig. 15A). The combination index was then calculated and the Compunsyn software analysis revealed a prevalent antagonist effect when the two drugs were combined (Fig. 15B). The combination index value for each drugs concentration is reported in Table 4 and the isobolograms are reported in Fig. 15C.
46
Figure 15. Combined treatment tamoxifen plus Pg in NCI-H295R. (A) Cells were treated with
increasing concentrations of tamoxifen and Pg alone or in combination for 4 days and the cytotoxicity was assessed by MTT assay. Data are the mean percentage ± SEM of three independent experiments performed in triplicate. *P < 0.0001 vs ctrl; §P < 0.01. (B) Cell
viability from A was converted to Fraction affected (Fa) values and resulting data were analyzed with CompuSyn software to obtain combination index (CI) plot. (C) Isobologram for combination treatment: combination data point on the diagonal line indicates additive effects, on the lower left indicates additive effects, on the upper right indicates antagonism.
Table 4. Combination of tamoxifen with Pg in NCI-H295R against cell viability
Tamoxifen [µM] + Pg [µM] Fa CI NCI-H295R 1.2 7.4 0.14383 1.31207 1.8 11.1 0.24449 1.37847 2.7 16.7 0.44228 1.28165 4 25 0.69325 1.10010 6 37.5 0.86501 0.97243 9 56.4 0.86157 1.48011 13.5 84.3 0.97214 0.95459
47
Finally, since mitotane is the standard treatment for ACC patients, we then also evaluated the combined treatment NCI-H295R cell line with tamoxifen and mitotane. Cells were treated with increasing concentrations of tamoxifen (0.8 – 9.11 µM) and mitotane (1.51 – 17.21 µM) at 1:1.89 fixed molar ratio, as above described, for 4 days and the cytotoxicity was assessed by MTT assay (Fig. 16A). The combination index was evaluated as describe in Methods and the combination index plot revealed an additive/synergistic cytotoxic effect at low concentrations of both drugs, ranging a fraction affected of about 10-18% (Fa: 0.10927 – 0.18062), while as the concentrations and the fraction affected values increased, the antagonism prevailed (Fig. 16B). The drug concentrations with the respective combination index values are reported in Table 5.
Figure 16. NCI-H295R combined treatment tamoxifen plus mitotane. (A) Cells were treated
with increasing concentrations of tamoxifen and mitotane alone or in combination for 4 days and the cytotoxicity was assessed by MTT assay. Data are the mean percentage of viability ± SEM of three independent experiments performed in triplicate. *P < 0.0001 vs ctrl; #P < 0.001
vs ctrl; §P < 0.01 vs ctrl. (B) the combination index was evaluated as describe in methods and
the CI plot is reported. (C) Isobologram for combination treatment: combination data point on the diagonal line indicates additive effects, on the lower left indicates additive effects, on the upper right indicates antagonism.
48
Table 5. Combination of tamoxifen with mitotane in NCI-H295R against cell viability
Tamoxifen [µM] + Mitotane [µM] Fa CI NCI-H295R 0.8 1.51 0.10927 0.48330 1.2 2.26 0.13303 0.69379 1.8 3.4 0.18062 0.96923 2.7 5.1 0.32583 1.24645 4.05 7.65 0.7 1.37401 6.075 11.475 0.91976 1.51086 9.11 17.21 0.94534 2.09133
Fa = Fraction affected; CI = Combination Index.
4.4 Pg and tamoxifen reduced SF-1 expression in NCI-H295R cells
In order to evaluate a functional effect of Pg and tamoxifen in the NCI-H295R cell lines, the effect of these drugs on the expression of the adrenal cortex biomarker, namely SF-1, the pleiotropic transcription factor also involved in carcinogenesis [70] was studied. Cells were treated with Pg or tamoxifen at their respective IC50 for 4 days and then the SF-1 expression
was evaluated. Results are reported in Fig. 17.
By q-RT-PCR, after Pg and tamoxifen treatment in NCI-H295R cells, no differences in the SF-1 gene expression were detected (not shown). Conversely, representative western blots reported in Fig. 17.1A showed that SF-1 protein expression was significantly reduced by both drugs: in particular, as shown in Fig. 17.1B, Pg treatment induced a - 36.34% ± 9.26% SF-1 reduction in treated cells compared to untreated, while in tamoxifen-treated cells the reduction was - 46.25% ± 15.68%.
As luciferase assay demonstrated [71], SF-1 mRNA seems to indirectly regulated by miR-23 a/b, thus we investigated the expression of these miRNAs in ours experimental models. The