ScienceDirect
Available online at www.sciencedirect.com
Transportation Research Procedia 41 (2019) 461–470
2352-1465 2019 The Authors. Published by Elsevier Ltd.
This is an open access article under the CC BY-NC-ND license (https://creativecommons.org/licenses/by-nc-nd/4.0/) Peer-review under responsibility of the scientific committee of the mobil.TUM18.
10.1016/j.trpro.2019.09.077
10.1016/j.trpro.2019.09.077 2352-1465
© 2019 The Authors. Published by Elsevier Ltd.
This is an open access article under the CC BY-NC-ND license (https://creativecommons.org/licenses/by-nc-nd/4.0/) Peer-review under responsibility of the scientific committee of the mobil.TUM18.
ScienceDirect
Transportation Research Procedia 00 (2016) 000–000
www.elsevier.com/locate/procedia
2214-241X© 2017 The Authors. Published byElsevier B.V.
Peer-review under responsibility of the organizing committee of mobil.TUM 2018.
mobil.TUM 2018 "Urban Mobility – Shaping the Future Together" - International Scientific
Conference on Mobility and Transport
An innovative methodology to define the bus comfort level
Benedetto Barabino
a,c, Laura Eboli
b, Gabriella Mazzulla
b*, Sara Mozzoni
a, Roberto
Murru
a, Giuseppe Pungillo
baCTM S.p.A., Viale Trieste, Cagliari 09123, Italy bUniversity of Calabria, Via P.Bucci, Rende 87036, Italy cUniversity of Cagliari, Via Marengo, Cagliari 09123, Italy
Abstract
On-board comfort is one of the factors influencing bus users’ perceptions. Investigating on comfort levels can support transit agencies in monitoring service performance and implementing strategies to improve the service. The specific objective of this paper is to develop an innovative methodology that provides a measure of the quality level of a bus ride in terms of comfort on board, considering instantaneous values of lateral and longitudinal vehicle acceleration. This methodology is based on the matching of subjective and objective measures of comfort. More specifically, authors identify subjective thresholds from the perception of comfort on board and objective thresholds from kinematic parameters recorded along bus routes. The proposed methodology allows to identify a comfort domain and to recognise where passengers experiment comfort/discomfort conditions associated with the driving style of bus drivers.
© 2017 The Authors. Published by Elsevier B.V.
Peer-review under responsibility of the organizing committee of mobil.TUM 2018. Keywords: On-board comfort; bus passengers’ perceptions; kinematic parameters
1. Introduction
Offering public transport services characterized by high levels of quality can increase the number of transit users, and then reduce the use of the automobile. This strategy leads to a reduction of the main negative effects of private transport modes: traffic congestion, environmental and noise pollution, and traffic accidents.
* Corresponding author. Tel.: +39-984-496-782.
E-mail address: [email protected]
ScienceDirect
Transportation Research Procedia 00 (2016) 000–000
www.elsevier.com/locate/procedia
2214-241X© 2017 The Authors. Published byElsevier B.V.
Peer-review under responsibility of the organizing committee of mobil.TUM 2018.
mobil.TUM 2018 "Urban Mobility – Shaping the Future Together" - International Scientific
Conference on Mobility and Transport
An innovative methodology to define the bus comfort level
Benedetto Barabino
a,c, Laura Eboli
b, Gabriella Mazzulla
b*, Sara Mozzoni
a, Roberto
Murru
a, Giuseppe Pungillo
baCTM S.p.A., Viale Trieste, Cagliari 09123, Italy bUniversity of Calabria, Via P.Bucci, Rende 87036, Italy cUniversity of Cagliari, Via Marengo, Cagliari 09123, Italy
Abstract
On-board comfort is one of the factors influencing bus users’ perceptions. Investigating on comfort levels can support transit agencies in monitoring service performance and implementing strategies to improve the service. The specific objective of this paper is to develop an innovative methodology that provides a measure of the quality level of a bus ride in terms of comfort on board, considering instantaneous values of lateral and longitudinal vehicle acceleration. This methodology is based on the matching of subjective and objective measures of comfort. More specifically, authors identify subjective thresholds from the perception of comfort on board and objective thresholds from kinematic parameters recorded along bus routes. The proposed methodology allows to identify a comfort domain and to recognise where passengers experiment comfort/discomfort conditions associated with the driving style of bus drivers.
© 2017 The Authors. Published by Elsevier B.V.
Peer-review under responsibility of the organizing committee of mobil.TUM 2018. Keywords: On-board comfort; bus passengers’ perceptions; kinematic parameters
1. Introduction
Offering public transport services characterized by high levels of quality can increase the number of transit users, and then reduce the use of the automobile. This strategy leads to a reduction of the main negative effects of private transport modes: traffic congestion, environmental and noise pollution, and traffic accidents.
* Corresponding author. Tel.: +39-984-496-782.
The quality level of a transit service is affected by several service aspects. On-board comfort is a key factor influencing the overall satisfaction perceived by bus users. The measure of comfort performance can support transit agencies for monitoring, evaluating and implementing service improvements. For this reason, it is crucial to analyze comfort as a service quality factor.
According to Faris et al. (2012), ride comfort is defined as how a vehicle responds to road conditions. Among other, accelerations and vibrations transmitted to the seated human body influence the ride comfort (Azizan and Fard, 2014). Since it is not easy to measure, comfort is usually evaluated on the basis of users’ perceptions as a function of road conditions or the type of vehicle. Several studies have been conducted to investigate and define ride comfort limits (e.g. Prashanth 2013, Sekulić 2013). Most of the studies consider transit users’ judgments only: selected passengers are asked to record their feelings about the motion on a questionnaire. Since passengers’ judgments represent a too subjective measure of service quality, it would be more convenient have also an objective measure that allows a more reliable evaluation of comfort on board to be obtained. With this respect, Maternini and Cadei (2014) proposed an objective scale to evaluate on-board comfort. This scale is built by integrating a specific comfort index with the dynamic effects on standing bus passengers and some road characteristics (e.g., the presence of roundabouts). However, they considered only an objective measurement of comfort, which is compared with the passengers’ transversal movements, but without integration with passenger’s judgments. Moreover, this scale derived from the railways system (EN 12299:2009).
An exhaustive review of objective and subjective comfort studies of passenger response can be found in the work of Hoberock (1976), where we can find longitudinal acceleration values that might be taken as comfort thresholds for various types of vehicles and conditions. Although the study is dated, a useful state-of-the-art in passenger tolerances to longitudinal acceleration was proposed. More recently, Eboli et al. (2016a) proposed a methodology for defining the level of bus comfort by comparing passengers’ comfort perception with the instantaneous accelerations recorded by smartphone. Specifically, they limit the analysis to the judgements expressed on two specific comfort aspects: comfort relating to driving behaviour due to slowing down, braking, steering, and accelerations, and comfort linked to route roughness. The judgements are then compared with two axis and three-axis acceleration values, respectively. The thresholds of these kinematic quantities were determined by considering average values of the instantaneous measures, and two comfort indices were developed for providing an aggregate comfort judgment.
The objective of this paper is to develop an innovative methodology that provides a measure able to quantify the quality level of a bus ride in terms of comfort. To this aim, authors identify subjective thresholds from the perception of comfort on board, and hence derive objective thresholds from kinematic parameters recorded along each bus route. Differently from the previous works, the aim of the proposed methodology is to build a bi-dimensional comfort domain. Authors retain that the proposed methodology could be very useful from a practical viewpoint. More specifically, the definition of comfort domain would help transit operators in maintaining levels of comfort which satisfy customers and can attract new users.
After establishing the research background, the remainder of this paper is organized as follows. Section 2 presents the proposed methodology to derive the comfort domain. Section 3 describes the real case study and the results. Finally, Section 4 provides conclusions and research perspectives.
2. Methodology
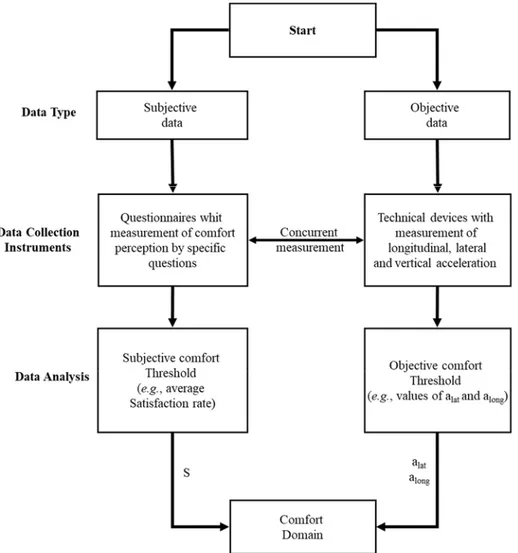
The proposed methodology aims to investigate the bus on-board comfort. More precisely, authors want to establish a comfort zone, called “comfort domain”, based on several experimental surveys. As shown in Figure 1, the methodology is structured into three levels: (i) data type, (ii) data collection instruments, and (iii) data analysis.
Firstly, we consider two items for defining the comfort domain: passengers’ perceptions (subjective data) and kinematic parameters (objective data). Passengers’ perceptions represent the subjective judgments of the perceived comfort on board expressed by bus passengers, whereas kinematic parameters describe the motion of a bus along a route. The basic assumption of the proposed methodology is that comfort can be considered as a function of vibration, braking and turns, so that some kinematic parameters have to be considered as affecting passengers’ feeling of discomfort on board.
Secondly, as two types of data need to be collected, two types of instruments are considered. Subjective data are collected by surveys addressed to passengers about their perception of comfort on board, whereas objective data are
collected by technical devices, which record several kinematic parameters along the route. More precisely, subjective data are collected by a questionnaire. The comfort level based on the driving style of the bus driver was chosen as subjective measure. On the other hand, both longitudinal and lateral instantaneous acceleration values were considered as objective data, which are the parameters largely used for analyzing and characterizing the driving style (Eboli et
al., 2016b).
Fig. 1 – Framework of the proposed methodology to define the bus comfort on board.
The kinematic parameters are recorded continuously along the trajectory followed by buses. In this way, it is possible to record location-at-time data along the road segment, and not only in certain pre-established road sections. This allows more data to be available. Moreover, as the kinematic parameters are instantaneously recorded and geo-referenced, the comfort level can be evaluated according to space; in this way, it can be known where the comfort is below or above an established threshold value. It is worth noting that, in order to avoid temporal mismatches and biases in the measurement, subjective and objective data need to be collected at the same time by using interviewers and technicians contemporaneously. More precisely, for each ride interviewers administer a questionnaire to a group of passengers, and technicians record a set of kinematic measurements by technical devices.
Thirdly, once data are collected, they can be analysed. Analysis is performed by matching subjective and objective measures, as the authors want to determine the passenger tolerance to some kinematic parameters of the vehicle such as longitudinal and lateral acceleration. Each questionnaire is associated with a specific journey; therefore, it refers to specific kinematic values. The matching of subjective and objective data is necessary for establishing the comfort
The quality level of a transit service is affected by several service aspects. On-board comfort is a key factor influencing the overall satisfaction perceived by bus users. The measure of comfort performance can support transit agencies for monitoring, evaluating and implementing service improvements. For this reason, it is crucial to analyze comfort as a service quality factor.
According to Faris et al. (2012), ride comfort is defined as how a vehicle responds to road conditions. Among other, accelerations and vibrations transmitted to the seated human body influence the ride comfort (Azizan and Fard, 2014). Since it is not easy to measure, comfort is usually evaluated on the basis of users’ perceptions as a function of road conditions or the type of vehicle. Several studies have been conducted to investigate and define ride comfort limits (e.g. Prashanth 2013, Sekulić 2013). Most of the studies consider transit users’ judgments only: selected passengers are asked to record their feelings about the motion on a questionnaire. Since passengers’ judgments represent a too subjective measure of service quality, it would be more convenient have also an objective measure that allows a more reliable evaluation of comfort on board to be obtained. With this respect, Maternini and Cadei (2014) proposed an objective scale to evaluate on-board comfort. This scale is built by integrating a specific comfort index with the dynamic effects on standing bus passengers and some road characteristics (e.g., the presence of roundabouts). However, they considered only an objective measurement of comfort, which is compared with the passengers’ transversal movements, but without integration with passenger’s judgments. Moreover, this scale derived from the railways system (EN 12299:2009).
An exhaustive review of objective and subjective comfort studies of passenger response can be found in the work of Hoberock (1976), where we can find longitudinal acceleration values that might be taken as comfort thresholds for various types of vehicles and conditions. Although the study is dated, a useful state-of-the-art in passenger tolerances to longitudinal acceleration was proposed. More recently, Eboli et al. (2016a) proposed a methodology for defining the level of bus comfort by comparing passengers’ comfort perception with the instantaneous accelerations recorded by smartphone. Specifically, they limit the analysis to the judgements expressed on two specific comfort aspects: comfort relating to driving behaviour due to slowing down, braking, steering, and accelerations, and comfort linked to route roughness. The judgements are then compared with two axis and three-axis acceleration values, respectively. The thresholds of these kinematic quantities were determined by considering average values of the instantaneous measures, and two comfort indices were developed for providing an aggregate comfort judgment.
The objective of this paper is to develop an innovative methodology that provides a measure able to quantify the quality level of a bus ride in terms of comfort. To this aim, authors identify subjective thresholds from the perception of comfort on board, and hence derive objective thresholds from kinematic parameters recorded along each bus route. Differently from the previous works, the aim of the proposed methodology is to build a bi-dimensional comfort domain. Authors retain that the proposed methodology could be very useful from a practical viewpoint. More specifically, the definition of comfort domain would help transit operators in maintaining levels of comfort which satisfy customers and can attract new users.
After establishing the research background, the remainder of this paper is organized as follows. Section 2 presents the proposed methodology to derive the comfort domain. Section 3 describes the real case study and the results. Finally, Section 4 provides conclusions and research perspectives.
2. Methodology
The proposed methodology aims to investigate the bus on-board comfort. More precisely, authors want to establish a comfort zone, called “comfort domain”, based on several experimental surveys. As shown in Figure 1, the methodology is structured into three levels: (i) data type, (ii) data collection instruments, and (iii) data analysis.
Firstly, we consider two items for defining the comfort domain: passengers’ perceptions (subjective data) and kinematic parameters (objective data). Passengers’ perceptions represent the subjective judgments of the perceived comfort on board expressed by bus passengers, whereas kinematic parameters describe the motion of a bus along a route. The basic assumption of the proposed methodology is that comfort can be considered as a function of vibration, braking and turns, so that some kinematic parameters have to be considered as affecting passengers’ feeling of discomfort on board.
Secondly, as two types of data need to be collected, two types of instruments are considered. Subjective data are collected by surveys addressed to passengers about their perception of comfort on board, whereas objective data are
collected by technical devices, which record several kinematic parameters along the route. More precisely, subjective data are collected by a questionnaire. The comfort level based on the driving style of the bus driver was chosen as subjective measure. On the other hand, both longitudinal and lateral instantaneous acceleration values were considered as objective data, which are the parameters largely used for analyzing and characterizing the driving style (Eboli et
al., 2016b).
Fig. 1 – Framework of the proposed methodology to define the bus comfort on board.
The kinematic parameters are recorded continuously along the trajectory followed by buses. In this way, it is possible to record location-at-time data along the road segment, and not only in certain pre-established road sections. This allows more data to be available. Moreover, as the kinematic parameters are instantaneously recorded and geo-referenced, the comfort level can be evaluated according to space; in this way, it can be known where the comfort is below or above an established threshold value. It is worth noting that, in order to avoid temporal mismatches and biases in the measurement, subjective and objective data need to be collected at the same time by using interviewers and technicians contemporaneously. More precisely, for each ride interviewers administer a questionnaire to a group of passengers, and technicians record a set of kinematic measurements by technical devices.
Thirdly, once data are collected, they can be analysed. Analysis is performed by matching subjective and objective measures, as the authors want to determine the passenger tolerance to some kinematic parameters of the vehicle such as longitudinal and lateral acceleration. Each questionnaire is associated with a specific journey; therefore, it refers to specific kinematic values. The matching of subjective and objective data is necessary for establishing the comfort
domain. Through a statistical analysis of the data, the thresholds allowing to determine discomfort conditions are defined, and a comfort domain is developed in order to point out where a ride can be considered comfortable from the passenger’s viewpoint. For this purpose, the judgment associated with each ride is the average satisfaction rate S calculated from n individual judgments, whereas the values of lateral and longitudinal acceleration (i.e., alat and along) on the same ride allow the comfort domain to be detected. In order to determine the comfort domain, it was decided to consider only the kinematic surveys associated with positive perception judgments, i.e., surveys in which the passengers think that driving style was held in comfort conditions. According to these values, the envelope of values recorded in comfort conditions was determined in the lateral-longitudinal acceleration plane (alat-alongplane). The envelope represents the borderline between the comfort conditions (inside the border) and those of discomfort (outside the borderline); it is a threshold of the acceleration vector in the longitudinal-lateral acceleration plane.
3. Real experiments
3.1. Case study
In order to test the proposed methodology, authors conducted an experiment to passengers of the bus system on the area of Cagliari, a coastal south Italian city with 0.4M inhabitants, sited in the region of Sardinia. This area is characterized by the highest demographic density of the region encompassing 8 communalities. In addition, it represents the island’s main commercial and administrative hub, daily attracting tens of thousands of commuters. The public transportation system is managed by the CTM and it is guaranteed by means of 264 vehicles (i.e., buses and trolleys) serving around 35.7 million passengers a year on 32 routes. Moreover, these vehicles travel over 12 million kilometers per year along 32 urban lines (CTM, 2017).
The proposed method is supported by the CTM, and is tested on 8 routes, which are representative of the overall bus network in terms of riders, lengths (613km), vehicle types (712m) and capacities (29105 passengers) as detailed in Table 1.
Table 1 – Route and bus characteristics. Route Inbound length[km] Outbound length[km] Overall length[km] Inbound bus stops[#] Outbound bus stops[#] Overall bus stops[#] Bus length[m] Bus Capacity[passenger (seats)] L1 13.200 11.190 24.390 46 35 81 12.00 105 (27) L2 9.648 9.384 19.032 35 35 70 12.00 105 (27) L3 6.140 6.720 12.860 23 25 48 7.90 58 (10) L4 9.941 31 9.23 85 (15) L5 18.490 49 12.00 83(25) L6 9.212 28 7.00 29 (10) L7 8.850 10.450 19.300 30 38 68 12.00 105 (27) L8 10.383 10.637 21.020 30 28 58 12.00 105 (27)
3.2. Data types and collection instruments
As mentioned in Section 2, objective and subjective data were collected at the same time. Data were gathered in five days in July 2017; each route was investigated for a time horizon ranging from 3 to 6 consecutive hours, from 07:00 AM to 07:00 PM.
Subjective data were gathered through a paper-and-pencil questionnaire administered to bus passengers randomly
approached on board. The vehicles are able to carry more standing passengers than sitting ones, as it can be noted from Table 1 (last column). Moreover, according to measurements of travel times recorded by CTM, passengers stay
on board on average 10 minutes; thus this information reinforce the hypothesis that most of the passengers travel standing. Therefore, we can assume that measurements mainly refer to standing passengers, which are supposed to travel less comfortable than sitting ones. The complexity of the questionnaire recommended the need to adopt the paper-and-pencil method (as opposed to a self-administered one) as a way to boost the accuracy and quality of the answers provided. Indeed, experiences during previous surveys conducted to public transport passengers in Cagliari suggested the high likelihood that a self-administered survey could have easily resulted in the misinterpretation of some questions, besides low response rates (Barabino et al., 2012). In addition, a paper-and-pencil interview is more convenient for passengers since they do not have to write and can remain comfortably in their places. The questionnaire was organized into four sections. The first section is a general part reporting contextual information, including date, time and route, and a question on the availability of passengers to agree with the survey. The remaining sections include information about socio-demographic characteristics (i.e., gender, age, educational qualifications, employment, car availability, and reason why using the bus), trip-related attributes (i.e., trip purpose, time of day, in-vehicle time, other transit systems use, bus use frequency), and ratings about several service quality attributes including comfort on board. More precisely, the specific question about the driving style of the bus driver was considered as a perceptions of comfort on board from the passenger’s viewpoint. This question was formulated as follows: “On a scale from 1 to 10, how satisfied are you with the operator’s driving style with reference to this route?” The evaluation scale varies from 1 to 10. The choice of the scale was made by considering that it is easier for the interviewed passenger to provide rates from 1 to 10, rather than 1 to 5 or 1 to 7, being the 1-10 scale used in the Italian scholastic evaluation method. Nevertheless, this choice does not affect the generality of the method, which is effective using any kind of scale. In addition, the similar reliability of different scales from a statistical point of view has already been pointed out, even if more response options tend to lead to somewhat lower scores (Dawes, 2008). Moreover, as the questionnaire was administered face-to-face, demographic questions were asked at the beginning of the interview to boost the respondent’s confidence (Shaughnessy et al., 2011). Since the interest and concentration of the interviewee were known to be limited (Ortúzar and Willumsen, 1994), a questionnaire that can be filled out within 3-5 minutes was developed. To gather accurate data, a crucial phase was the interviewers’ training activities before starting the survey. These activities involved classroom lessons on asking the questions and being very persuasive towards respondents through appeals to intentions, attitudes, values and actions sponsored by surveyors. This was done in order to ensure the maximum possible homogeneity in the questionnaire administration. Despite the impossibility to eliminate completely the distortions associated to this survey, authors believe that this phase greatly helped in reducing them to a significant extent. Two interviewers administered the questionnaire, one for each investigated ride.
Objective data were gathered through a smartphone equipped with GPS device and 3-axis accelerometer. Although
some professional equipment such as Vbox may be used to record the measurements, in this paper we used the smartphone for budget constraints. Smartphone is less bulky than the Vbox and it is easier to install on board, while still guaranteeing a good level of reliability of the collected data. Nowadays, smartphone helps acquire an enormous amount of data at low costs and with good reliability (Eboli et al. 2016b). This reliability is also demonstrated by the widespread use of literature studies. For example, smartphones are used to verify road design consistency (Eboli et
al., 2017a), to analyze driving style (Eboli et al. 2017, 2017b, 2017c), to understanding conditions of road surface
roughness (Douangphachanh and Oneyama, 2014). The accelerations were evaluated by using only one smartphone, placed at the point where the subjective measures of comfort were collected. By adopting a frequency of 1 hertz, a specific app (Torque) recorded along the trajectory followed during the ride: the GPS and the Device Time (in hours, minutes and seconds), the instantaneous bus position (longitude and latitude), the speed (in m/s), the horizontal dilution of precision, the altitude (in m), and the three components of the acceleration (in m/s2), that is lateral (alat), longitudinal (along) and vertical (avert). The most relevant attributes of data gathered by the app Torque are shown in Table 2. As an example, the first record represents the attributes of a bus position on route L1. This record was obtained on 25th of July 2017.
Nevertheless, for this specific experimentation only alatand along are considered, because the question addressed to the passengers about comfort on board referred only to bus driver driving style. Authors retain that instantaneous values of lateral and longitudinal accelerations can relate to the driving style of bus driver, and in turns to the bus comfort on board. On the other hand, comfort on board expressed by the passengers in terms of vibrations should be relate to the vertical component of the instantaneous values of accelerations.
In order to have reliable data, smartphone was positioned inside of the bus, next to the driver and on a horizontal plane. Positioning the measurements instrument in the front of the bus, next to the driver, obviously involve an approximation about the perceptions of the passengers about the comfort levels, because they are placed at different points of the bus that can be quite far from the smartphone location (e.g. in the front, in the middle or in the rear of the bus).
Table 2 – Location-at-time raw data sample gathered by the app Torque. GPS Time Device Time LONG
[°] LAT [°] GPS Speed [m/s] ALT [m] alat [m/s2] along [m/s2] avert [m/s2] Tue Jul 25 11:01:46 GMT+02:00 2017 25-lug-2017 11:02:15.519 9.1316 39.2375 4.86 11.8 0.0168 0.4429 8.9112 Tue Jul 25 11:01:47 GMT+02:00 2017 25-lug-2017 11:02:16.520 9.1316 39.2375 5.46 11.9 -0.0575 0.7422 9.3422 Tue Jul 25 11:01:48 GMT+02:00 2017 25-lug-2017 11:02:17.520 9.1317 39.2374 6.66 12.0 -0.2969 0.4669 9.5720 Tue Jul 25 11:01:49 GMT+02:00 2017 25-lug-2017 11:02:18.519 9.1317 39.2374 7.68 11.9 0.6632 0.3256 7.6830 Tue Jul 25 11:01:50 GMT+02:00 2017 25-lug-2017 11:02:19.519 9.1318 39.2373 8.02 11.8 -2.3152 0.2322 13.2399 Tue Jul 25 11:01:51 GMT+02:00 2017 25-lug-2017 11:02:20.519 9.1319 39.2373 8.66 11.9 -0.6009 -0.0790 9.8138 Tue Jul 25 11:01:52 GMT+02:00 2017 25-lug-2017 11:02:21.520 9.1320 39.2372 9.69 11.8 0.2969 0.7039 9.7013
A calibration of the system of reference with respect to the support plane was effected (Eboli et al., 2016a) in order to have lateral and longitudinal acceleration equal to 0, especially when the bus is stopped at key points (e.g., at bus stops). Technicians were instructed on the use of the app Torque. More precisely, the technicians were trained by classroom dedicated meetings and training on the field regarding the way to calibrate the app, to start and to end a specific session of measurement, and to download the collected data. Two technicians directly performed this activity, one for each investigated ride.
3.3. Data analysis
A total of 26 hours distributed on 42 complete runs was investigated. Data resulted in 142 completed questionnaires and about 100.000 raw records of kinematic parameters. The main results are reported in the following. First, the average rate of the perceived driving style is calculated by averaging the overall judgments given by interviewed passengers. A rate of 7.43 was obtained. This value shows that passengers are satisfied with the driving style of the bus drivers. Hence, they perceive the comfort on board as good. Next, in order to discover if significant differences exist among the routes concerning the perceived comfort according to gender, authors computed the average rates for males and females, and tested the differences between these average values by calculating the statistical test Zobs at 5% significance level for each route. Results are shown in Table 3.
Although females rated lower than males the driving style, no statistical differences are observed on the overall results, as the Zobs (i.e., -1.507) is within the critical range of Z (i.e., -1.960 <-1.507 <1.960). The only significant difference is observed for route L3. It can be considered negligible, as few data were available. Therefore, in order to identify the comfort domain, authors chose to consider the kinematic surveys to which is associated an average subjective judgment equal to or greater than 6, without differentiating among routes and between male and female passengers. That is, authors refer to a global evaluation of the perceived comfort.
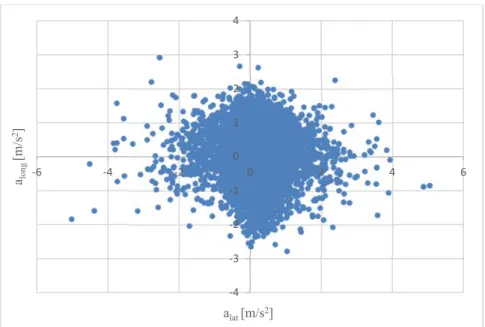
The evaluation derived from subjective data is linked to the objective data on lateral and longitudinal acceleration as follows. The scatter plot diagram has been created for each ride, to qualitatively show how the objective values are
arranged in the alat-along plane. In this diagram, the x-axis reports the recorded values of alat, whereas the y-axis the value of alongon all the routes and rides where the average judgment was greater than or equal to 6. As an example, Figure 2 shows the values of alat and alongfor more than 3,000 data points recorded on 8 rides of route L1. These points follow and well fit the shape of a parallelogram. The same trend is recorded for all bus routes as shown in Figure 3, where more than 100,000 points are plotted. Since these points are distributed to shape a parallelogram, it is necessary to detect the coordinates of the four vertices in order to determine the laws describing it.
Table 3 - Average Satisfaction rates of the perceived comfort recorded by the sample investigated. Route Overall
Average Satisfaction rate S
Female Average Satisfaction rate S
Male
Average Satisfaction rate S Zobs [α = 0,05]
L1 7.31 7.09 7.80 -0.974 L2 7.00 7.10 6.85 0.366 L3 7.18 6.78 9.00 -2.039 L4 6.69 6.64 7.00 -0.770 L5 7.00 6.14 8.20 -1.954 L6 8.14 8.17 8.00 0.349 L7 7.81 7.71 8.00 -0.430 L8 8.28 8.36 8.18 0.369 Overall 7.43 7.29 7.72 -1.507
In order to determine point A (upper vertex), the 99.5th percentile of the positive longitudinal acceleration components was determined, among all the points that have a lateral acceleration between -0.05 m/s2 and 0.05 m/s2. This is because there are few points having a lateral acceleration that is perfectly equal to zero. Data over the 99.5th percentile were considered as outliers and, thus, they were discarded. The same procedure was used to determine point C (lower vertex), but in this case the 99.5th percentile of the negative longitudinal accelerations was calculated. In order to determine point B, the 99.5th percentile of the positive lateral acceleration components was determined, among all the points having longitudinal acceleration between -0.05 m/s2 and 0.05 m/s2. Finally, point D has been determined considering the 99.5th percentile of the negative lateral acceleration components, among all the points having longitudinal acceleration between -0.05 m/s2 and 0.05 m/s2. The results are shown in Table 4 (Parallelogram domain).
Table 4 – Coordinates of the vertices of the parallelogram and rhombus domains.
Point Parallelogram domain Rhombus domain
alat [m/s2] along [m/s2] alat [m/s2] along [m/s2]
A 0.00 2.00 0.00 2.00
B 2.16 0.00 2.00 0.00
C 0.00 -2.17 0.00 -2.00
In order to have reliable data, smartphone was positioned inside of the bus, next to the driver and on a horizontal plane. Positioning the measurements instrument in the front of the bus, next to the driver, obviously involve an approximation about the perceptions of the passengers about the comfort levels, because they are placed at different points of the bus that can be quite far from the smartphone location (e.g. in the front, in the middle or in the rear of the bus).
Table 2 – Location-at-time raw data sample gathered by the app Torque. GPS Time Device Time LONG
[°] LAT [°] GPS Speed [m/s] ALT [m] alat [m/s2] along [m/s2] avert [m/s2] Tue Jul 25 11:01:46 GMT+02:00 2017 25-lug-2017 11:02:15.519 9.1316 39.2375 4.86 11.8 0.0168 0.4429 8.9112 Tue Jul 25 11:01:47 GMT+02:00 2017 25-lug-2017 11:02:16.520 9.1316 39.2375 5.46 11.9 -0.0575 0.7422 9.3422 Tue Jul 25 11:01:48 GMT+02:00 2017 25-lug-2017 11:02:17.520 9.1317 39.2374 6.66 12.0 -0.2969 0.4669 9.5720 Tue Jul 25 11:01:49 GMT+02:00 2017 25-lug-2017 11:02:18.519 9.1317 39.2374 7.68 11.9 0.6632 0.3256 7.6830 Tue Jul 25 11:01:50 GMT+02:00 2017 25-lug-2017 11:02:19.519 9.1318 39.2373 8.02 11.8 -2.3152 0.2322 13.2399 Tue Jul 25 11:01:51 GMT+02:00 2017 25-lug-2017 11:02:20.519 9.1319 39.2373 8.66 11.9 -0.6009 -0.0790 9.8138 Tue Jul 25 11:01:52 GMT+02:00 2017 25-lug-2017 11:02:21.520 9.1320 39.2372 9.69 11.8 0.2969 0.7039 9.7013
A calibration of the system of reference with respect to the support plane was effected (Eboli et al., 2016a) in order to have lateral and longitudinal acceleration equal to 0, especially when the bus is stopped at key points (e.g., at bus stops). Technicians were instructed on the use of the app Torque. More precisely, the technicians were trained by classroom dedicated meetings and training on the field regarding the way to calibrate the app, to start and to end a specific session of measurement, and to download the collected data. Two technicians directly performed this activity, one for each investigated ride.
3.3. Data analysis
A total of 26 hours distributed on 42 complete runs was investigated. Data resulted in 142 completed questionnaires and about 100.000 raw records of kinematic parameters. The main results are reported in the following. First, the average rate of the perceived driving style is calculated by averaging the overall judgments given by interviewed passengers. A rate of 7.43 was obtained. This value shows that passengers are satisfied with the driving style of the bus drivers. Hence, they perceive the comfort on board as good. Next, in order to discover if significant differences exist among the routes concerning the perceived comfort according to gender, authors computed the average rates for males and females, and tested the differences between these average values by calculating the statistical test Zobs at 5% significance level for each route. Results are shown in Table 3.
Although females rated lower than males the driving style, no statistical differences are observed on the overall results, as the Zobs (i.e., -1.507) is within the critical range of Z (i.e., -1.960 <-1.507 <1.960). The only significant difference is observed for route L3. It can be considered negligible, as few data were available. Therefore, in order to identify the comfort domain, authors chose to consider the kinematic surveys to which is associated an average subjective judgment equal to or greater than 6, without differentiating among routes and between male and female passengers. That is, authors refer to a global evaluation of the perceived comfort.
The evaluation derived from subjective data is linked to the objective data on lateral and longitudinal acceleration as follows. The scatter plot diagram has been created for each ride, to qualitatively show how the objective values are
arranged in the alat-along plane. In this diagram, the x-axis reports the recorded values of alat, whereas the y-axis the value of alongon all the routes and rides where the average judgment was greater than or equal to 6. As an example, Figure 2 shows the values of alat and alongfor more than 3,000 data points recorded on 8 rides of route L1. These points follow and well fit the shape of a parallelogram. The same trend is recorded for all bus routes as shown in Figure 3, where more than 100,000 points are plotted. Since these points are distributed to shape a parallelogram, it is necessary to detect the coordinates of the four vertices in order to determine the laws describing it.
Table 3 - Average Satisfaction rates of the perceived comfort recorded by the sample investigated. Route Overall
Average Satisfaction rate S
Female Average Satisfaction rate S
Male
Average Satisfaction rate S Zobs [α = 0,05]
L1 7.31 7.09 7.80 -0.974 L2 7.00 7.10 6.85 0.366 L3 7.18 6.78 9.00 -2.039 L4 6.69 6.64 7.00 -0.770 L5 7.00 6.14 8.20 -1.954 L6 8.14 8.17 8.00 0.349 L7 7.81 7.71 8.00 -0.430 L8 8.28 8.36 8.18 0.369 Overall 7.43 7.29 7.72 -1.507
In order to determine point A (upper vertex), the 99.5th percentile of the positive longitudinal acceleration components was determined, among all the points that have a lateral acceleration between -0.05 m/s2 and 0.05 m/s2. This is because there are few points having a lateral acceleration that is perfectly equal to zero. Data over the 99.5th percentile were considered as outliers and, thus, they were discarded. The same procedure was used to determine point C (lower vertex), but in this case the 99.5th percentile of the negative longitudinal accelerations was calculated. In order to determine point B, the 99.5th percentile of the positive lateral acceleration components was determined, among all the points having longitudinal acceleration between -0.05 m/s2 and 0.05 m/s2. Finally, point D has been determined considering the 99.5th percentile of the negative lateral acceleration components, among all the points having longitudinal acceleration between -0.05 m/s2 and 0.05 m/s2. The results are shown in Table 4 (Parallelogram domain).
Table 4 – Coordinates of the vertices of the parallelogram and rhombus domains.
Point Parallelogram domain Rhombus domain
alat [m/s2] along [m/s2] alat [m/s2] along [m/s2]
A 0.00 2.00 0.00 2.00
B 2.16 0.00 2.00 0.00
C 0.00 -2.17 0.00 -2.00
Fig. 2– Scatter diagram of the longitudinal and lateral acceleration values for the route L1.
Fig. 3 –Scatter diagram of the longitudinal and lateral acceleration values for the all investigated routes.
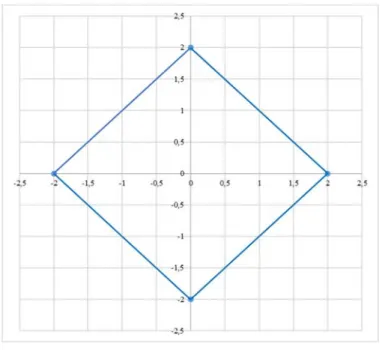
Finally, according to the previous results and for the sake of easy, the vertices that have the coordinates shown in Table 4 are considered (Rhombus domain). In this way, a parallelogram with all four equal sides is obtained, that is a rhombus (see Figure 4). This rhombus is a preliminary and useful tool to evaluate on-board comfort. More precisely, this tool can be used to identify the comfort and discomfort conditions. Each point in the alat-along plane represents a driving condition. ‐4 ‐3 ‐2 ‐1 0 1 2 3 4 ‐6 ‐4 ‐2 0 2 4 6 along [m/s 2] alat [m/s2] ‐4 ‐3 ‐2 ‐1 0 1 2 3 4 ‐6 ‐4 ‐2 0 2 4 6 alomg [m/s 2] alat[m/s2] A B C D
Fig. 4 - The comfort domain
If the point falls within the rhombus, we are in a comfortable driving condition, otherwise we are in uncomfortable driving conditions. The tool has been developed and calibrated matching subjective judgments with the objective ones, but it allows to evaluate the comfort only through the kinematic data recorded during the bus travel.
4. Conclusions and research perspectives
On-board comfort is a crucial factor affecting the quality of bus services. Its measure can support transit agencies for monitoring, evaluating and implementing specific actions in the service. Since it is difficult to be measured, past research separately entrusted on passenger’s perceptions, which provided a too subjective measure, and on kinematic parameters (e.g., acceleration, speed) which are not linked to passenger’s judgments. Moreover, to the best of the authors’ knowledge, among bus operators there is a strong interest in providing comfort domains, as already practised in the case of railways operators.
This paper contributes to the research by the proposal of an innovative methodology combining together passenger’s perceptions and kinematic parameters to define the on-board comfort level. This methodology identifies a comfort domain and precisely recognises where passengers experiment comfort/discomfort conditions associated with the driving style of bus drivers. This methodology is experimented on a real case study using about 150 subjective judgments and 100.000 objective raw data of kinematic parameters provided by the bus operator CTM in Cagliari (Italy). The methodology results in significant time and energy savings in the investigation of on-board comfort. Indeed, bus operators can monitor the on-board comfort of the overall fleets, and thus, reduce the costs for comfort surveys performed with on-board interviewers.
Nevertheless, this is a preliminary step in the authors’ research agenda, and thus, further research is recommended. Firstly, some experimentations with more subjective and objective data are recommended to derive a more solid comfort domain. Secondly, in this experimentation, the authors identified one comfort domain by considering a subjective comfort threshold in “average” terms for all the investigated rides. More challenging comfort domains will be derived by considering single subjective rates (e.g., 6, 7, 8, and so on) recorded on each ride, which will be linked to the related objective measures of kinematic parameters on it. In this way, one is able to determine an objective comfort scale, for each subjective measurement. Thirdly, the authors identified a comfort domain without differentiating among sitting and standing passengers. Since these characteristics are expected to vary in the comfort perceptions, a more challenging comfort domain may be derived taking into account these differences. Fourthly, in the automotive industry, comfort domains can be part of a real-time dashboard, which shows to the bus driver when
Fig. 2– Scatter diagram of the longitudinal and lateral acceleration values for the route L1.
Fig. 3 –Scatter diagram of the longitudinal and lateral acceleration values for the all investigated routes.
Finally, according to the previous results and for the sake of easy, the vertices that have the coordinates shown in Table 4 are considered (Rhombus domain). In this way, a parallelogram with all four equal sides is obtained, that is a rhombus (see Figure 4). This rhombus is a preliminary and useful tool to evaluate on-board comfort. More precisely, this tool can be used to identify the comfort and discomfort conditions. Each point in the alat-along plane represents a driving condition. ‐4 ‐3 ‐2 ‐1 0 1 2 3 4 ‐6 ‐4 ‐2 0 2 4 6 along [m/s 2] alat [m/s2] ‐4 ‐3 ‐2 ‐1 0 1 2 3 4 ‐6 ‐4 ‐2 0 2 4 6 alomg [m/s 2] alat[m/s2] A B C D
Fig. 4 - The comfort domain
If the point falls within the rhombus, we are in a comfortable driving condition, otherwise we are in uncomfortable driving conditions. The tool has been developed and calibrated matching subjective judgments with the objective ones, but it allows to evaluate the comfort only through the kinematic data recorded during the bus travel.
4. Conclusions and research perspectives
On-board comfort is a crucial factor affecting the quality of bus services. Its measure can support transit agencies for monitoring, evaluating and implementing specific actions in the service. Since it is difficult to be measured, past research separately entrusted on passenger’s perceptions, which provided a too subjective measure, and on kinematic parameters (e.g., acceleration, speed) which are not linked to passenger’s judgments. Moreover, to the best of the authors’ knowledge, among bus operators there is a strong interest in providing comfort domains, as already practised in the case of railways operators.
This paper contributes to the research by the proposal of an innovative methodology combining together passenger’s perceptions and kinematic parameters to define the on-board comfort level. This methodology identifies a comfort domain and precisely recognises where passengers experiment comfort/discomfort conditions associated with the driving style of bus drivers. This methodology is experimented on a real case study using about 150 subjective judgments and 100.000 objective raw data of kinematic parameters provided by the bus operator CTM in Cagliari (Italy). The methodology results in significant time and energy savings in the investigation of on-board comfort. Indeed, bus operators can monitor the on-board comfort of the overall fleets, and thus, reduce the costs for comfort surveys performed with on-board interviewers.
Nevertheless, this is a preliminary step in the authors’ research agenda, and thus, further research is recommended. Firstly, some experimentations with more subjective and objective data are recommended to derive a more solid comfort domain. Secondly, in this experimentation, the authors identified one comfort domain by considering a subjective comfort threshold in “average” terms for all the investigated rides. More challenging comfort domains will be derived by considering single subjective rates (e.g., 6, 7, 8, and so on) recorded on each ride, which will be linked to the related objective measures of kinematic parameters on it. In this way, one is able to determine an objective comfort scale, for each subjective measurement. Thirdly, the authors identified a comfort domain without differentiating among sitting and standing passengers. Since these characteristics are expected to vary in the comfort perceptions, a more challenging comfort domain may be derived taking into account these differences. Fourthly, in the automotive industry, comfort domains can be part of a real-time dashboard, which shows to the bus driver when
driving in comfortable/uncomfortable conditions. Finally, considering more accelerometers will help to refine the comfort threshold as the comfort may be evaluated in several points of the bus.
Acknowledgements
This work has been partially supported by the Italian Ministry of University and Research (MIUR), within the Smart City framework (project: PON04a2_00381 “CAGLIARI2020”).
References
Azizan, M.A., Fard M., 2014. The influence of vibrations on vehicle occupant fatigue. Proceedings of the International Conference INTER.NOISE 2014, Melbourne, Australia, November 2014, 249, (6), 1767-1777.
Barabino B., Deiana E., Tilocca P., 2012. Measuring service quality in urban bus transport: a modified SERVQUAL approach. International Journal of Quality and Service Sciences, 4(3), 238-252.
CTM “Carta della mobilità 2016-2017”, 2017[Online]. http://www.ctmcagliari.it/ Ortúzar J.de D., Willumsen L., 1994. Modeling transport. John Wiley and Sons, USA.
Dawes, J., 2008. Do data characteristics change according to the number of scale points used? International Journal of Market Research 50 (1), 61-77.
Douangphachanh, V., Oneyama, H., 2014. A study on the use of smartphone under realistic settings to estimate road roughness condition. Eurasip Journal on Wireless Communications and Networking, 114.
EN 12299, 2009. Railway applications: ride comfort for passengers – measurement and evaluation.
Faris, W.F., Ben Lahcene, Z., Hasbullah, F., 2012. Ride quality of passenger cars: an overview on the research trends’, International Journal of Vehicle Noise and Vibration 8 (3), 185-199.
Eboli. L., Mazzulla, G., Pungillo, G. 2016a. Measuring Bus Comfort Levels by using Acceleration Instantaneous Values, Transportation Research Procedia 18, 27-34.
Eboli, L., Mazzulla, G., Pungillo, G., 2016b. Combining speed and acceleration to define car users’ safe or unsafe driving behaviour. Transportation Research Part C: Emerging Technologies 68, 113–125.
Eboli, L., Guido, G., Mazzulla, G., Pungillo, G., 2017a. Experimental relationships between operating speeds of successive road design elements in two-lane rural highways. Transport 32, 138–145.
Eboli, L., Mazzulla, G., Pungillo, G., 2017b. How to define the accident risk level of car drivers by combining objective and subjective measures of driving style. Transportation Research Part F: Traffic Psychology and Behaviour 49, 29–38.
Eboli, L., Mazzulla, G., Pungillo, G., 2017c. Measuring the driver’s perception error in the traffic accident risk evaluation. IET Intelligent Transport Systems 11, 659–666.
Eboli, L., Guido, G., Mazzulla, G., Pungillo, G., Pungillo, R., 2017. Investigating Car Users’ Driving Behaviour through Speed Analysis. PROMET - Traffic&Transportation 29, 193.
Festa D.C., Longo G., Mazzulla G., Musolino G. (2001), Experimental analysis of different simulation models for motorway traffic flow, 2001 IEEE Intelligent Transportation Systems Proceedings, pp. 675-680, IEEE, Oakland, California.
Hoberock L.L., 1976. A survey of longitudinal acceleration comfort studies in ground transportation vehicles. Research Report 40. Department of Transportation, Office of University Research, Washington D.C. 20590.
Lin C.-Y., Chen L.-J., Chen Y.-Y., Lee W.-C., A comfort measuring system for public transportation systems using participatory phone sensing, in: Proceedings of PhoneSense 2010, Zurich, Switzerland, 2010.
Maternini G., Cadei M., 2014. A comfort scale for standing bus passengers in relation to certain road characteristics, Transportation Letters, 6:3, 136-141.
Prashanth, A.S., Saran, V. H., Harsha S.P., 2013. Study of subjective responses on ride comfort in public transport Uttarakhand State buses. 1stInternational & 16th National Conference on Machines and Mechanisms (iNaCoMM 2013).
Sekulić, D., Dedović, V., Rusov, S., Šalinić, S., Obradović, A., 2013. Analysis of vibration effects on the comfort of intercity bus users by oscillatory model with ten degrees of freedom. Applied Mathematical Modelling 37(18), 8629-8644.
Shaughnessy, J.; Zechmeister, E.; Jeanne, Z., 2011. Research methods in psychology (9th eds). New York, NY: McGraw Hill. pp. 161–175. Zhang, K., Zhou, K., & Zhang, F. (2014). Evaluating bus transit performance of Chinese cities: developing an overall bus comfort model.
![Table 1 – Route and bus characteristics. Route Inbound length[km] Outbound length[km] Overall length[km] Inbound bus stops[#] Outbound bus stops[#] Overall bus stops[#] Bus length[m] Bus Capacity[passenger (seats)] L1 13.200 11.190 24.390](https://thumb-eu.123doks.com/thumbv2/123dokorg/5549124.65729/4.816.56.761.583.861/characteristics-inbound-outbound-overall-inbound-outbound-capacity-passenger.webp)