Volume 2013, Article ID 695405,7pages http://dx.doi.org/10.1155/2013/695405
Research Article
Upgrading of Resolution Elastic Neutron Scattering (RENS)
S. Magazù, F. Migliardo, and M. T. Caccamo
Department of Physics and Earth Sciences, University of Messina, Viale F. S. D’Alcontres 31, 98166 Messina, Italy
Correspondence should be addressed to S. Magaz`u; [email protected] Received 31 May 2013; Accepted 18 July 2013
Academic Editor: Debashis Mukherji
Copyright © 2013 S. Magaz`u et al. This is an open access article distributed under the Creative Commons Attribution License, which permits unrestricted use, distribution, and reproduction in any medium, provided the original work is properly cited. An update of the Resolution Elastic Neutron Scattering (RENS) approach consisting in measuring the elastically scattered neutron intensity versus the instrumental energy resolution is presented. In particular it is shown that the measured elastic scattering law as a function of the logarithm of the instrumental energy of resolution gives rise to an increasing sigmoid trend whose inflection point can be connected with the system relaxation time. The validity of the RENS approach is supported by a numerical simulation, taking into account a Gaussian resolution function and a Lorentzian scattering law, and experimentally by integrated EINS and QENS measurements performed as a function of temperature on three homologous disaccharide/water mixtures showing different relaxation times. Furthermore, the most important advantages of the RENS approach are discussed; in particular, in comparison with QENS, the RENS approach requires a smaller amount of sample, which is an important point in dealing with biological and exotic systems, is not affected by the use of model functions for fitting spectra, and furnishes a direct access to the system relaxation time.
1. Introduction
The characterization of the molecular processes involved in condensed matter systems can be performed by Elastic Inco-herent Neutron Scattering (EINS) by means of the so-called “fixed-windows” method [1], where the scattered intensity is collected at 𝜔 = 0 with a fixed “energy windows” corre-sponding to the instrumental energy resolution. In the case of purely elastic scattering, all the scattered neutrons fall within this energy window and the measured intensity remains con-stant at all temperatures, a part from the small decrease, due to the Debye-Waller factor, while changes in the elastically scattered intensity are registered when the system relaxation time becomes shorter than the instrumental resolution time. This technique takes advantage from the fact that, besides a relatively low number of fitting parameters, with respect to the quasielastic contribution at low energy transfer the elastic one is often a factor 100–1000 higher, and then for obtaining good quality data in reasonable times, due to the usually limited neutron fluxes, one can cope with a relatively small amount samples, with small sized samples, or with strongly absorbing samples. In this framework, the analysis of the EINS intensity, collected by varying some internal or external parameters, can provide useful information. For
example, a wide wave-vector range (e.g., such as that of the back-scattering spectrometer IN13 at the ILL in Grenoble, with a𝑄 range extending up to 4.28 ˚A−1) can allow achieving an assignment based on spatial characteristics; in other words, the elastic intensity versus momentum exchange can allow us to characterize molecular motion according to their spatial extent and amplitude. Furthermore, a varying spectral resolution and energy window increase the capability of deciphering the nature of the recorded relaxations on the basis of characteristic time. Moreover, the use of hydrogen-deuterium labeling, highlighting contributions from specific scatterer groups or, separately, from protein and solvent, adds a dimension that can be crucial for spectral separation. Finally the temperature dependence of the measured elastic intensity can provide important clues on the activation ener-gies and, thus, on the local potentials; in fact, for example, the guiding picture for a water soluble protein is that increasing temperature from the lowest values where only vibrations mainly contribute, one reveals some more or less marked variations in intensity or in some intensity derived physical quantities, such as the Mean Square Displacement (MSD), that may correspond to the “activation” of some internal motions (e.g., methyl groups rotations), to motions induced
by solvent fluctuations, to the internal protein H-bonds, to the kinetic melting of solvent, to the melting of bulk solvent, and so forth [2–6].
It is well known that the time dependent pair correlation function𝐺(𝑟, 𝑡) represents the probability to find a particle at distance𝑟 after a time 𝑡 when a particle was at 𝑡 = 0 in 𝑟 = 0. The scattering law 𝑆(𝑄, 𝜔) and the intermediate scattering function 𝐼(𝑄, 𝑡) are directly connected, in Planck’s units, through time and space Fourier transforms. As a matter of fact, the previously introduced functions make reference to the system properties and not to measured quantities; in fact, it should be taken into account that, for example, when the experimental technique gives access to the scattering law one should take into account the less straightforward connection with the measured scattering function, which is the convolution of the scattering law with the instrumental resolution function and that can be expressed as the time Fourier transform of the product between the Intermediate Scattering Function and the Resolution function in the time domain.
The aim of this work is to present an updated approach, that is, RENS, which is based on the acquisition of the mea-sured elastic scattering law as a function of the instrumental energy resolution. In particular, the effect of the coupling between the system and the employed measuring instrument is considered and it is shown that the measured elastic scattering law as a function of the logarithm of the instru-mental energy resolution behaves like an increasing sigmoid curve whose inflection point occurs when this instrumental resolution time matches the system relaxation time.
In order to test the validity of the RENS approach we shall consider three systems constituted by water mixtures of three homologous disaccharides, that is, trehalose, maltose, and sucrose; these systems are shown, by QENS measurements, to exhibit different dynamics as a function of temperature; as a consequence when tested by EINS measurements at a given instrumental energy resolution as a function of temperatures, these systems are supposed to show, following the RENS approach, different inflection point temperatures. The collection of the measured elastic scattering intensity versus temperature, showing different inflection points for the three investigated systems, confirms the validity of the approach.
2. Materials and Methods
Ultrapure powdered trehalose, maltose and sucrose, D2O and H2O, purchased by Aldrich-Chemie, were used for the expe-riment.
EINS data were collected in the 20–310 K temperature range on the three homologous disaccharides trehalose, mal-tose, and sucrose in H2O at weight fraction values cor-responding to 19 water molecules for each disaccharide molecule by the IN13 spectrometer at ILL (Grenoble, France). The used IN13 configuration is the following; incident wavelength: 2.23 ˚A,𝑄-range: 0.28–4.27 ˚A−1. Raw data were corrected for cell scattering and detector response and nor-malized to unity at𝑄 = 0.00 ˚A−1.
Quasielastic neutron scattering (QENS) measurements were performed in a temperature range of 283–320 K on hydrogenated trehalose, maltose, and sucrose (C12H22O11) in H2O and on partially deuterated trehalose, maltose, and sucrose (C12H14D8O11) in D2O at weight fraction values corresponding to 19 water (H2O and D2O) molecules for each disaccharide molecule. In order to obtain partially deuterated samples, the disaccharides were first dissolved in pure D2O at a concentration of∼40% by weight, to exchange the eight labile hydrogen atoms of the disaccharides and the solutions were, subsequently, lyophilized. The procedure was repeated in order to allow the exchange of all the exchangeable hydro-gens. The solution samples were obtained by dissolution of the D2O-exchanged lyophilized disaccharides in pure D2O. The QENS experiment was carried out by the IRIS at ISIS (RAL, UK). We used the high resolution configuration of IRIS (graphite 002 and mica 006 analyser reflections) to measure sets of QENS spectra covering a𝑄, 𝜔-domain extending from ℎ𝜔 = −0.3 to 0.6 meV (energy transfer) and 𝑄 = 0.3 to 1.8 ˚A−1 (momentum transfer). The detectors used give a mean energy resolution of Γ = 8 𝜇eV of Half Width at Half Maximum (HWHM) as determined by reference to a standard vanadium plate.
3. Results and Discussion
It is well known that the scattering law 𝑆(𝑄, 𝜔) and the intermediate scattering function𝐼(𝑄, 𝑡) are connected by a time Fourier transform [7–12]:
𝑆 (𝑄, 𝜔) = 2𝜋1 ∫+∞ −∞ 𝐼 (𝑄, 𝑡) 𝑒 −𝑖𝜔𝑡𝑑𝑡, 𝐼 (𝑄, 𝑡) = 2𝜋1 ∫+∞ −∞ 𝑆 (𝑄, 𝜔) 𝑒 𝑖𝜔𝑡𝑑𝜔. (1)
The frequency instrumental resolution function𝑅(𝑄, 𝜔) in the 𝜔 space is connected to the corresponding time instrumental resolution function by the following Fourier transform:
𝑅 (𝑄, 𝑡) = 2𝜋1 ∫+∞
−∞ 𝑅 (𝑄, 𝜔) 𝑒
𝑖𝜔𝑡𝑑𝜔. (2)
The resolution scattering law corresponds to the convolu-tion of the scattering law:
𝑆𝑅(𝑄, 𝜔) = 𝑆 (𝑄, 𝜔) ⊗ 𝑅 (𝑄, 𝜔) . (3) Therefore, from a formal point of view, the convolution of the two functions𝑆(𝑄, 𝜔) and 𝑅(𝑄, 𝜔) produces a third function𝑆𝑅(𝑄, 𝜔) which can be viewed as a modified version of the original function𝑆(𝑄, 𝜔), given by the overlap area between the two functions, that is, the𝑆(𝑄, 𝜔) and the 𝜔-inverted𝑅(𝑄, 𝜔) functions when this latter is translated. As a consequence for instrumental resolution functions𝑅(𝑄, 𝜔) symmetric in 𝜔, the convolution coincides with the cross-correlation between𝑆(𝑄, 𝜔) and 𝑅(𝑄, 𝜔).
By the convolution theorem (3) can be written as 𝑆𝑅(𝑄, 𝜔) = 𝑆 (𝑄, 𝜔) ⊗ 𝑅 (𝑄, 𝜔) = 1 √2𝜋∫ +∞ −∞ 𝐼 (𝑄, 𝑡) ⋅ 𝑅 (𝑄, 𝑡) 𝑒 −𝑖𝜔𝑡𝑑𝑡. (4)
In the ideal case of purely elastic scattering in which the resolution function is a delta in the 𝜔-space and, hence, a constant in the𝑡-space, we obtain that having:
𝑆𝑅(𝑄, 𝜔 = 0) = 1
√2𝜋∫
+∞
−∞ 𝐼 (𝑄, 𝑡) ⋅ 𝑅 (𝑄, 𝑡) 𝑑𝑡 (5)
the measured scattering law𝑆𝑅(𝑄, 𝜔) reduces to a time aver-age of the intermediate scattering function𝐼(𝑄, 𝑡).
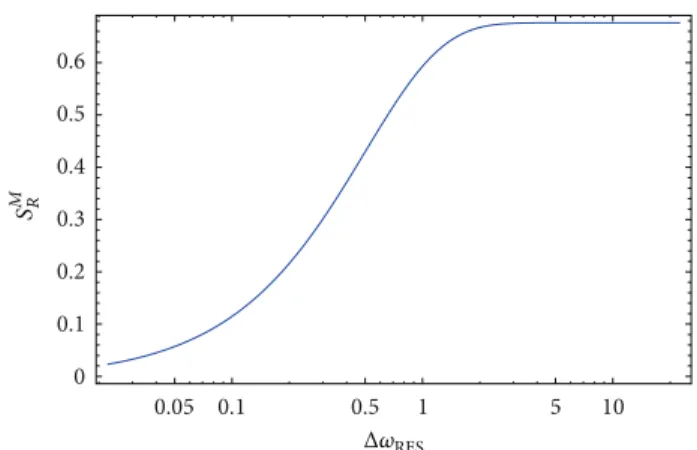
A part from this ideal case, in the more general condition in which the resolution function in the𝜔-space has a nonneg-ligible width, the experimentally measured elastic scattering law, due to the finite energy instrumental resolution Δ𝜔, 𝑆𝑀 𝑅(𝑄) is 𝑆𝑀𝑅 (𝑄) = ∫+Δ𝜔/2 −Δ𝜔/2 𝑆𝑅(𝑄, 𝜔) 𝑑𝜔, (6) and hence, 𝑆𝑀𝑅 (𝑄) = ∫+Δ𝜔/2 −Δ𝜔/2𝑆 (𝑄, 𝜔) ⊗ 𝑅 (𝑄, 𝜔) 𝑑𝜔 = ∫+Δ𝜔/2 −Δ𝜔/2[ 1 √2𝜋∫ +∞ −∞ (𝐼 (𝑄, 𝑡) ⋅ 𝑅 (𝑄, 𝑡)) 𝑒 −𝑖𝜔𝑡𝑑𝑡] 𝑑𝜔. (7) In order to show the operation approach of RENS as well as the expected experimental output we numerically test the behaviour of the measured elastic scattering function versus the instrumental energy resolution. On this purpose we operate in the frequency space and evaluate𝑆𝑀𝑅(𝑄) as a function of the energy instrumental resolution Δ𝜔, in the case in which the scattering law𝑆(𝑄, 𝜔), is a Lorentzian curve with a fixed linewidth (as, for example, it occurs for a simple Brownian translational diffusion process) and the resolution function𝑅(𝑄, 𝜔) is a Gaussian curve. In particular, in order to numerically get the RENS output we consider an increasing instrumental resolution function linewidthΔ𝜔 and apply (7) for determining the value of the definite integral as a function
ofΔ𝜔.Figure 1shows the result of such a calculation, that
is, 𝑆𝑀𝑅 as a function of the logarithm of the instrumental resolution. As it can be seen it shows an increasing sigmoid trend whose inflection point occurs when the linewidth of the resolution function approaches the linewidth of the system scattering law; in other words, in such a semilogarithmic plot the inflection point occurs when the instrumental resolution time crosses the system relaxation time. Such a result shows the operating way of the RENS approach: from the inflection point of EINS profiles versus the logarithm of the energy resolution one can extract the system relaxation time. It should be noticed that, in a complementary way, for a given fixed instrumental energy resolution function from EINS
0.05 0.1 0.5 1 5 10 0 0.1 0.2 0.3 0.4 0.5 0.6 Δ𝜔RES S M R
Figure 1:𝑆𝑀𝑅 as a function of the logarithm of the instrumental resolution; the inflection point of the increasing sigmoid trend can be connected with the system relaxation time.
profiles versus temperature one is able to obtain from the inflection point the temperature value for which the system relaxation time equals the resolution time. In the following we will apply such a procedure to demonstrate the validity of the RENS approach.
On the other hand, as far as the system cross-section is concerned, it is well known that the neutron scattering double differential cross-section can be written as
𝑑2𝜎 𝑑Ω𝑑𝜔 = 𝑘1 𝑘0 1 2𝜋∫ +∞ −∞ 𝑑𝑡𝑒 −𝑖𝜔𝑡 ×𝑁1 ∑𝑁 𝛼=1 𝑁 ∑ 𝛽=1 ⟨𝑏𝛼∗𝑏𝛽𝑒−𝑖Q⋅R𝛼(0)𝑒−𝑖Q⋅R𝛽(𝑡)⟩ = 𝑘1 𝑘0 1 2𝜋∫ +∞ −∞ 𝑑𝑡𝑒 −𝑖𝜔𝑡1 𝑁 × [ [𝑏 2 ∑ 𝛼 𝛼 ̸= 𝛽∑ ⟨𝑒−𝑖Q⋅R𝛼(0)𝑒−𝑖Q⋅R𝛽(𝑡)⟩ +|𝑏|2∑ 𝛼 ⟨𝑒 −𝑖Q⋅R𝛼(0)𝑒−𝑖Q⋅R𝛼(𝑡)⟩ ] ] = 𝑘1 𝑘0𝑏 2 𝑆coh(𝑄, 𝜔) + 𝑘1 𝑘0|𝑏|2𝑆inc(𝑄, 𝜔) +𝑘1 𝑘0(𝑏 2 − |𝑏|2) 𝑆inc(𝑄, 𝜔) = 𝑘1 𝑘0𝑏 2 𝑆 (𝑄, 𝜔) +𝑘1 𝑘0(𝑏 2 − |𝑏|2) 𝑆inc(𝑄, 𝜔) = 𝑘1 𝑘0 𝜎coh 4𝜋 𝑆 (𝑄, 𝜔) + 𝑘1 𝑘2 𝜎inc 4𝜋𝑆inc(𝑄, 𝜔) = 𝑘1 𝑘0[ 𝜎coh 4𝜋 𝑆 (𝑄, 𝜔) + 𝜎inc 4𝜋𝑆inc(𝑄, 𝜔)] , (8)
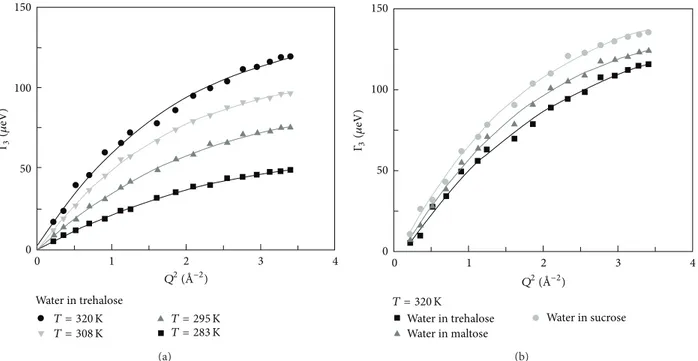
0 1 2 3 4 0 50 100 150 Water in trehalose Γ3 (𝜇 eV) T = 320 K T = 308 K T = 295 KT = 283 K Q2( ˚A−2) (a) 0 1 2 3 4 0 50 100 150 Water in trehalose Water in maltose Water in sucrose Γ3 (𝜇 eV) T = 320 K Q2( ˚A−2) (b)
Figure 2: Translational linewidthΓ3of (a) water in trehalose solutions for different temperature values and of (b) water in trehalose, maltose, and sucrose aqueous solutions at𝑇 = 320 K as a function of 𝑄2.
where𝑘0 and𝑘1are the incoming and outcoming neutron wavevectors,𝑏𝛼and𝑏𝛽are the scattering lengths of atom𝛼 and 𝛽, respectively, and it is |𝑏|2 = ⟨𝑏𝛼∗𝑏𝛽⟩, |𝑏|2 = ⟨𝑏𝛼∗𝑏𝛼⟩, 𝜎coh =
4𝜋|𝑏|2, and𝜎inc = 4𝜋(|𝑏| 2
− |𝑏|2). 𝜎coh takes into account
interference effects among waves produced by the scattering of a single neutron from all the nuclei, whereas𝜎increfers to
single particle properties.
In our case, due to the high percentage of hydrogen atoms in the investigated systems (H:𝜎coh = 1, 76; 𝜎inc = 80, 26)
only this latter contribution is relevant: 𝑑2𝜎 𝑑Ω𝑑𝜔 ≅ 𝑘1 𝑘0[ 𝜎inc 4𝜋𝑆inc(𝑄, 𝜔)] . (9)
In the following, the QENS and EINS data on disaccha-rides water mixtures are presented and discussed in the framework of the above-described RENS approach.
The analysis performed on the QENS data of disaccha-ride/D2O and disaccharide/H2O mixtures [13–16] allows us to characterise the diffusive dynamics of both solute and solvent. By determining the translational contribution, its linewidthΓ for disaccharides and water as a function of 𝑄2 follows a typical Random Jump Diffusion (RJD) model [9]:
Γ1(𝑄) = 𝐷𝑠𝑄2
1 + 𝐷𝑠𝑄2𝜏, (10)
where𝐷𝑠is the self-diffusion coefficient of the molecule and 𝜏 is the residence time. The RJD model furnishes the diffusion coefficient𝐷𝑠value from the extrapolation to𝑄 → 0 and the residence time𝜏 from the inverse of the asymptotic value at 𝑄 → ∞.
Such a model furnishes for trehalose the diffusion coeffi-cient𝐷𝑠and the residence time𝜏 of 𝐷𝑠 = 2.83 × 10⁻⁷cm2/s and𝜏 = 24.7 ps, 𝐷𝑠= 3.82 × 10⁻⁷cm2/s and𝜏 = 20.6 ps, 𝐷𝑠= 5.35×10⁻⁷cm2/s and𝜏 = 19.1 ps, and 𝐷
𝑠= 8.50×10⁻⁷cm2/s
and𝜏 = 18.3 ps for 𝑇 = 283, 295, 308, and 320 K, respectively. The RJD model furnishes for the diffusion coefficient𝐷𝑠 and the residence time𝜏 the values of 𝐷𝑠= 8.50 × 10⁻⁷cm2/s and𝜏 = 18.3 ps for trehalose, 𝐷𝑠 = 1.00 × 10⁻⁶cm2/s and 𝜏 = 14.3 ps for maltose, and 𝐷𝑠= 1.23 × 10⁻⁶cm2/s and𝜏 =
13.8 ps for sucrose at 𝑇 = 320 K.
The best fit according to the RJD model for the transla-tional linewidthΓ3of water in trehalose solutions at different temperature values and of water in trehalose, maltose, and sucrose aqueous solutions at 𝑇 = 320 K as a function of 𝑄2is reported inFigure 2. The diffusion coefficient of water
in the three disaccharide aqueous solutions at𝑇 = 320 K are:𝐷𝑤 = 8.31 × 10⁻⁶cm2/s for trehalose solution,𝐷𝑤 = 8.46 × 10⁻⁶cm2/s for maltose solution, and𝐷𝑤 = 8.60 × 10⁻⁶cm2/s for sucrose solution, with the values of residence times of𝜏 = 3.7 ps, 3.4 ps, and 3.0 ps for trehalose, maltose and sucrose solutions, respectively. It should be noticed that the diffusion coefficient of pure water at the same temperature is𝐷𝑤= 3.94 × 10⁻⁵cm2/s.
For the investigated systems the water dynamics resem-bles that of water at∼268 K in the case of trehalose solution, at∼271 K in the case of maltose solution, and at ∼277 K in the case of sucrose solution, while the whole water dynamics in trehalose solutions for 𝑇 = 283, 295, 308, and 320 K resembles that of water at ∼256 K, ∼261 K, ∼263 K, and ∼ 268 K, indicating that the water has a diffusive behaviour strongly triggered by the trehalose molecules and suffers from a noticeable frozen effect. Analogously to the trehalose aqueous solutions, all the disaccharides show a slowing down
2 1 0 −4 −3 −2 −1 0 1 2 3 0 5 10 15 20 Scal e Q ( ˚A−1 ) Am pl it ude (a) 2 1 0 −4 −3 −2 −1 0 1 2 3 0 5 10 15 20 Scal e Q ( ˚A−1 ) Am pl it ude (b) 2 1 0 −4 −3 −2 −1 0 1 2 3 0 5 10 15 20 Scal e Q ( ˚A−1 ) Am pl it ude (c) 2 1 0 −4 −3 −2 −1 0 1 2 3 0 5 10 15 20 Scal e Q ( ˚A−1 ) Am pl it ude (d)
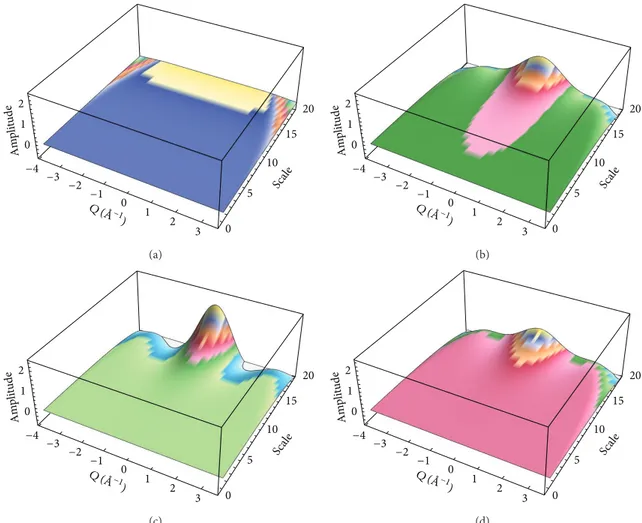
Figure 3: 3D scalograms of a wavelet analysis for sucrose/water mixtures, at three different temperatures, (a)𝑇 = 19 K, (b) 𝑇 = 264 K, and (c)𝑇 = 284 K, and (d) 3D scalogram of a wavelet analysis for trehalose/water mixtures at 𝑇 = 264.
effect of the water dynamics, which is stronger for trehalose than the other disaccharides.
The higher slowing down effect of the diffusive dynamics observed for trehalose is evidently linked to its extraordinary capability to “switch off ” the metabolic functions.
The EINS data on the same systems, that is, disaccha-ride/H2O mixtures [17–21], give an experimental confirma-tion of the RENS approach. In particular, the experimental findings have been analyzed by means of a wavelet analysis that allows us to characterize the scattered elastic intensity behavior on different scales highlighting the correlation between the signal and the set of the scaled and translated mother functions [22]. From a formal point of view, a continuous wavelet transform can be written as
𝑊𝐼(𝜏, 𝑠) = ∫ ∞ −∞𝐼 (𝑡) 𝜓
∗
𝜏,𝑠(𝑡) 𝑑𝑡, (11)
where 𝜏 ∈ R is the translation parameter, whereas 𝑠 ∈ R+ (𝑠 ̸= 0) is the scale parameter, 𝐼(𝑡) is the function to be analyzed, the asterisks denote the complex conjugate, and𝜓𝜏,𝑠 is the mother wavelet:
𝜓𝜏,𝑠= √𝑠1 𝜓 (𝑡 − 𝜏𝑠 ) (12)
the factor𝑠−1/2is an adimensional normalization constant.
More precisely, the translated-version allow the wavelets to be localized, whereas the scaled-version wavelets allows us to analyze the signal in different scales through the so-called scalogram, that is, the square of the modulus of the wavelet transform:
𝑃𝑊𝐼(𝑄, 𝑠) = 𝑊𝐼(𝑄, 𝑠)2. (13) More in details, the result of a wavelet analysis of the EINS data is shown inFigure 3, which reports the 3D scalograms at𝑇 = 264 K. Such an analysis allows us to compare both the spatial properties of the three systems in the wavevector range of𝑄 = 0.27 ˚A−1÷ 4.27 ˚A−1.
More precisely, starting from the lowest investigated tem-perature, 19 K, the presence of only one spectral contribution extending in the whole investigated wavevector range is revealed. Such a wide and flat contribution spans the whole wavevector range and can be attributed to the vibrational motions of the scatterer particles, that is, the system’s protons. As it can be seen in Figure 3, by increasing temperature a different contribution, at low wavevector values, clearly emerges. As pointed out by the adopted chromatic scales for the wavelet coefficients, already at this temperature value such a contribution is much less marked in the case of
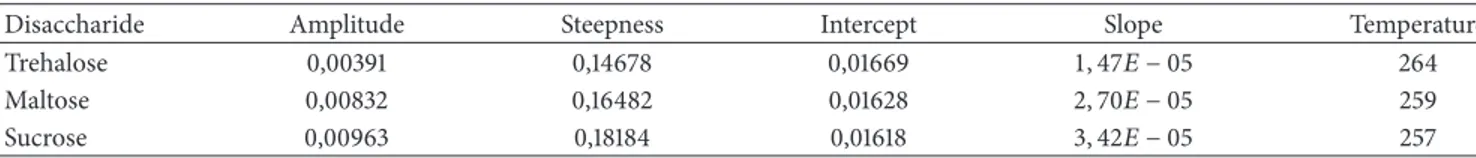
Table 1: Parameters of the fitting procedure according to (14) of the EINS intensity as a function of temperature for the three disaccharides.
Disaccharide Amplitude Steepness Intercept Slope Temperature
Trehalose 0,00391 0,14678 0,01669 1, 47𝐸 − 05 264
Maltose 0,00832 0,16482 0,01628 2, 70𝐸 − 05 259
Sucrose 0,00963 0,18184 0,01618 3, 42𝐸 − 05 257
trehalose. Finally the 3D scalograms of sucrose, maltose, and trehalose water mixtures at𝑇 = 284 K reveal that the weight of this latter contribution tends to increase with tempe-rature showing a different increasing rate for the three investigated systems. Therefore, the EINS results confirm that the dynamics of the trehalose/water system is slower with respect to that of the maltose/water and of the sucrose/water systems.
In order to test the validity of the RENS approach one should take into account that, since the three systems exhibit different relaxation times at all the investigated temperatures, when tested by EINS at a given instrumental energy resolu-tion as a funcresolu-tion of temperatures, they should show different inflection point temperatures.
In order to extract quantitative information from the 𝐼(𝑇) behaviors we performed a fit by using the following expression:
𝐼 (𝑇) = 𝐴 (1 −1 + 𝑒−𝐵(𝑇−𝑇1
0)) + (𝐶 − 𝐷𝑇) . (14)
Here 𝐴 represents the amplitude factor connected with the global thermal intensity behavior, whose inverse we call “thermal restrain”; it should be noticed that this quantity is not connected with a local behavior but represents a global property of the system. 𝐵 is connected with the transition steepness, passing from smaller to higher values when the transition becomes more and more abrupt. As it can be inferred by following the RENS approach,𝑇0is the inflection temperature, corresponding to the temperature value for which the system relaxation time equals the instrumental resolution time [4]. On this concern such a temperature value should occur at different values for the different disaccharides. Finally,𝐶−𝐷𝑇 represents the low temperature vibrational contribution.
InFigure 4the case of maltose intensity versus
tempera-ture is shown as an example while in the insert the behavior for the three disaccharides is reported. The results of the fitting procedure of EINS intensity as a function of tem-peratures for the three disaccharides performed by applying (14) are reported inTable 1. As it can be seen, the analysis indicates a higher thermal restrain together with a higher transition temperature for trehalose with respect to the other two homologous disaccharides. Such a result confirms the validity of the RENS approach. In fact, taking into account the meaning of the transition temperature, the disaccharides-water relaxation times cross the resolution time at different temperature values, that is, 264 K for trehalose, 259 K for maltose, and 257 K for sucrose.
In conclusion, this contribution shows the operating approach of RENS from an analysis performed on the frequency space: from the inflection point of EINS profiles
0 50 100 150 200 250 300 350 T (K) 0 50 100 150 200 250 300 T (K) 0 0.005 0.01 0.015 0.02 Int en sit y 0 0.005 0.01 0.015 0.02 Int en sit y A B T0 Sucrose + H2O Maltose + H2O Trehalose + H2O I(T) = A 1 − 1 1 + e−B(T−T0)) ) + (C T) C-DT -D
Figure 4: Intensity profile, obtained as sum for all the wavevector values, for maltose/H2O versus temperature with the fitting result according to (14).
versus the logarithm of the energy resolution one can extract the system relaxation time. In a complementary way, for a given fixed instrumental energy resolution function from EINS profiles versus temperature one is able to obtain from the inflection point the temperature value for which the system relaxation time equals the resolution time.
References
[1] M. Prager, W. Press, B. Alefed, and A. Huller, “Rotational states of the NH+4ion in (NH4)2SnCl6by inelastic neutron scattering,”
Journal of Chemical Physics, vol. 67, no. 11, p. 5126, 1977.
[2] A. Lerbret, G. Lelong, P. E. Mason, M.-L. Saboungi, and J. W. Brady, “Molecular dynamics and neutron scattering study of glucose solutions confined in MCM-41,” Journal of Physical
Chemistry B, vol. 115, no. 5, pp. 910–918, 2011.
[3] G. Lelong, R. Heyd, G. Charalambopoulou et al., “Role of glucose in enhancing stability of aqueous silica gels against dehydration,” Journal of Physical Chemistry C, vol. 116, no. 17, pp. 9481–9486, 2012.
[4] A. Lerbret, P. E. Mason, R. M. Venable et al., “Molecular dynamics studies of the conformation of sorbitol,” Carbohydrate
Research, vol. 344, no. 16, pp. 2229–2235, 2009.
[5] G. Lelong, W. S. Howells, J. W. Brady, C. Tal´on, D. L. Price, and M.-L. Saboungi, “Translational and rotational dynamics of monosaccharide solutions,” Journal of Physical Chemistry B, vol. 113, no. 39, pp. 13079–13085, 2009.
[6] L. Lupi, L. Comez, M. Paolantoni, D. Fioretto, and B. M. Ladanyi, “Dynamics of biological water: insights from molecu-lar modeling of light scattering in aqueous trehalose solutions,”
The Journal of Physical Chemistry B, vol. 116, pp. 7499–7508,
[7] L. van Hove, “Correlations in space and time and Born approx-imation scattering in systems of interacting particles,” Physical
Review, vol. 95, no. 1, pp. 249–262, 1954.
[8] F. Volino, Spectroscopic Methods for the Study of Local Dynamics
in Polyatomic Fluids, Plenum, New York, NY, USA, 1978.
[9] M. Bee, Quasielastic Neutron Scattering, Adam Hilger, Bristol, UK, 1988.
[10] S. Magaz`u, “NMR, static and dynamic light and neutron scat-tering investigations on polymeric aqueous solutions,” Journal
of Molecular Structure, vol. 523, pp. 47–59, 2000.
[11] A. Rahman, K. S. Singwi, and A. Sj¨olander, “Theory of slow neutron scattering by liquids. I,” Physical Review, vol. 126, no. 3, pp. 986–996, 1962.
[12] S. Magaz`u, G. Maisano, F. Migliardo et al., “Characterization of molecular motions in biomolecular systems by elastic incoher-ent neutron scattering,” Journal of Chemical Physics, vol. 129, no. 15, Article ID 155103, 2008.
[13] S. Magaz`u, F. Migliardo, and M. T. F. Telling, “Study of the dynamical properties of water in disaccharide solutions,”
Euro-pean Biophysics Journal, vol. 36, no. 2, pp. 163–171, 2007.
[14] S. Magaz`u, F. Migliardo, and M. T. F. Telling, “𝛼,𝛼-trehalose-water solutions. VIII. Study of the diffusive dynamics of “𝛼,𝛼-trehalose-water by high-resolution quasi elastic neutron scattering,” The Journal
of Physical Chemistry B, vol. 110, no. 2, pp. 1020–1025, 2006.
[15] S. Magaz`u, F. Migliardo, and M. T. F. Telling, “Structural and dynamical properties of water in sugar mixtures,” Food
Chem-istry, vol. 106, no. 4, pp. 1460–1466, 2008.
[16] F. Affouard, P. Bordat, M. Descamps et al., “A combined neutron scattering and simulation study on bioprotectant systems,”
Chemical Physics, vol. 317, no. 2-3, pp. 258–266, 2005.
[17] I. V. Blazhnov, S. Magaz`u, G. Maisano, N. P. Malomuzh, and F. Migliardo, “Macro- and microdefinitions of fragility of hydro-gen-bonded glass-forming liquids,” Physical Review E, vol. 73, no. 3, Article ID 031201, 7 pages, 2006.
[18] S. Magaz`u, F. Migliardo, C. Mondelli, and M. Vadal`a, “Correla-tion between bioprotective effectiveness and dynamic proper-ties of trehalose-water, maltose-water and sucrose-water mix-tures,” Carbohydrate Research, vol. 340, no. 18, pp. 2796–2801, 2005.
[19] S. Magaz`u, F. Migliardo, C. Mondelli, and G. Romeo, “Tem-perature dependence of mean square displacement by IN13: a comparison between trehalose and sucrose water mixtures,”
Chemical Physics, vol. 292, pp. 247–251, 2003.
[20] S. Magaz`u, G. Maisano, and F. Migliardo, “Fragility by elastic incoherent neutron scattering,” Journal of Chemical Physics, vol. 121, no. 18, pp. 8911–8915, 2004.
[21] S. Magaz`u, G. Maisano, F. Migliardo, and C. Mondelli, “𝛼, 𝛼-trehalose/water solutions. VII: an elastic incoherent neutron scattering study on fragility,” The Journal of Physical Chemistry
B, vol. 108, no. 36, pp. 13580–13585, 2004.
[22] S. Magaz`u, F. Migliardo, and M. T. Caccamo, “Innovative wave-let protocols in analyzing elastic incoherent neutron scattering,”
The Journal of Physical Chemistry B, vol. 116, no. 31, pp. 9417–
Submit your manuscripts at
http://www.hindawi.com
Scientifica
Hindawi Publishing Corporationhttp://www.hindawi.com Volume 2013
Corrosion
International Journal of
Hindawi Publishing Corporation
http://www.hindawi.com Volume 2013
Hindawi Publishing Corporation
http://www.hindawi.com Volume 2013
Polymer Science
International Journal ofISRN Corrosion
Hindawi Publishing Corporation
http://www.hindawi.com Volume 2013
Hindawi Publishing Corporation
http://www.hindawi.com Volume 2013
Composites
Journal ofAdvances in
Materials Science and Engineering
Hindawi Publishing Corporation
http://www.hindawi.com Volume 2013
International Journal of
Biomaterials
Hindawi Publishing Corporation
http://www.hindawi.com Volume 2013
ISRN Ceramics
Hindawi Publishing Corporation
http://www.hindawi.com Volume 2013 Hindawi Publishing Corporation
http://www.hindawi.com Volume 2013
Materials
Journal ofNanotechnology
Hindawi Publishing Corporationhttp://www.hindawi.com Volume 2013 Journal of
ISRN
Materials Science
Hindawi Publishing Corporation
http://www.hindawi.com Volume 2013
Hindawi Publishing Corporation
http://www.hindawi.com Volume 2013
Hindawi Publishing Corporation
http://www.hindawi.com Volume 2013
The Scientific
World Journal
ISRN
Nanotechnology
Hindawi Publishing Corporation
http://www.hindawi.com Volume 2013
Nanoparticles
Journal ofHindawi Publishing Corporation
http://www.hindawi.com Volume 2013
Research
Hindawi Publishing Corporation
http://www.hindawi.com Volume 2013
Hindawi Publishing Corporation
http://www.hindawi.com Volume 2013
Metallurgy
Journal ofInternational
Hindawi Publishing Corporation
http://www.hindawi.com Volume 2013
ISRN
Polymer Science
Hindawi Publishing Corporation
http://www.hindawi.com Volume 2013
N
a
no
ma
te
ria
ls
Hindawi Publishing Corporation
http://www.hindawi.com Volume 2013
Journal of