UNIVERSITY OF CATANIA
FACULTY OF MATH AND PHYSICS
PhD –
MATERIAL SCIENCE AND TECHNOLOGY
–
XXVII C.
SIMONE MAENZA
Integration and Optimization of
New Technology for
Building Integrated PV Systems
PhD thesis
Supervisor:
Prof. Ing. Rosario Lanzafame
Faculty of Engineering
1
ABSTRACT
The following thesis deals with the energy generation comparison between two different conversion technologies for photovoltaic systems: central-inverter conversion versus micro-inverter conversion.
After an analysis over the many energy generation technologies, the thesis focuses on photovoltaic energy systems.
The study of cell, module and system efficiencies will explain all causes of energy losses that can affect the photovoltaic energy generation.
The second part of the thesis is focused on the micro-inverter technology and the differences with the central-inverter systems.
Data analyses have been made on many systems in different locations (with almost the same sun radiation received), different azimuth and tilt angles, and different shading percentage.
The analyses will show how micro-inverter systems can improve energy production not only during shaded but also in not-shaded conditions.
At the end an economic comparison between the two different technologies will try to justify the use of micro-inverter systems not only for energy production efficiency but even for economic affordability.
2 摘要 这篇论文将会处理并对比光伏发电系统的两种不同转换技术: 中央逆变器转换和微型逆变器转换。 透过对不同种类的转换技术的分析, 这篇论文将集中研究光伏发电系统。光伏发电能量损失的各种原因会从太阳能电池,模板和系统效率来解释。 这篇论文的第二部分主要处理微型逆变器的转换和其与中央逆变器系统的差异。从不同的地点(相同太阳辐射), 方位, 倾角, 以及遮光率所得出的数据都能够证明微型逆变器系统可以改善于遮阴情况甚至非遮阴情况下的能源生产。 最后, 经过对这两种转换技术进行经济效益上的比较, 这篇文章将会证明微型逆变器不但有更高的生产效率, 而且更经济实惠。 关键词:微型逆变器; 光伏阵列; 阴影遮挡; 可再生能源 Zhāiyào (jiǎntǐ)
zhè piān lùnwén jiāng huì chǔlǐ bìng duìbǐ guāngfú fādiàn xìtǒng de liǎng zhǒng bùtóng zhuǎnhuàn jìshù: Zhōngyāng nì biàn qì zhuǎnhuàn hé wéixíng nì biàn qì zhuǎnhuàn.
Tòuguò duì bùtóng zhǒnglèi de zhuǎnhuàn jìshù de fēnxī, zhè piān lùnwén jiāng jízhōng yánjiū guāngfú fādiàn xìtǒng. Guāngfú fādiàn néngliàng sǔnshī de gè zhǒng yuányīn huì cóng tàiyángnéng diànchí, múbǎn hé xìtǒng xiàolǜ lái jiěshì.
Zhè piān lùnwén de dì èr bùfèn zhǔyào chǔlǐ wéixíng nì biàn qì de zhuǎnhuàn hé qí yǔ zhōngyāng nì biàn qì xìtǒng de chāyì. Cóng bùtóng dì dìdiǎn (xiāngtóng tàiyáng fúshè), fāngwèi, qīngjiǎo, yǐjí
zhēguāng lǜ suǒdé chū de shùjù dōu nénggòu zhèngmíng wéixíng nì biàn qì xìtǒng kěyǐ gǎishàn yú zhē yīn qíngkuàng shènzhì fēi zhē yīn qíngkuàng xià de néngyuán shēngchǎn.
Zuìhòu, jīngguò duì zhè liǎng zhǒng zhuǎnhuàn jìshù jìnxíng jīngjì xiàoyì shàng de bǐjiào, zhè piān wénzhāng jiāng huì zhèngmíng wéixíng nì biàn qì bùdàn yǒu gèng gāo de shēngchǎn xiàolǜ, érqiě gèng jīngjì shíhuì.
3
SOMMARIO
La seguente tesi ha come argomento l’analisi energetica comparativa di due differenti sistemi di conversione energetica per impianti fotovoltaici: inverter di stringa e micro-inverter.
Dopo un’analisi riguardante le diverse tecnologie di generazione dell’energia elettrica, la tesi si focalizza sui sistemi fotovoltaici.
Lo studio dell’efficienza energetica di cella, modulo e sistema esporrá le varie cause di perdita di energia che possono affliggere un sistema fotovoltaico.
La seconda parte della tesi si focalizza sulla tecnologia dei micro-inverter e le differenze con gli inverter di stringa.
Un’accurata analisi é stata svolta nel corso di un anno su 6 diversi sistemi fotovoltaici con una simile latitudine (tutti i siti sono in Sicilia), con differente angolo azimutale ed inclinazione, con differenti percentuali di ombreggiamento.
L’analisi mostrerá come i sistemi con micro-inverter sono in grado di incrementare la produzione di energia non soltanto nei casi di ombreggiamento sul sistema, ma anche in condizioni di non ombreggiamento.
Infine un’analisi economica confronterá le due differenti tecnologie cercando di giustificare la convenienza dei sistemi dotati di micro-inverter non soltanto per ragioni di generazione energetica, ma soprattutto per una convenienza a livello economico.
4
INDEX
ABSTRACT ... 1
SOMMARIO ... 3
INTRODUCTION ... 6
CHAPTER 1 ... 7
ENERGY SOURCES ... 7
1.1 RENEWABLE ENERGY SOURCES... 7
1.1.1 New frontiers in renewable energy production ... 12
1.2 ENERGY PRODUCTION IN ITALY ... 17
CHAPTER 2
SOLAR ENERGY ... 22
2.1 PHOTOVOLTAIC EFFECT ... 23
2.2 ELECTRICAL MODEL OF A PV-CELL ... 28
2.3 EFFICIENCY AND LOSSES OF A PV-MODULE ... 36
2.4 REFERENCE INDEXES AND LOSSES OF A PV SYSTEM ... 37
2.4.1 The Reference Yield - YR ... 38
2.4.2 The Array Yield - Yf ... 38
2.4.3 The PERFORMANCE RATIO - PR ... 38
2.4.4 Efficiency of the system DC sist_DC ... 40
2.4.4.1 MISMATCH ... 40 2.4.4.2 SHADOWING OR SHADING ... 42 2.4.4.3 SOILING ... 44 2.4.4.4 CONDENSATION ... 44 2.4.4.5 SUN-TRACKING ... 45 2.4.4.6 DC WIRES ... 45 2.4.4.7 AGING ... 45
2.4.5 Efficiency of the system AC sist_AC ... 46
2.4.5.1 INVERTER AND TRANSFORMATION LOSSES ... 46
2.4.5.2 AC WIRES, DIODES AND CONNECTIONS ... 47
2.4.6 Final efficiency ... 47
2.4.6.1 SYSTEM AVAILABILITY ... 48
CHAPTER 3 EVOLUTION OF PHOTOVOLTAIC ... 49
3.1 DIFFERENT KIND OF CELLS AND MANUFACTURING ... 49
5
3.1.2 Thin film cells ... 56
3.1.3 Multi junction cells ... 59
3.1.4 Emerging PV cells ... 60
3.2 CONCENTRATED PV SYSTEMS ... 63
3.2.1 Optic systems ... 64
3.2.2 Tracking systems ... 66
3.3 CONVERSION SYSTEMS... 66
3.4 THE PHOTOVOLTAIC MARKET ... 69
3.4.1 World market ... 72
3.4.2 Italian market ... 73
CHAPTER 4 EXPERIMENTAL EVALUATION OF THE TESTED PV
SYSTEMS ... 75
4.1 SYSTEMS DESCRIPTIONS ... 75
4.2 CENTRAL INVERTER SYSTEMS ... 76
4.2.1 Central inverter system -1 ... 76
4.2.2 Central inverter system-2 ... 79
4.3 MICRO INVERTER SYSTEMS ... 81
4.3.1 Micro-inverter system - 1 ... 81
4.3.2 Micro-inverter system - 2 ... 83
4.3.3 Micro-inverter system - 3 ... 85
4.3.4 Micro-inverter system - 4 ... 87
CHAPTER 5 DATA ANALYSIS ... 90
CHAPTER 6 CONCLUSIONS ... 95
NOMENCLATURE ... 99
BIBLIOGRAPHY ... 102
6
INTRODUCTION
The world energy request is nowadays as important as the needs of water or food. Analyses say that during the next 50 years the population will keep growing and so the need of energy will grow even more than 50% than today: the human society is pushing to a more technological standard of living, increasing so the energy consumption per person. This means that to maintain the same technological level new power plants for energy generation will have to be built.
Most of the power plants currently in function are thermoelectric power plants, i.e. that a combustion reaction is needed to generate the heat for generating vapor steams usefully for the rotation of turbines and so of the electric generators.
Every combustion reaction generates gasses that contribute to raise the greenhouse effect on the planet, causing temperature rising and climate alterations.
Moreover the supply of fossil fuels is coming to a shortage, that means that the prices of the fuels will increase and the cost of energy production will get higher and higher.
The solution obviously cannot be searched in installing more thermoelectric power plants, that will cause more pollution and an energy cost raises.
The only way to keep growing in energy generation without affecting on the climate or on the policies of many countries (often in contrast for energy fuel stocks control) is by using distribute and renewable energy sources, i.e. a source of energy that has a regeneration time faster than its consumption.
This thesis deals with the photovoltaic energy generation with micro-inverter conversion systems for building integrated installations; the aim is to show how photovoltaic generation with micro-inverter systems could be a way for reducing the energy losses and so increasing energy generation compared to the traditional photovoltaic systems.
7
CHAPTER
1
ENERGY SOURCES
Energy sources are mainly separated in traditional and alternative energy sources.
The traditional energy sources are most of all the fossil fuels utilized starting from the first industrial revolution until today to generate heat by combustion reactions.
All the other sources have to be considerate as alternative.
The most common traditional sources are so the fuels generated from petroleum refining, (such as gasoline, diesel fuel, heavy fuels), methane, coal, et cetera.
Bio-gas from the waste or bio-fuels from the refining of agricultural products, even if are quite similar to the traditional fuels (for example bio-ethanol), are considered as an “alternative” to the traditional sources.
The use of nuclear energy or the combustion of waste directly in the furnaces could be considered as an alternative to the traditional sources of energy.
Among the alternative sources of energy there is another subclass: the renewable energy sources. An energy source is considered renewable if its consumption is slower than its regeneration.
It obviously depends on the policies of each country how to describe a source of energy in order to set which kind of economical action should be taken for that specific energy source (for many years also nuclear energy has been considered as renewable).
1.1 RENEWABLE ENERGY SOURCES
The renewable sources are most commonly identified in geothermal, sun, wind and water (rivers, falls, sea shores) energy.
8
Most of the power plants that use renewable sources of energy do not usually have electricity generation costs comparable to the traditional power plants, exception made for hydroelectric power plants (that have been the first power plants ever used for energy generation).
Renewable sources have been given a market pull from the governments of different countries thanks to the policies against pollution that started from the international protocol agreed in Kyoto in 1997 (it actually started only in 2005 after the approval of the Russian government).
New environmental policies in Europe have been given for 2020 giving another push to the renewable sources, thanks to the deal “20-20-20”:
20% reduction in EU greenhouse gas emissions from 1990 levels 20% raising of electricity used from renewable sources production 20% improvement in the EU’s energy efficiency
The most used renewable source of energy is undoubtedly hydraulic energy, historically used even before the fossil fuels as source for electric generation.
These power plants have a huge territorial impact due to the landscape alteration that has to be made: to create dams and reservoirs for the water, to deviate rivers or to intercept falls for letting the water flow through the turbines.
9
It is possible to use many hydroelectric generators also as pumps: by using basins at different heights connected one each other is it possible to “store” energy in case of energy overproduction by the traditional power plants on grid.
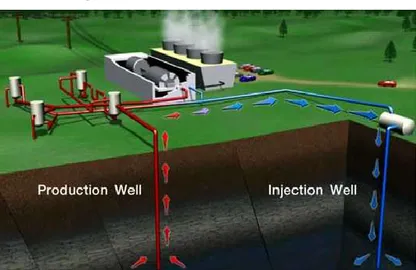
Geothermal power plants work with the same processes of the traditional power plants, by
using a Rankine cycle for the generation of steam for the turbines. The main difference is the source of the heat or the steam: instead of having a boiler where a combustion reaction is needed to generate the heat, in geothermal power plants the heat is collected by the ground where particular condition permits the generation of steam. Depending on the quality of the vapor there could be a direct or an indirect cycle.
Fig. 1.2-a – Geothermal power plant scheme
10
The most promising renewable sources for the future are surely wind and solar energy.
In the wind power plants (on-shore or off-shore) the air flows through the turbines causing a rotation that so generates electricity in the generators. Wind turbines can be with a vertical axis of rotation (VAWT) or a horizontal axis of rotation (HAWT). [1]
There’s a growing interest in putting them off-shore where the wind velocity is more constant and less affected by the landscape, even if there are much more electric energy losses due to the cables to reach the shore.
At the present time energy cost production are similar to the fossil fuels power plants, but the need of constant breezes does not permit a constant energy production.
Fig. 1.3 – Horizontal axis wind turbines (HAWT)
Solar energy can be used in two main different ways: using the heat generated by the sun
or using the energy power of the photons to directly generate energy.
Thermodynamic solar power plants are getting more and more importance in energy
production. The use of “molten salts” permits to store the heat received from the daily sun irradiation and to use it to generate steam for a Rankine cycle in order to generate electricity.
11
The main goal behind the energy storage systems in solar power is to consent the utilization of the energy generated by the sun beams also during the night time or during days of bad weather conditions, when the sun radiation cannot reach the ground.
Spain already uses this kind of power plants; at the beginning of 1980’s the “SEGS” project started the developing of thermodynamic solar power plants in the USA.
In Italy the “Archimede” project is developing a thermodynamic solar power plant that can store the heat also during night time and have a 24 hours energy production.
Fig. 1.4 – Thermodynamic solar power plant scheme
Photovoltaic systems are the most used technology to generate electricity from the sun.
The direct transformation in electric energy of the solar beams is the basis of the photovoltaic effect.
The energy received from the sun permits the electrons in the valence band to jump to the conduction band. If not “collected” the electrons would come back to the original position heating the material by releasing energy; by modifying the semiconductor that receives the irradiation it is possible to create an electric potential and use the “free electrons” generated by the sun beams to have an electric current.
Thanks to the policies for renewable energy power plants, photovoltaic generation has had a great expansion during the last years; the goal is to reach a power production percentage higher than the traditional power plants, and surely thanks to the new opportunities given by new battery systems or hydrogen generation to store energy during the overproduction times in daytime (to use hydrogen in fuel cells during the underproduction or the night-time) it is going to gain more weight in the next decades, also forecasting a greater efficiency and a reduction of cost production.
12
1.1.1 New frontiers in renewable energy production
There are some more ways to use renewable energy sources, but are still in a starting phase of development, and not yet commercialized.
Many ways to generate energy from oceans have been developed.
Tidal barrage power plants utilize the different heights of the sea level on the coast to fill
and vent some basins behind a dam, as for the re-pump hydro power stations (but in this case the higher basin is filled with the high tide of the sea).
Fig. 1.5 – Tidal barrage power plant
The ocean waves can be used to compress or expand rhythmically the pieces of the
Pelamis power plant, snake shaped that contains hydraulic pistons connected to generators.
13
The ocean waves can be also used to create wind for micro wind turbines by the compression and expansion of the air in some chambers semi-submersed.
Fig. 1.7 – Micro wind generator
The tides can be used also alternatively for the tidal stream generators: similar to undersea wind power plants they have the advantage of using a density 1000 times higher than the air.
Fig. 1.8 – Tidal stream generator
Ocean thermal energy conversion (OTEC) uses the temperature difference between warm
surface water and cold deep water. It’s a Rankine cycle using working fluids such as ammonia or R-134a. The small temperature difference permits a small quantity of energy generation, but it is very useful for desalination of water from the sea water.
14
Fig. 1.9 – OTEC power plant scheme
Osmotic power plants use the difference in salt concentration between the water of two
different basins.
Fig. 1.10 – Osmotic process
Saltwater is pumped into a pressure chamber. Fresh water, separated through a membrane is so introduced. The osmosis process makes the two levels flow till a balance is reached. By using the different height a turbine is used to let the levels back at the starting point.
A way of storing the heat of solar beams and generate electricity through a Rankine cycle are the solar ponds power plants: a pond is filled with salt in order to use the salinity differences to avoid convection inside the basin generated by the temperature differences that the heating from the sun causes at different heights inside the basin. By doing these the bottom of the basin reaches temperature higher also over 25 degrees more than the surface. A heat exchanger at the bottom can be used to operate an organic Rankine cycle.
15
It is more or less like a revers OTEC cycle, where the hot water is at the bottom of the basin. To maintain the temperature difference is necessary to control the salinity gradient of the basin for blocking the heat transfers due to convection. [2]
Fig. 1.11 – Solar pond power generator
The common issues with ocean power plants are the fouling and the corrosion of the systems that can affect the use of the power plants.
New generation wind power plants are under testing in these years.
The kite wind generator uses kites at high heights (almost 800 meters) to have more wind for the generation of electricity by using a turbine of 1600 meters of diameter rotating at 15
rounds per hours. The regulation is permitted by the change of heights of the kites (and so of the
16
Fig. 1.12 – Kite wind generator
The solar-wind towers are going to use evaporative towers to generate air flows that can be used for electric generation.
Fig. 1.13 – Solar-Wind towers
The future for sure is going also to nano electric generation.
An example could be piezoelectric flooring, a technology with a wide range of applications that is slowly being adopted in the race to develop alternative energy sources. The weight of the people walking (as in subways, stations or dance floors) or of the cars passing over a piezoelectric floor can generate electricity that, even if in small quantity, in places where there is a great number of cars or persons it could be considered a useful renewable energy source.
17
1.2 ENERGY PRODUCTION IN ITALY
Analyzing the reports released from the GSE (Gestore dei Servizi Energetici - Manager of Energy Services) and from TERNA (Trasmissione Elettrica Rete NAzionale - National Grid Electricity Transmission) (the official authorities on energy control in Italy), it is possible to have some ideas about the energy production in Italy.
The total amount of energy production in Italy is about 277,4 TWh. Italy imports about the 13,3% of the energy needed.
In the year 2013 the 16,6% of energy was generated by hydroelectric power plants, 13,3% by other renewable systems (photovoltaic, wind and geothermal) for a total of 30% of energy in 2013 generated by renewable sources.
Obviously these levels of energy production through the renewable sources of energy depend on the weather condition during the whole year above the country: the amount of rainfalls could assure an higher production from hydroelectric power plants though could affect negatively the energy production of photovoltaic systems that may miss an quantity of solar irradiation during the year. Only geothermal energy can keep constant levels during the years, due to a more stable source of energy for the electric generation.
The last 56,8% is so generated by traditional power plants. Italy has got more than everything turbo-gas and dense-oil power plants.
18
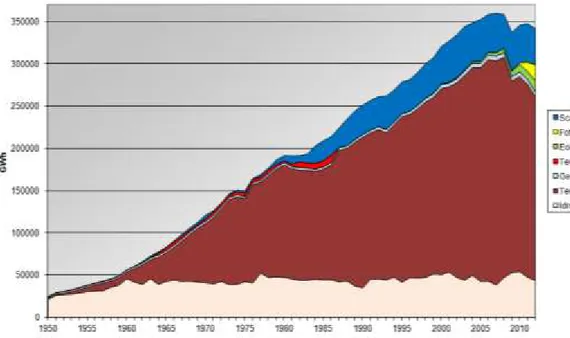
Looking at the historic tables it is possible to notice that renewable energy (wind and photovoltaic) in Italy started its production about 22 years ago, in 1992.
Fig. 1.15 – Energy production in Italy from 1982
The growth on power installed and energy production in the last four years has been enormous.
For the first time on June 16th 2013 for a couple hours during the morning all the electricity needs were covered totally by renewable power plants.
This result, even if obtained in a sunny and windy day all over the nation that raised the production of wind and PV systems, shows the huge importance of renewable power plants in Italian energy production that have been capable of covering the 100% of the grid energy request.
19
Fig. 1.16 – Renewable energy production in Italy
20
Fig. 1.18 – Renewable percentage in Italy
The policy of financing renewable energy systems produced the enormous growth and proliferation of these power plants in the energy production market.
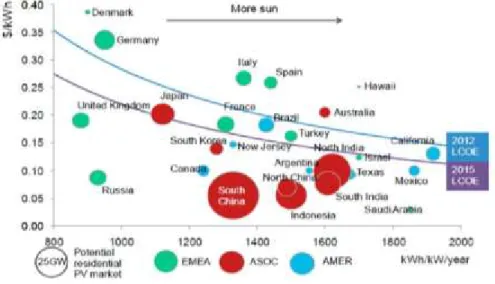
The “grid parity” is the point in which the cost of electricity generated with a power reaches the mean market price. The cheapest generation costs are actually the ones obtained with the traditional fossil-fuels power plants. The renewable power plants reached the same value thanks to economical incentives.
Reaching the grid parity means that (even without economical incentives) generating electricity via renewable power plants is as affordable as traditional systems. The grid parity has been already reached as shown in the figure below.
This means that photovoltaic systems can be competitive with the traditional power plants without the need of economic helps from the government.
21
The installation and energy production in the last years is shown below. The growth of the photovoltaic energy production has been massive thanks to the policies applied during the last 10 years in Italy to help the PV market to increase.[3]
Fig. 1.20 – Renewable power installed in Italy at 2012.
22
CHAPTER
2
SOLAR ENERGY
Every second 600.000.000 tons of Hydrogen are converted in 595.740.000 tons of Helium through the nuclear fusion reaction inside the Sun nucleus. After this process 4.260.000 tons of Hydrogen seems to have disappeared: the loss of mass has become energy following the Einstein relation E = mc2.
Fig. 2.1 – Nuclear fusion reaction scheme
The fusion reaction is:
4 1H → 4He + 2 e+ + 2 νe + 2 γ (26,7 MeV)
where: e+ is a positron; γ is a photon;
23
The energy generated every second is 3,83 × 1026 J , almost 112.500.000.000 TWh: the world consumption of electric energy in 2013 was about 25.000 TWh. In a second the sun produces enough energy to cover electric energy need on Earth for about 4.500.000 years.
The energy that reaches the Earth outside the atmosphere is about 1.370 W/m2. The atmosphere attenuates this value by absorbing o reflecting part of this radiation: on the surface of the earth it is considered a value of 1.000 W/m2, that is the value of the GNI (Global Normal Irradiation) used.
2.1 PHOTOVOLTAIC EFFECT
The emission of electrons by a surface irradiated with an electromagnetic radiation of a certain wavelength is called photovoltaic effect.
The electronic band structure theory describes the ranges of energy “allowed” to the electrons on atomic orbitals. The electrons fill the bands starting from the lowest energy required; the last band filled is the valence band, the first free band is the conduction band. The range between these two bands is known as band gap.
Different chances may occur depending on the nature of the material analyzed:
the last band is partially filled with electrons that may flow with high mobility through the last couple of similar energy bands (thus means that valence and conduction bands are overlapped): the material is conductive;
the last band is totally filled with electrons and there is an high band gap before the next energy level (about 5 eV): these are the non-conducting materials;
the last band gap is low enough to permit to the electrons of the last level to “jump” to the next energy level: the material is semi-conductive.
The photovoltaic effect happens on semi-conductive materials irradiated by an electromagnetic radiation with enough energy to permit the “jump” of the electrons and the creation of electrons-holes couples:
Ephoton = E ≥ Egap
24
The most common semi-conductor used in photovoltaic energy production is the Silicon, that has an Egap = 1,12 eV.
Considering:
speed of light c = 3 × 10⁹ m/s ; Planck’s constant h = 6,6 × 10⁻³⁴ Js
that means a wavelength max = 1,1 m.
The mismatch losses consider the different sensibility of the solar cell at different wavelength (for silicon the sensibility range is between 0,35 ÷ 1,1 m).
Fig. 2.2 – Photons with energy higher than 1,12 eV (i.e. with wavelength less
than 1,1 m) are all useful for the electrons to jump the semiconductor gap
When a radiation with enough energy reaches the semiconductor a certain number of electrons transit from a band to the other. To use these electrons it’s necessary to create an electric field in order to canalize the electrons and so have a current: in order to have this electric field the semiconductor is doped.
Fig. 2.3 – Band structure example: the blue light can excite with more energy (so an
25
For each electron that jumps from the valence to the conductive band a hole is created. There is so the presence of two different carriers that leads the charge and so the current.
Most of the semiconductor materials have tetravalent bonds, due to the four electrons in the valence band. Doping the material means to add small percentages of different atoms in order to change the properties of the material:
adding atoms of the fifth group (thus means with five electrons on the last band, such as phosphorus, antimony, arsenic) there is an increment in conduction electrons: this is the n-type doping;
adding atoms of the third group (thus means with three electrons on the last band, such as boron, indium, gallium) there is an increment in holes: this is the p-type doping.
Tab. 2.1 – Periodic table of elements extract
The material is globally electrically neutral, but there is a change in the number of free electrons. By contacting different doped materials there is a flux of electrons from the n to the p zone to reach the electric equilibrium: there is so the creation depletion region totally neutral and a built-in electric field at the boundary of this region.
26
When the photons hit the semiconductor there are three chances: being reflected, transmitted or absorbed.
These last are the useful ones, because these are the photons that can give the energy to the electrons to jump over the band gap.
Following the equation
R = T – A
(where R is the radiation reflected, T transmitted and A absorbed) it is possible to understand, by measuring the amount of radiation that passes through the layers of the solar cell, how much Irradiation can be used to generate the band transition.[4]
One of the most important goals of photovoltaic researches is to enhance the amount of absorbed radiation in the wavelength range useful to the permit jump and reflect or transmit all the other wavelengths that have too less or too much energy for our purpose.
By modifying the thickness of each layer or by the use of nanoparticles or nanowires or nanodots to change the properties of the different reflective or adsorption indexes it is possible to generate new materials with the aptitude needed in order to use as much as possible all the radiation received from the sun beams. [6] [7]
In this particular part of the photovoltaic research field there are two new promising kinds of solar cell: the up-converter and the down-converter (see next chapter).
There are so two different charge carriers: the electron on the conduction band, the hole on the valence band.
By connecting with a conductor the two zones is so created a closed circuit with a flux of electrons (generated by the lighting of the zone and orientated by the electric field) from the n-zone (at higher electric potential) to the p-n-zone: there is so the generation of a current.
27
The band gap of a semiconductor can be direct or indirect: the crystal momentum of the valence and the conduction band can be same, so that the photon can directly generate an electron without passing through an intermediate state where the momentum is transferred to the crystal and then the electron receives the energy to jump the gap.
Fig. 2.6a – Direct band gap sample.
Fig. 2.6b – Indirect band gap sample.
The adsorption of the photons is strictly bond to the kind of gap: the thickness of a PV cell can be much more thin for direct gap semiconductor as all the photons received can generate electrons without many losses in phonons or other energy losses due recombination on the grain boundaries or the defects of the material.
28
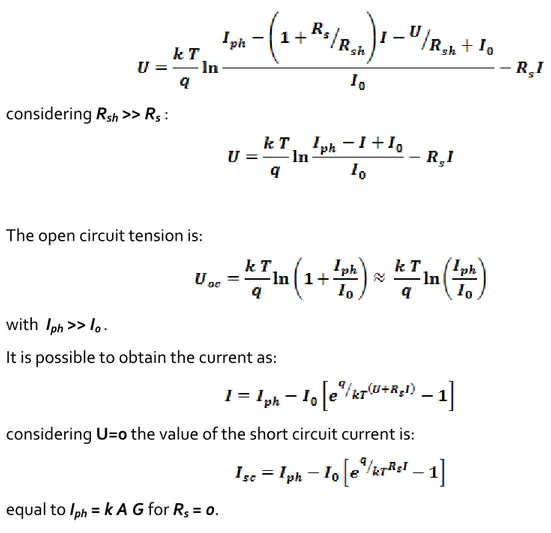
2.2 ELECTRICAL MODEL OF A PV-CELL
An equivalent electrical representation of the physics phenomenal that happens inside the photovoltaic cell is useful to better understand the effects of the different components.
Fig. 2.7 – Electrical model of a PV-cell.
The photovoltaic effect can be described with a current source Iph proportional to the cell
surface A, radiation received G, kind of cell used k:
Iph = k A G
The recombination electron-hole at the p-n junction interface can be represented by a diode D with its current Ij:
with:
• Io is the current with inverse voltage on the junction;
• Uj tension on the junction;
• q electron charge;
• K Boltzmann constant;
• T temperature of the junction;
• m coefficient of the junction.
29
Fig. 2.8 – I-V curve variation through illumination.
In the electrical model there are two resistances: the shunt resistance Rsh and the series
resistance Rs.
The shunt resistance represents the surface dispersions. It can be considered a current Ish = Uj / Rsh .
30
The series resistance is the sum of many internal resistance:
Fig. 2.10 – Series resistance electrical scheme.
Fig. 2.11 – I-V curve variation caused by series resistance.
With the resistances introduced the final current is so:
I = Iph − I j − Uj Rsh
and the tension becomes:
31 Making the substitutions:
considering Rsh >> Rs :
The open circuit tension is:
with Iph >> I0 .
It is possible to obtain the current as:
considering U=0 the value of the short circuit current is:
equal to Iph = k A G for Rs = 0.
In the graph current-tension it is possible to find the value of the maximum power point by intercepting the Isc and the Voc. The real curve considers Ij , Rsh and Rs .
Fig. 2.12 – I-V curve confrontation with the ideal rectangle Isc e Voc .
The missing area represents the Fill Factor.
The ratio between the ideal maximum power and the real maximum power is known as Fill Factor:
32
There are three major causes on the losses of photons received by the PV cell: photons with energy lower than the band gap ( hc/ < Egap );
thermalization losses due to photons with energy too much higher than the band gap ( hc/ > Egap );
internal losses represented by the Fill Factor.
In the picture below there is an example of a monocrystalline Silicon cell with Egap=1,12 eV.
The white rectangle is the maximum efficiency that can be reached by the cell.
Fig. 2.13 – Henry scheme of Si-mono losses.
Fig. 2.14 – PV cell losses analysis.
The efficiency of the cell can be so defined as:
33
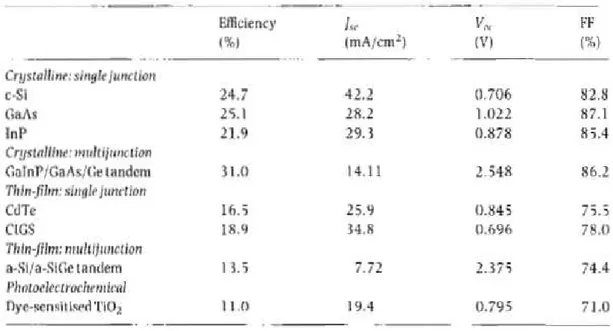
In the tab below there are the typical values for different PV cell technologies.
Tab. 2.2 – Values of g, ISC , VOC e Fill Factor for different kinds of PV cells.
The short circuit current and the open circuit tension are linked to the radiation G as shown:
where Iph = k A G for Rs = 0.
34
The temperature affects also the I-V curve with a raising of the current Iph and Isc with the
temperature; also the current of the diode raises up, reducing so the open circuit tension UOC (for
the crystalline silicon it reduces of about 4 % every 10 °C).
Fig. 2.16 – I-V curve variation caused by the variation of temperature T.
The curves of power and of efficiency are showed below: the point of maximum power point is also the point of maximum efficiency.
Fig. 2.17 – I-V curve and efficiency curve samples.
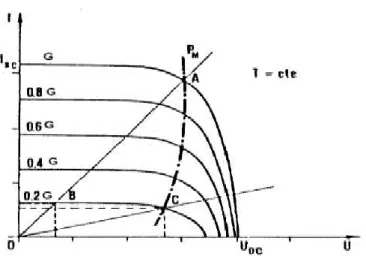
A maximum power point tracker MPPT is a resistor bank that optimizes the load to optimize the generation of energy.
35
Fig. 2.18 – MPPT curve. When the radiation becomes 0,2G the operating point goes from A to B. To
optimize the system the MPPT creates a resistance to let the cell work in the point C at higher efficiency.
The nominal operating cell temperature NOCT indicates the temperature of the module while functioning at open circuit, with an Irradiance I of 800 W/m2 and a wind speed v of 1 m/s,
atmosphere temperature Ta of 20 °C and Air Mass 1,5.
The value of the NOCT is useful to find the value of the cell temperature Tc in real
irradiance and atmosphere temperature conditions:
The thermal losses are a function of the Tc given by:
or
with: as the temperature coefficient (for monocrystalline Silicon modules 0,45 %/°C). The efficiency loss of the cell can be so reduced as following:
36
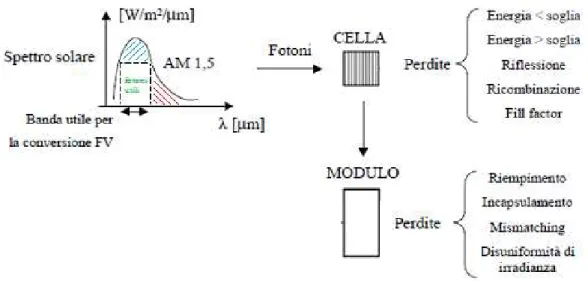
2.3 EFFICIENCY AND LOSSES OF A PV-MODULE
The PV module has many components that may cause efficiency losses that reduce the energy production of the system.
Each cell is connected with conductive material for collecting the electrons with ribbons connection with the other cells in order to have series or parallel connection.
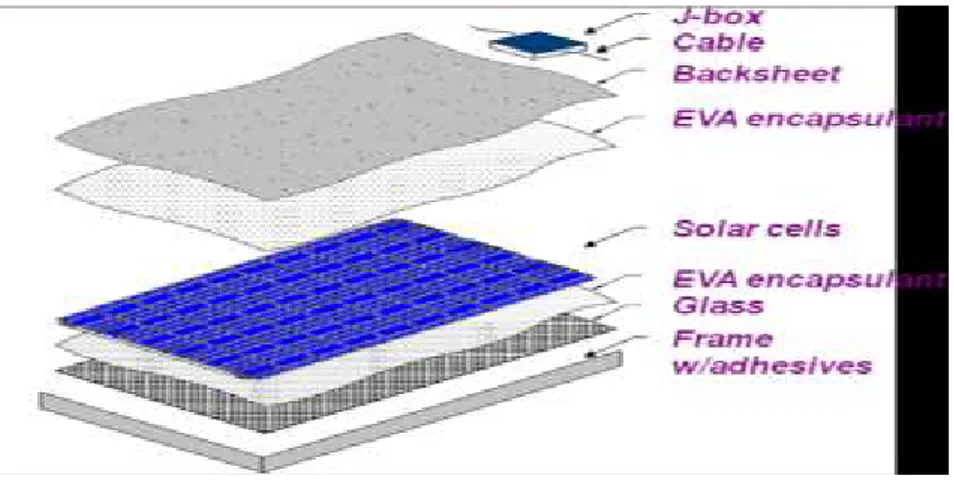
The up surface is a low thermal dilatation material (such as glasses or plastic polymers) and a layer of EVA (ethylene-vinyl acetate) to grant mechanical and thermal resistance. The back surface is usually aluminum, usefully for the fixing system for the roofs or trackers.
Fig. 2.20 – PV module components.
The global module efficiency ηglob can be defined as following:
η
glob = Pmax / Psunwhere Psun = G S (global irradiation and cell surface respectively), Pmax = Im Vm .
It can be considered as the product of different efficiencies:
η
glob =η
fillingη
encapη
irr filling efficiency: it considers that only the active part of the module (the
cells) generates electricity, while the rest of the module receives the radiation in not generating parts. It is defined as the ratio between the surfaces of the cell respect the surface of the (Scell / Smod) ;
37
encapsulation efficiency: is given by three more efficiencies:
η
incap =η
Cη
TRη
MIS• ηC is the conversion efficiency of the “naked cell”, without the glass on it;
• ηTR is the optical transmission efficiency that indicates the adsorption of the
materials interposed between the naked cell and the atmosphere;
• ηMIS is the mismatch efficiency, it considers the differences of the cells one
with each other at receiving the radiation.
uneven irradiation efficiency: it considers the not even radiation received
by the cells of the module.
Fig. 2.21 – PV cell and module losses analysis.
2.4 REFERENCE INDEXES AND LOSSES OF A PV SYSTEM
For the evaluation of the performances of the system it is useful to introduce some reference indexes that may give further more information than the efficiency.
These parameters can help to compare the performances of different PV systems in different location, with different technologies.
With the introduction of the Performance Ratio PR it is possible to evaluate the performance of the systems normalized on the radiation received and the power installed of the systems.
38
2.4.1 The Reference Yield - YR
For the evaluation of the PR two more indexes have to be introduced.
The first one is the Reference Yield (YR). It is the ratio between the Irradiation received
(direct or global, respectively EDNI or EGNI [kWh/m2]) and the reference irradiance DNI or GNI
(equal to 850 W/m2 for concentrating system or 1000 W/m2 for diffusion PV systems).
It’s a representation of the working hours at the reference irradiance and it is so measured in hours [h]:
h DNI E Y ref DNI R The Reference Yield (YR) is a function of location (irradiation received at a precise latitude),
orientation (i.e. azimuth angle), inclination of the array (tilt angle), weather condition during the year (shadowing and temperature condition).
2.4.2 The Array Yield - Yf
The second index is the Array Yield (Yf). It is the ratio between the Energy Production E
[kWh] of the system and the Power of the system Po [kWp] measured in hours h = [kWh/kWp]. It can be defined before or after the inverter in order to have the DC or the AC Array Yield:
kWhkWp P E Y o DC DC f _ or kWhkWp P E Y o AC AC f _
The Array Yield normalizes the energy production to the system dimensions and power.
2.4.3 The PERFORMANCE RATIO - PR
With the indexes introduced before the Performance Ratio PR is so defined as:
It can be evaluated before or after the energy conversion:
dim
_ a Y Y PR R DC f DC or
dim
_ a Y Y PR R AC f AC 39 It is dimensionless :
The performance ratio can so be used to define the different causes of losses of the PV systems:
mismatch;
back module temperature;
imperfect reception of the radiation; inverter inefficiencies;
DC and AC transmission losses; system malfunctions;
(the PR represents the ratio between the real and the expected production of the system).
The evaluation of the energy losses LC is so found using the relation:
Y Y kWhkWp Lc R DC
In this index are included the thermal losses for cell temperature higher than the NOCT, wiring, diodes, soiling, mismatch, MPPT faults, spectral losses.
The system losses LS as the difference of YR and YAC :
In this index are included all the other losses after the inverter.
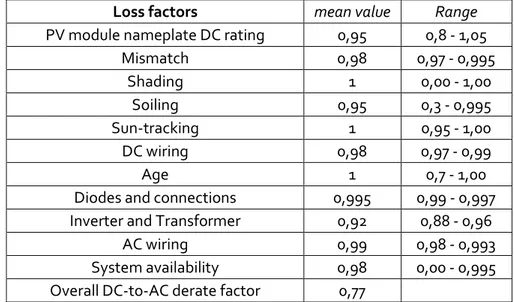
Loss factors mean value Range
PV module nameplate DC rating 0,95 0,8 - 1,05
Mismatch 0,98 0,97 - 0,995 Shading 1 0,00 - 1,00 Soiling 0,95 0,3 - 0,995 Sun-tracking 1 0,95 - 1,00 DC wiring 0,98 0,97 - 0,99 Age 1 0,7 - 1,00
Diodes and connections 0,995 0,99 - 0,997 Inverter and Transformer 0,92 0,88 - 0,96
AC wiring 0,99 0,98 - 0,993 System availability 0,98 0,00 - 0,995 Overall DC-to-AC derate factor 0,77
Tab. 2.3 – PV system mean efficiencies. For concentrating systems the performances of
the tracking system must also be considered.
Y Y kWhkWp Ls R AC
40
Fig. 2.22 – PV cell, module and system losses analysis.
2.4.4 Efficiency of the system DC
sist_DC2.4.4.1 M
ISMATCHThe solar radiation is composed by photons that have different energy levels in function of the wavelength:
where is the wavelength, h Planck’s constant, c is the speed of light.
Only for E higher than EG (energy gap) of the semiconductor it is possible the generation
of the couples electron-holes.
The design of the photovoltaic cells aims to use the most part of the radiation received to permit the electrons band jump, to create the conduction couples.
41
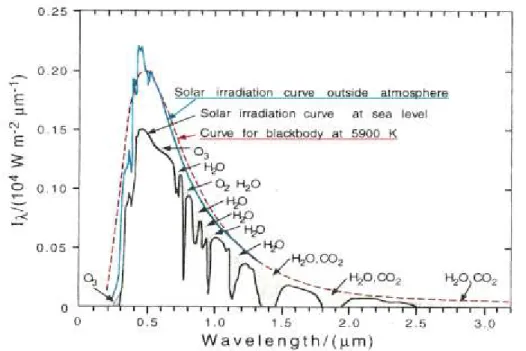
The radiation on the Earth surface is different by the complete spectrum of the Sun, considered as a black body with a mean temperature of K : outside the atmosphere (air mass
zero AM ) there is no absorption of the radiation, so the energy received is about kW/m ; inside the atmosphere the value of air mass considered is AM 1,5 and a radiation received of 1
kW/m2 after the absorption and reflection of the gasses in the atmosphere.
Fig. 2.23 – Black body radiation at the mean temperature of the Sun surface of 5900 K,
AM-0 radiation, AM-1,5 (Earth surface) radiation (in these last curve it is possible to notice the different molecules adsorption at different wavelength)
The air mass is a function of the incidence angle (it is the reason of the red light during the sunsets):
The real irradiation is different from the indoor tests, because of the adsorption of different wavelengths radiation due to gasses in the atmosphere, and so will be the response of the PV cell.
The multi junction cells are the more influenced by spectral mismatch, due to the fact that these cells are optimized at a specific wavelength that could be modified (adsorbed or reflected) by the atmospheric gasses.
Even to cells of the same kind could response differently at the same radiation due to differences in fabrication.
42
2.4.4.2 S
HADOWING OR SHADINGA monocrystalline silicon solar cell generates usually a tension of 0,5 V and a current of 0,25 mA/mm2 (a cell of 100 mm of diameter gives a current of 2,5 A).
The loads need much higher tension. In order to reach the tension needed by the load it necessary to make series and parallel of solar cells to raise tension and current.
Fig. 2.24 – Series and parallel connection of the modules.
As seen before at different radiation the cell changes the response in the I-V curve.
43
Considering a system made by some modules in series and in parallel connected as in the scheme below, the shadowing can change the behavior of the module from generation to load mode.
To avoid this behavior some by-pass diodes are introduced to let the current pass to another module by-passing the shadowed one.
Fig. 2.26 – PV cell behavior at shadowed conditions
In each module there are by-pass diodes to avoid the breaking reverse tension (about 15÷30 V for silicon cells), due to the sum of the tension of the following cells. The diodes are inserted each 30÷60 cells (each cell reaches a tension of about 0,5 V).
The ideal condition would be a by-pass diode each cell to optimize the module against the shadowing, but the costs are too high to create a system like this. To avoid the “hot spot” condition there are some by-pass diodes each module to bypass the shadowed cells, and in the system to bypass the shadowed/malfunctioning module.
The use of microinverter systems is a way to avoid shadowing problems and the need of having a minimum number of series modules to reach the activation tension of the string inverter for starting the conversion.
44
Fig. 2.27 – Bypass diodes on PV modules and strings
2.4.4.3 S
OILINGIt is almost the same effect of the shadowing: the radiation cannot reach the cell, so that there is part of the module that doesn’t produce but works as a load for the system. The shadowing permits to use the diffusive radiation (obviously not for the concentrating systems that uses only the direct irradiation); the soiling can block totally the radiation received until the next module cleaning. Not only dust or sand, but also snowing can be considered as a source of soiling for the module.
Soiling losses are usually about 5% of the total efficiency.
2.4.4.4 C
ONDENSATIONThe imperfect production of the module can cause the water condensation inside between the cell and the cover glass of the module. It has an effect similar at the shadowing or the soiling, but it is more serious because of the impossibility to operate inside the module.
Some modules are built with anti-condensation valves to balance the pressure between the inner part of the cell and the atmosphere.
45
2.4.4.5 S
UN-T
RACKINGSome PV systems are not roof fixed, but are fixed on mono o bi axial sun trackers in order to follow the sun during the day. For concentrating PV systems it’s necessary to have biaxial sun tracker in order to receive the direct irradiation on the concentrating lenses of the optical system to give a multiplied radiation to the cell surface.
The sun-tracking losses are due to the malfunctioning of the tracking systems. Each concentrating optics has a tolerance angle that should be not exceeded in order to have the correct focus of the radiation on the cell.
2.4.4.6 DC
WIRESFor the Ohm law there is a tension loss due to the resistance of the wires. For the Joule effect there is also a temperature raise. To avoid these losses it’s necessary to have wires as short as possible (DC wires more than AC ones).Wires losses are about 2% of the total.
2.4.4.7 A
GINGA feature of PV systems (crystalline silicon built) is a life time longer than 20 years. During the years there is a loss of efficiency of the system due to many factors that can affect the components of the system.
Thermal cycles, hard weather condition, radiation, humidity are for example some of the causes of deterioration of the PV modules.
One of the elements more exposed to ageing phenomenon is the polymeric cover of the module that can be affected by molecular breaks due to the UV radiation, physical breaks due to hard weather condition, etc. All this affects the optical transmission of the radiation to the cell.
The cell itself can be affected by molecular recombination of the doping inside the cell, displacement of the contacts due to thermal cycles during the years.
46
2.4.5 Efficiency of the system AC
sist_AC2.4.5.1 I
NVERTER ANDT
RANSFORMATION LOSSESA photovoltaic power conditioner is a conversion system as in scheme below:
Fig. 2.28 – Power conditioner scheme.
There efficiency of the conversion can be calculated on the Power or on the Energy: P = (PAC/PaDC)
where PAC is the outing power, and PDC is the entering power.
The MPPT optimizes the tension to maximize the outside power.
The efficiency changes during the lifetime of the system. In order to evaluate the correct behavior of the PV system there is the need to create a weighted efficiency WT :
with Ki :
;
47 it is:
where:
ER is the specific energy efficiency;
1/4, … , are the efficiency at different power levels.
Losses are about 4÷8% of the total amount.
2.4.5.2 AC
WIRES,
DIODES AND CONNECTIONSAs for the DC wires, also the AC wires cause losses due to Joule effect or Kirchhoff law.
2.4.6 Final efficiency
Different level losses are summed to evaluate the final efficiency of the system starting from the cell, to the module, to the array and after the conversion to the final system efficiency.
The conversion system is usually after the array, but the use of micro-inverter can reduce some of the losses and raise up the energy production.
48
Fig. 2.30 – Scheme of the components between the PV generator and the load.
The efficiency of the systems depends on many factors.
It is so fundamental to analyze every single loss factors to enhance the performances and raise the energy production.
2.4.6.1 S
YSTEM AVAILABILITYThe availability of the system is also as important as the efficiency: the occurrence of fails that blocks the production of the system affects the performances in the confrontation with other systems.
Bi-axial tracked or roof fixed systems, micro-inverter or string inverter, monocrystalline or multi-junction or amorphous systems have many differences and many fails occurrence prospects.
The optimum is obviously to find the best balance among costs, efficiency and availability with all the different technologies available.
49
CHAPTER
3
EVOLUTION OF PHOTOVOLTAIC
3.1 DIFFERENT KIND OF CELLS AND MANUFACTURING
During the last 40 years the researches have shown how many different paths can be followed to generate electricity from the sun beams through the photovoltaic effect.
Many kind of PV cells have been developed and an enormous enhance in efficiency has been reached.
There are some main categories in which PV cells can be divided: Silicon (mono-crystalline, multi-crystalline)
Thin-film (a-Si – amorphous silicon, CdTe – cadmium telluride, CdS, CIS, CIGS – copper indium gallium selenide, CZTS, GaAs – gallium arsenide)
Multi-junction
Emerging PV (dye-sensitized or Grätzel, quantum dot, organic, plasmonic)
It is of fundamental importance to understand which is the right placement for every kind of technology developed, which are the main aims and the cost limits.
The first PV cells developed had the aim to give power to the first satellites sent on orbit in order not to carry fuels for giving power to the systems. In a political contest in which conquer of the space had no match with economical views, it was of no importance how much high was the cost per kW of the single PV cell.
In time political contests changed and also the economy was delivered to other paths. Surely the space conquer had the enormous role to start the necessity of finding a way to generate energy from the sun beams; nowadays the environmental and economic necessities due to pollution and raising costs of electricity generation by the use of traditional power plants, have given a new “market pull” and a “technology push” to the photovoltaic research and development.
50
As shown in the graph below there are a lot of different kinds of PV cells. The highest efficiency reached in 2014 is about 44,4%.
Fig. 3.1 – Photovoltaic research cell efficiencies since 1975
These are results obtained in laboratory. Commercial solutions have much lower efficiencies, but also lower costs.
51
An analysis of the different cells can show where the costs and the efficiencies come from.
Fig. 3.2 – Photovoltaic cells and modules lab efficiencies, market diffusion in 2013
3.1.1 Silicon cells
The silicon cells are the most common kind of PV technology commercialized all over the world as shown in the graph above.
52
Fig. 3.3 – Monocrystalline and polycrystalline silicon solar cells
Silicon is a common element on earth as SiO2 is one the major component in the sand. The
different processes to obtain pure Si raise the cost production of the PV cells and so the final costs of the systems.
Metallurgical grade silicon is generated in electric arc furnaces at temperatures of about 1.800 °C. Through the following reaction it is possible to obtain 95% pure silicon.
SiO2 + 2C = Si_95% + 2CO
(cost of the silicon obtained is about 2,30 $/kg)
The Siemens process helps to obtain much pure silicon through reactions with HCl:
Si_95% + 3HCl = SiHCl3_98,9%(liq) + H2 (gas) + (SiH4) (must be avoid)
by distillation it is obtained SiHCl3_2 ppm (T~350°C )
SiHCl3_2 ppm (gas) + H2(gas) = Si_2 ppm(solid) + 3HCl (liq) (T~1100°C ) deposing pure microcrystalline Si
53
Fig. 3.5 – Siemens process stages
The positive doping process with Boron is made in the Silicon liquid during the refinement process.
The n doping is made through Electron Vapor Deposition, in a process in which the Phosphorus sublimates and is deposited on the Silicon surface by intermolecular diffusion.
The electronic grade silicon is even more refined than the metallurgic. It is commonly obtained through the Czochralski process.
By inserting a rotating bulk of silicon in the furnace, a cylinder of monocrystalline silicon is fused. The crystals created are 0,1÷1 ppm pure.
54
Another way to create a crystal is through the floating zone process: by using the recovered silicon sands, a magnetized spire molts the sand and fuse the crystal in a specific direction. The crystals are less oriented than the Czochralski process, but this process is cheaper, faster and permits the use of recycled material.
Fig. 3.7 – Floating zone process
The edge growth process works with the capillarity of a silicon solution to create the disk (that grows as multi crystal silicon).
Fig. 3.8 – Edge growth process
The cutting of the silicon disks are one of the major causes of material losses during the processes. About the 50% of the silicon has to be reinserted in the crystallization process after the cut, due to the small width of the cells (about 200÷300 for standard cells).
55
Fig. 3.9 – Cutting techniques with wire saws
Considering so the production process of a silicon module, the costs can be charged with the following percentages:
56
3.1.2 Thin film cells
The greatest advantages of using thin film cells are a reduction of material needed due to the very small thickness of the cells, a reduction of the costs and the enormous opportunities given by a flexible material that can change the view of how to utilize solar cells, giving surely an enormous numbers of new fields of utilization for the PV generation.
Fig. 3.11 – Thin film modules
On the other hand there are some issues to deal with and to overcome to gain more space in the PV market. More than the others we remember the reduced efficiencies and the materials used (some toxic, some not as common as the silicon).
One of the first thin film technology developed is the amorphous silicon cell.
The a-Si is a not crystallized silicon, much cheaper than the crystalline one but with worse efficiency. It has the benefit of a direct band gap and a higher absorption coefficient in the short wavelength range.
57
The a-Si has some dangling bonds that can be “filled” with hydrogen atoms to enhance the diffusion length and the mobility (that is lower than the crystalline silicon).
The energy adsorbed by the light during the first period of the lifetime can break the H-bonds and create again the defects avoided with the hydrogenation: the efficiency can reduce of about 30% during the first months.
The low efficiency is due to the defects that reduces the diffusion length of the generated charges.
To avoid this loss the use of an intrinsic layer among the p and the n layers can help to increase the diffusion length.
Fig. 3.13 – Amorphous cell characteristics
Even if efficiency reaches no more than 9%, the layer thickness of only 250 nm , against the 250 m of standard c-Si cells: this means a reduction in quantity of silicon used of 103, and a reduction of costs (even the manufacturing process is cheaper) that can justify this technology in the comparison.
58
Another thin film technology is the CdTe cells. The very low cost per W of about 0,6 $/W, the direct band gap (an energy gap of about 1,5 eV with a maximum wavelength of 825 nm) , the easy deposition methods (sputtering, vapor deposition, bath deposition) are the main advantages of this kind of PV cells, on the other hand the
Also the CdS cells have similar proprieties, with the advantage of low temperatures for the manufacturing of the cells, and the spray-coating system for the deposition on the support layer.
Cadmium can be toxic and the efficiencies are about 10% (with a theoretical limit of 29%).
The CIS (CuInSe2) or the CIGS (Cu[In, Ga]Se2 cells have the advantage that the intrinsic defects of the materials have the effect of a p doping, and that an impure material has not great difference in energy performances from the pure ones. The indium shortage could be a problem in the future, but nowadays these kinds of modules are not so diffused. The price of the module is much higher than the CdTe cells, but the efficiency can reach values around 16%. The band gap goes between 1,04 2,7 eV, giving the chance to use a very large wavelength range.
To eliminate the Indium dependence the cells can be made differently: CZTS cells (Cu2ZnSnS4), but the efficiency is still around only 7%.
The GaAs cells can assure very high efficiencies, but the cost of the cell is expensive due to the material uses. It is mostly used on space PV cells.
59
3.1.3 Multi junction cells
The multiple junction cells can separate on different materials the adsorption of the radiation, so that each part of the cell is optimized for the right wavelength radiation.
Fig. 3.14 – Multi-junction cells: a) Prismatic beam splitting and spatial division; b) and c) Stacked mj-cell
Fig. 3.15 – Stacked mj-cell
60
Fig. 3.16 – The quantum efficiency is the ratio (at the specific photon energy considered) between the
current per square centimeter generated and the incident photon flux QE = j / ef . The three different junctions are optimized for the different wavelengths, so that the total efficiency increases.
3.1.4 Emerging PV cells
The “Dye Sensitized Solar Cell” or “Grätzel cell” are electrochemical photovoltaic generators. Two transparent electrodes contain a porous layer of TiO2 covered with a molecular
dye that absorbs the sunlight: the photons excite the electrons of the organic dye that through the TiO2 are conducted to the electrodes. The main issue is the liquid electrolyte that causes
instability outside a strict range of temperature.
The efficiency can reach about 15%, thanks to a great quantum efficiency that permits the conversion in electrons of about 90% of the photons. Although the temperature instability, the degradation caused by high energy radiation and so the short lifetime of the systems can be an enormous limit to this technology, the cheap production costs, the high QE and the theoretically feasibility of the cell production are very attractive for these systems.
61
There are some other ways to raise the efficiency of the solar cells: the use of middle energy levels between the two bands to reduce the energy needed by the electrons to jump the gap is the idea behind multi quantum well, quantum dot solar cells.
Fig. 3.18 – Examples of multi quantum well (on the left) and quantum dot (on the right) solar
cells: both the generators have been made with the aim of creating an intermediate band or by the use of interposed material, or by the use of nanocrystals with spatial dimension near to the wavelength of the radiation received.
The creation (through doping, through nanocrystals rightly positioned, through the interposition of a layer of a specific material) of an intermediate band enhances the quantum efficiency of the cell and permits the generation of many more couples electron-hole improving the performances in terms of quantum efficiency and energy efficiency.
Fig. 3.19 – Intermediate band sample.
The idea of improving the quantum efficiency is also behind the up converters and down
converters solar cells.
Instead of reflecting or being transparent to the photons too less with or too much energy, there is the chance to combine together two low energy photons (2 photons with h< Egap = 1
62
with h> Egap) in order to generate photons with the needed energy to create the charge carriers
needed for the generation of electricity.
Combining two photons not enough energetic to permit the jump (i.e. h < Egap ) by the
use of ”mirrors” behind the cells, permits to recover lost photons and to enhance the efficiency of the cell.
Fig. 3.20 – Up converters systems aim to combine together all the photons less energetic
than the band gap value to raise the quantum efficiency.
Splitting a too much energetic photon (i.e. h > Egap ) to avoid the thermalization caused
by the excess of energy is the way of the down-converters cells. Reducing the thermalization, the cell temperature gets lower and so the efficiency raises.
As for the “up converters”, the idea is to have a cell transparent to high energy photons that will reach a surface behind the cell.
63
This surface would thermalize and re-emit the radiation at the right wavelength for the cell (ThermoPhotovoltaic TPV).
Fig. 3.21 – Down converters systems aim to split all the photons more energetic
than the band gap value to raise the quantum efficiency.
3.2 CONCENTRATED PV SYSTEMS
A way to reduce the cost of the system is using less active material. The idea is to concentrate the radiation on smaller surfaces by the use of optical systems; doing so it is possible to use a small quantity of the best efficiency cells (that are usually the most expensive).
The other side of the coin is that the use of concentrated radiation needs a bi-axial tracking system in order to have the beam always focused on the solar cells, losing so the diffuse part of the global radiation.
This is the theory behind the concentrated PV systems.
The more complicated systems (mostly due to the trackers) pushes this technology to an industrial production more than a residential one.