http://dx.doi.org/10.12988/ref.2016.623
Analysis of the Factor that Affect Tourist
Satisfaction: A Case Study on
“The Most Beautiful Sicilian Borghi”
Romana Gargano and Filippo GrassoDepartment of Economics, Piazza Pugliatti, 1 University of Messina, Messina - 98122, Italy
Copyright © 2016 Romana Gargano and Filippo Grasso. This article is distributed under the Creative Commons Attribution License, which permits unrestricted use, distribution, and reproduction in any medium, provided the original work is properly cited.
Abstract
The objective of this paper is to identify the factors of tourist's satisfaction and loyalty to the tourist destinations of circuit "The most beautiful Sicilian Borghi". In particular, we explore the relationship between the declared satisfaction levels, the tourist profile and the features of the trip and we try to identify the factors that determine the choice of a return visit. For these aims, we apply an ordered logit approach. The results show that age, country of origin and type of tourist's service and facilities used, increase the degree of the overall satisfaction; and that the satisfaction derived from Sicilian food, price of trip and historical scenery of place has the largest influence on the return intention.
Keywords: Ordered logit model, Tourist satisfaction, Borghi
1 Introduction
The continuous development of new tourist destinations and the growth of the existing ones impose the need for continuous and responsible destination management in order to achieve and maintain an appropriate level of competitiveness. Tourism competitiveness is an ability of destination to meet visitor needs on various aspects of the tourism experience (Ritchie, Crouch, 2000)
which means that competitive position of a destination on the tourism market, depending on which and how well the destination resources are managed.
In recent years, many studies have elaborated proposals for defining and measuring the competitiveness of a destination (Mazanec et al., 2007). Most of them aimed at estimating of the factors influencing competitiveness at the country level, less attention been paid to the local level, especially in the quantitative studies. It is widely accepted that the competitiveness of tourist destinations is based on sustainability of their natural, economic and cultural resources.
Many scholars have indicated the valuation of tourists perceptions relating to accommodations, foods, and services as a very important factor to increase the satisfaction and to influence the choice of destination and the decision to return. Since 1960s in the last century, the scholars have conducted a great deal of research on tourist satisfaction from the perspectives of quality management and repurchase intention. Pizam et al (1978), pioneered in applying the concept of customer satisfaction in the tourism study have defined tourist satisfaction as the results of the comparison between “a tourist’s experience at the destination visited and the expectations about the destination”. Since then numerous authors have analysed this field also from a point of view of the theoretical models. Qu and Ping (1999) consider a logistic model for estimating the likelihood of going on a cruise in Hong Kong and use tourist satisfaction data as explanatory variables. Oliveira and Pereira (2008), employs an ordered probit model to examine how the sociodemographic characteristics of tourists and the different aspects of the trip affect the tourists’ evaluation of 30 different aspects of the destination. Hosegua (2010)considers a Bayesian estimation of the multivariate ordered probit model using a Markov chain Monte Carlo (MCMC) method in order to investigate the tourists satisfaction experienced. Salleh et al (2014) and Silvestre et al. (2008), for example, employ structural equation models and Factorial analysis for examining a tourist satisfaction. Neethiahnanthan et al (2014) seeks to contribute to the literature on tourists’ perception by evaluating the relationship between destination travel attributes and tourist satisfaction. They use Partial Least Square (PLS) in order to investigate the influence of travel attributes on satisfaction and the moderating effect of demographic factors in the relationship between travel attributes and tourist satisfaction.
This paper discusses the case of visitor satisfaction the most beautiful villages (Borghi) of Italy in Sicily as a tourist destination cultural and gastronomic. In their new role, “Sicilian Borghi” are turning into strong attractors of tourism while being able to preserve local historical memory. The brand “Sicilian Borghi”, either rural or coastal, must be considered as capable of a competitive value that generates a network system and shows a positive synergy that goes well beyond their fragmentation and geographical distinction; they represent an effective system of tourism destination all year. The purposes of the study were to identify tourists’ demographics and travel characteristics, investigate the determinants of satisfaction by tourists who visited the most sicilian beautiful Borghi and the relationship between the likelihood of return visit
depen-dent variable, we propose an approach based on ordered logit model. The structure of the paper is now outlined. The next section provides a description of the data used and is followed by a outlining the methodology. The penultimate section provides the empirical results and a final one provides a summary with some concluding remarks.
2 Methods and case study
2.1 Study Design, Sample and data collection
The Sicily’s environmental heritage is a fundamental resource that gives further benefit to the entire regional system. The protected areas within the regional territory consist of five regional parks (7.2% of the territory of the region), and 72 regional nature reserves (3.3% of the regional area), 6 marine protected areas. Monuments and museums are present in all provinces, in big cities and in small villages, displaying a sign that ancient civilizations have left: 261 museum and 41 monumental archaeological sites, 7 sites listed in the UNESCO World Heritage List. Furthermore, the are 18 small towns that belong to the circuit of the Most Beautiful Villages of Italy (from here on Borghi).
In this paper, we have focused the analysis on the Most Beautiful Borghi of Italy, one of the several territorial brands present in the Sicilian Region; in fact, many authors have indicated the territorial brand as a competitive factor for promoting the territory as tourist destination.
The survey is conducted every Saturday and Sunday since April 15 to June 15, 2015 in all Borghi (Castelmola, Castiglione di Sicilia, Castroreale, Cefalù, Erice, Ferla, Gangi, Geraci Siculo, Montalbano Elicona, Monterosso Almo, Novara di Silicia, Palazzolo Acreide, Petralia Soprana, Sambuca di Sicilia, San Marco d’Alunzio, Savoca, Sperlinga e Sutera). In order to guarantee the representativeness of the population, a convenient stratified random sampling was employed, according to the criteria of significant location in the most beautiful Borghi of Italy in Sicily. In each strata (Borgo), the number of subjects were selected proportionally based on some variables like popularity, frequency of visiting by the tourists. The proportions of male and female interviewees of the group were the same, and they were evenly distributed among the following cohorts: 18-35, 36-45, 46-60 and over 60 years old. The questionnaire was developed in Italian, English, French, German and Spanish. The survey was conducted using the self-administrated questionnaire. In order to reduce errors or misinterpretations in reading questions, several trained assistants were employed in each place to help the interviewees to fill out the questionnaire completely. 280 questionnaires were collected. The questionnaire used for this study consisted of three sections. The first section covered the demographic profile of the respondents (age, gender, marital status, geographical origin) and the second section adopted the travel features in terms of travel company, transportation facilities, and tourist’s facilities. The third section contained questions relative to the satisfaction of respondents and the likelihood of return. According to literature
(Tonge and Moore, 2007) we used a 5-point Likert-type scale (1= very dissatisfied to 5= very satisfied) about the valuation of perception related to the statements given in section two and three for the most beautiful Borghi of Sicily. 2.2 Statistical model
In this section, we briefly describe the statistical method uses. An ordered logit model (McCullagh and Nelder, 1989, Greene, 2003) is used to estimate the relationships between the visitor’s satisfaction (ordinal dependent variable) and a set of independent variables.
Let yi represent an observable discrete ordinal variable coded 1, 2,…,5 (1=very dissatisfied, …, 5=very satisfied) based on responses to the satisfaction question. A line of approach would be to assume that the ordinal variable is the discretized version of an underlying continuous variable, which depends on covariates as in a linear regression model. More precisely, let yi* denote an unobservable (latent) variable that captures the satisfaction level of the individual
i. The satisfaction outcome can be express as a function of a vector of explanatory
variables (xi) using the following linear relationship: 𝑦𝑖∗ = xi'β+ 𝝐
𝑖 where 𝝐𝑖~𝑁(0,1) and i = 1,..., n (1) and where β is a vector of unknown parameters. It is assumed that 𝑦𝑖∗ is related to the observable ordinal variable yi as follows:
𝑦𝑖 = 𝑗 𝑖𝑓 𝑦𝑖∗ ∈ (𝛾𝑗−1, 𝛾𝑗] 𝑗 = 1, 2, … . , 𝐶 = 5 (2) where 𝛾𝑗 is the cutoff of the jth ordinal response. In particular:
yi= 1[very disatisfied] if -∞<yi*<γ 1 yi= 2[disatisfied] if γ1<yi*<γ
2 ⋮
yi= 5[very satisfied] if γ4<yi*<+∞
In general, the probability that observation i will select alternative j is: pij = p(y𝑖 = j) = p(γ𝑗−1 < yi* ≤ γ 𝑗) = F(γ𝑗 − xi'β) − F(γ𝑗−1− xi'β) = = 𝑒𝛾𝑗−xi'β 1+𝑒𝛾𝑗−xi'β− 𝑒𝛾𝑗−1−xi'β 1+𝑒𝛾𝑗−1−xi'β (3)
The equation (3) refers to the logit specification of distribution of error 𝝐𝑖 and where F(·) denotes the logistic cumulative distribution function operator. The parameters of the model are estimated by the maximum likelihood methods. Note that the estimated coefficients β provide information about the sign of relationship between the latent variable y* and the regressors.
3. Results and discussion
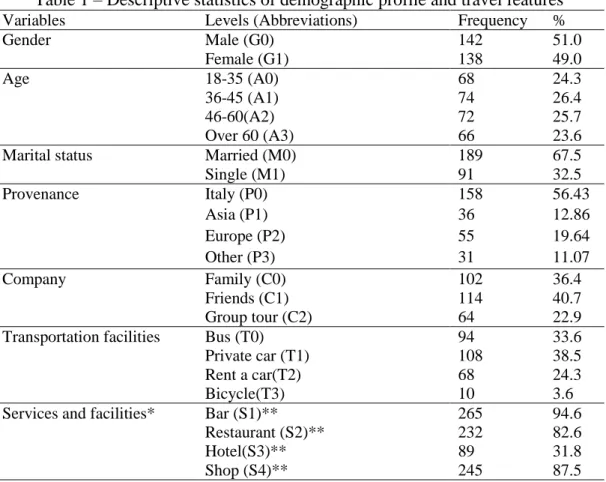
Table 1 provides the frequencies and percentages of the unit records under each category. Table 2 provides the percentages of the degree of satisfaction regarding
the items pertaining to each aspect of the trip. We perform the empirical analysis in two blocks. In the first part, we study the impact of demographic and travel features variables on the individual aspect of trip satisfaction and on the overall satisfaction of tourists. We assume that visitors of the most beautiful Borghi choose one of the mutually exclusive alternatives characterised by a categorical variable. This variable reflects five distinct ordered alternatives: Very dissatisfied (j = 1), Dissatisfied (j = 2), Neutral (j = 3) Satisfied (j = 4) and Very Satisfied (j =5).
Table 1 – Descriptive statistics of demographic profile and travel features Variables Levels (Abbreviations) Frequency %
Gender Male (G0) 142 51.0 Female (G1) 138 49.0 Age 18-35 (A0) 68 24.3 36-45 (A1) 74 26.4 46-60(A2) 72 25.7 Over 60 (A3) 66 23.6
Marital status Married (M0) 189 67.5
Single (M1) 91 32.5 Provenance Italy (P0) 158 56.43 Asia (P1) 36 12.86 Europe (P2) 55 19.64 Other (P3) 31 11.07 Company Family (C0) 102 36.4 Friends (C1) 114 40.7 Group tour (C2) 64 22.9
Transportation facilities Bus (T0) 94 33.6
Private car (T1) 108 38.5
Rent a car(T2) 68 24.3
Bicycle(T3) 10 3.6
Services and facilities* Bar (S1)** 265 94.6
Restaurant (S2)** 232 82.6
Hotel(S3)** 89 31.8
Shop (S4)** 245 87.5
*multiple response variable with percentages that add up to more than 100%. **binary variables (yes/not)
Table 2 – Satisfaction for each question of questionnaire (% frequence)
Question 1 2 3 4 5 Sicilian Food (F_S) 1.2 5.1 12.6 22.8 58.3 Cleanness(C_S) 11.2 15.2 35.9 22.6 15.1 Tourist.s facilities (T_S) 6.2 8.3 38.3 31.3 15.9 Friendliness (FP_S) 4.3 5.1 33.2 34.1 23.3 Natural Place (N_S) 0.8 1.5 16.8 48.6 32.3 Historical Place (H_S) 0.7 1.3 15.4 49.3 33.3 Price (P_S) 0.8 1.9 19.9 47.3 32.8 Overall (O_S) 0.4 1.2 16.4 39.5 42.5
To avoid multicollinearity and variance problems we apply Variance Inflation Factor (VIF) test. The independent variables show values lower than 5, allowing us to reject the hypothesis of correlation between them. Heteroscedasticity hypothesis is tested with Breusch-Pagan test, with a p-value of 0.0495, we can reject the null hypothesis of heteroscedasticity at 95% level of confidence and use of robust estimators in our multinomial ordered logit is appropriate. We apply the multinomial logit model in order to evaluate the impact of the tourist‘s socio - demographic and trip characteristics on their likelihood to choose one of the all categories of the satisfaction. Table 3 reports the coefficient estimation results. The independent variable transportation facilities is not reported because in all models is not statistically significant. The results of our models shown that:
The degree of overall satisfaction is influenced by sex (the females are significant higher degree than males), age (the probability of answering “very satisfied” increases with age, in particular 40-60 and >60 years), and provenience (the experienced by Europeans are significant higher degree than experienced by Italian) visitors). With respect to tourist’s services and facilities, the use of bars and restaurants increase significantly the satisfaction.
The degree of Sicilian food satisfaction is negatively influenced by travel company (the visitors’ satisfaction that joined a group tour is lower than the tourists who are in family or friends’ tour) and by provenience, (the Asian visitors have lower degree satisfaction than Italian. The results show, also, that the males are significant higher degree than female, and that the young people are less satisfied than the tourists of more than 46 years. The probability of answering “very satisfied” increases with the use of bars and restaurants.
The degree of cleanness satisfaction is determined by nationality (the European are significant lower degree of satisfaction than Italian visitors) and by sex, (the females are lower satisfied degree than the males). With respect to tourist’s services and facilities, the use of bars and hotels increase significantly the satisfaction.
The degree of tourist facilities satisfaction is influenced by services and facilities use. In particular the probability of answering “very satisfied” increases with the use of bars, restaurants and hotels.
The degree of friendliness local people satisfaction depends by company and use of restaurants and shops: the probability to be “very satisfied” increase with use of these services and with organization the tour with friends or group organized.
The degree of natural place satisfaction depends by nationality and age of visitors. In particular, the probability of answering “very satisfied” increases with age (>46 years) and with be of Asian origin.
The degree of historical place satisfaction is related with age and gender. The fact of being woman slightly increases the probability of answering that she is satisfied. The probability of answering “very satisfied” increases with age and decreases with the stay in hotel.
The degree of price satisfaction statistically increase with marital status (the single people are slightly more satisfied) and with use of tourist’s services and facilities (bars restaurants and hotels).
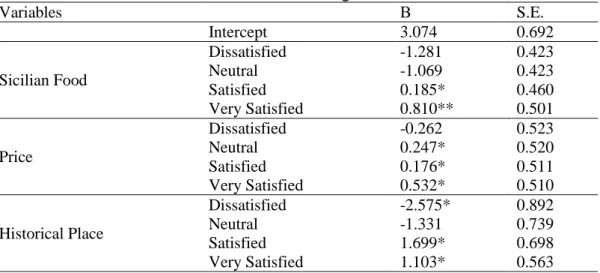
Table 3 – Coefficients and p value (under in italics) of ordered logit models Variables O_S F_S C_S T_S FP_S N_S H_S P_S Intercept 3.558 1.193 2.781 -0.94 3.412 1.195 1.278 2.798 0.000 0.329 0.019 0.412 0.003 0.325 0.239 0.098 (G1) 0.183 -0.521 -0.232 0.343 0.197 0.132 0.131 -0.498 0.045 0.041 0.048 0.453 0.342 0.213 0.019 0.143 (A1) -0.224 -0.127 0.542 0.654 0.123 0.764 1.164 1.102 0.321 0.112 0.132 0.143 0.144 0.143 0.089 0.054 (A2) 0.541 0.714 0.123 0.543 -0.324 0.128 0.321 0.132 0.009 0.004 0.099 0.101 0.111 0.032 0.003 0.063 (A3) 0.765 0.543 0.432 0.234 0.187 0.543 0.432 0.123 0.001 0.002 0.102 0.333 0.101 0.001 0.001 0.115 (M1) 0.198 0.234 0.543 0.188 1.061 0.641 0.154 0.411 0.176 0.231 0.221 0.099 0.101 0.112 0.101 0.001 P1 -0.214 -0.341 0.321 0.021 0.321 -0.132 -0.112 -2.135 0.132 0.000 0.112 0.121 0.099 0.148 0.454 0.346 (P2) 0.388 0.325 -0.335 0.431 0.412 0.321 0.312 -0.521 0.002 0.432 0.001 0.135 0.098 0.041 0.095 0.097 (P3) 0.201 0.541 0.132 0.342 0.542 0.143 0.321 -2.576 0.144 0.121 0.233 0.129 0.132 0.017 0.165 0.301 (C1) 0.299 0.128 0.332 0.453 0.325 0.254 0.432 0.132 0.432 0.143 0.222 0.213 0.003 0.311 0.431 0.121 (C2) 0.231 -0.324 0.432 0.141 0.331 0.551 0.543 0.222 0.117 0.000 0.321 0.321 0.001 0.094 0.101 0.211 (S1) 0.432 0.222 0.431 0.332 0.141 0.231 0.121 -0.321 0.000 0.000 0.000 0.001 0.101 0.103 0.112 0.007 (S2) 0.532 0.764 0.122 0.551 0.541 -0.123 0.219 0.543 0.001 0.001 0.121 0.000 0.000 0.099 0.112 0.000 (S3) 0.189 0.111 0.231 0.121 0.452 -0.132 -0.139 0.221 0.102 0.100 0.000 0.000 0.001 0.132 0.022 0.001 (S4) 0.199 0.201 0.122 0.190 0.312 0.101 -0.221 0.189 0.009 0.232 0.342 0.321 0.000 0.234 0.335 0.214 In the second part, in order to analyse the variables that affect the likelihood of a return visit on one of the most beautiful Sicilian Borghi, a binary logit was performed. The full model include seven independent variables (Satisfaction from Sicilian food, Satisfaction from cleanness, satisfaction from price, satisfaction from tourist’s facilities, and satisfaction from natural and historical place). We selected the best model using Akaike Information Criteria. As reported in table 4, the satisfactions from food, price and historical place made a statistically significant contribution to the model. In particular, the strongest predictor of reporting a favourable attitude towards a revisit to the tourist destination of Sicilian Borghi was satisfaction from the food, recording an odds ratio of 2.25.
This indicate that visitors who have been very satisfied with the food were 2.25 times more likely to report an attitude to revisit the Borghi, than those who have been very dissatisfied with the food. Another important predictor was the satisfaction from price of visit, in fact an odds ratio 1.70 indicating that visitors who have been very satisfied of the total cost of the visit were 1.70 more likely to return respect the visitors that were very dissatisfied. The Table 4 reports the results of the logistic regression:
Table 4 - Results of logit model
Variables Β S.E. Intercept 3.074 0.692 Sicilian Food Dissatisfied -1.281 0.423 Neutral -1.069 0.423 Satisfied 0.185* 0.460 Very Satisfied 0.810** 0.501 Price Dissatisfied -0.262 0.523 Neutral 0.247* 0.520 Satisfied 0.176* 0.511 Very Satisfied 0.532* 0.510 Historical Place Dissatisfied -2.575* 0.892 Neutral -1.331 0.739 Satisfied 1.699* 0.698 Very Satisfied 1.103* 0.563 (*) and (**) indicate parameter significance at the, 5 and 1 per cent level, respectively
Concluding remarks
In this paper, we analysed the degree of satisfaction experience by visitors of the most beautiful Sicilian Borghi, using data collect in our sample survey. We have considered the effects on the degree satisfaction of the demographic characteristics of the visitors and the type of trip and, we have investigated the relationship between the variables that affect the likelihood of a return visit on one of the most beautiful Sicilian Borghi.
In general, the results have shown that the degree of overall satisfaction depends by sex, age and provenience and, with respect to tourist’s services and facilities, the use of bars and restaurants increase significantly the satisfaction. In addition, we have shown that the satisfactions from Sicilian food, price of trip and historical place made a statistically significant contribution to return visit.
These results can be help to improve our knowledge of visitors’ attitudes and perceptions affecting their vocational choices, allowing in this way policymakers and tourism economic agents to tailor policies aimed at increasing tourist/visitor satisfaction and loyalty actions for these important holiday destinations. In fact, it is important considered that the brand “The most beautiful Borghi of Italy” is capable of a competitive value that generates a network system and shows a positive synergy that goes well beyond their fragmentation and geographical distinction; they represent an effective system of tourism destination all year.
References
[1] W.H. Greene, Econometric Analysis 5th ed., Upper Saddle River: Prentice Hall, 2003.
[2] J.A. Mazanec, K. Wöber and A.H. Zins, Tourism destination competitiveness: From definition to explanation?, Journal of Travel Research, 46 (2007), no. 1, 86-95. http://dx.doi.org/10.1177/0047287507302389
[3] P. McCullagh, J. A. Nelder, Generalized Linear Models, Second ed., London: Chapman and Hall, 1989.
[4] A. R. Neethiahnanthan, H. Subramonian, S.P. Sharif, Tourists’ perceptions of destination travel attributes: An application to International tourists to Kuala Lumpur, Procedia - Social and Behavioral Sciences, 144 (2014), 403-411. http://dx.doi.org/10.1016/j.sbspro.2014.07.309
[5] H. Qu, E.W.Y. Ping, A service performance model of Hong Kong cruise travelers’ motivation factors and satisfaction, Tourism Management, 20 (1999), 237-244. http://dx.doi.org/10.1016/s0261-5177(98)00073-9
[6] P. Oliveira, P.T. Pereira, Who values what in a tourism destination? The case of Madeira Island, Tourism Economics, 14 (2008), 155-168.
http://dx.doi.org/10.5367/000000008783554758
[7] A. Pizam, Y. Neumann and A. Reichel, Dimentions of tourist satisfaction with a destination area, Annals of Tourism Research, 5 (1978), no. 3, 314-32. http://dx.doi.org/10.1016/0160-7383(78)90115-9
[8] J.R.B. Ritchie, G.I. Crouch, The competitive destination: A sustainable perspective, Tourism Management, 21 (2000), no. 3, 1-7.
[9] N.H.M. Salleh, A.N Zarul, R. Othman, and S.H Mohd Idris, Determinant Factors and Tourist Satisfaction Index: A Case Study at the Pulau Kapas Marine Park, Advances in
Natural and Applied Sciences, 8 (2014), no. 1, 5-11.
[10] J. Tonge, S.A. Moore, Importance-satisfaction analysis for marine-park hinterlands: A western Australian case study, Tourism Management, 28 (2007), 768-776. http://dx.doi.org/10.1016/j.tourman.2006.05.007
[11] A.L. Silvestre, C.M. Santos and C. Ramalho, Satisfaction and behavioural intentions of cruise passengers visiting the Azores, Tourism Economics, 14 (2008), 169-184. http://dx.doi.org/10.5367/000000008783554802