Strategic planning of biomass and bioenergy technologies
Abstract
The design of sustainable, environmentally friendly energy systems which have adequate capacity
is a critical challenge faced by nations across the globe. This challenge is compounded in
developing countries, which contain with remote areas yet to be connected to the grid, an
over-dependence on conventional sources of energy, a shortage of financial resources, and, limited
supporting policies and legislation.
The objective of this thesis is to develop methods for strategic planning of biomass and bioenergy
technologies in developing countries. The approach followed is to start from the general and move
to the specific. After a general formulation of methods, an exemplary case study of Colombia is
presented.
The formulated methods cover four main areas. Firstly, a method to estimate the current biomass
energy potential and its uncertainty at a country level is formulated when availability and quality of
data are limited. For this purpose, a bottom-up resource-focused approach with statistical analysis
using a Monte Carlo algorithm is proposed. Secondly, a method to estimate the future biomass
energy potential and land use change is formulated for countries with domestic markets unable to
influence international markets. The proposed method is a combination of resource-focused and
demand driven approaches, in which the biomass energy potential is influenced by the internal
demand, land use, economics, macroeconomics and global biofuel use. Thirdly, a method for
energy technology roadmapping adapted to the conditions of developing countries and a new
strategy to build consensus based on the Delphi method are formulated. These tools are employed
for defining a plan to deploy sustainable bioenergy technologies in Colombia until 2030. The plan
consists of a set of long-term goals, milestones, barriers and action items identified by over 30
experts for different bioenergy technology areas. Fourthly, a modeling framework to evaluate the
impacts that long-term deployment of bioenergy technologies might cause on the energy supply and
demand, emissions and land use at a country level is proposed. The method combines a quantitative
and a qualitative element. The qualitative element integrates outcomes of technology roadmapping
with scenario analysis to investigate various storylines with different underlying assumptions on
policy measures. The quantitative element comprises four integrated tools, namely the energy
system model (ESM), the land use and trade model (LUTM), an economic model, and an external
climate model. These tools quantify in an integrated manner the impacts of implementing different
scenarios on the energy system, emissions and land-use at a country level as well as the linkages
with the economy and climate.
Results of the study case of Colombia suggest that the deployment of technologies for biomethane
production, power generation & CHP should be prioritized. These technology routes avoid methane
release, substitute fossil fuels, reduce CO
2emissions and maximize the GHG reductions per
Strategic planning of biomass and bioenergy technologies
Sommario
Il dimensionamento di sistemi energetici sostenibili e rispettosi dell'ambiente è una sfida
fondamentale che deve essere affrontata dalle nazioni di tutto il mondo. Questa sfida è
particolarmente rilevante nei paesi in via di sviluppo, in quanto vi sono aree remote ancora non
elettrificate, vi è una eccessiva dipendenza da fonti convenzionali di energia, si registra una carenza
di risorse finanziarie e non sono sviluppate ed implementate adeguate politiche e regolamentazioni.
L'obiettivo di questa tesi è lo sviluppo di una metodologia per la pianificazione strategica delle
tecnologie basate su biomasse e bioenergie in genere, nei paesi in via di sviluppo. L'approccio
seguito è quello di iniziare da un approccio generale e poi passare ad uno specifico contesto di
applicazione, che nel caso in esame è la Colombia.
Le metodologie sviluppate ed applicate nella tesi sono relative a quattro aree principali.
In primo luogo, viene sviluppato un metodo per stimare l’attuale potenziale energetico della
biomassa e la sua incertezza a livello nazionale, per tenere conto del fatto che la disponibilità e la
qualità dei dati possono essere limitati. A questo scopo, si propone un approccio focalizzato sul tipo
di risorsa e bottom-up, con analisi statistica che utilizza un algoritmo Monte Carlo. In secondo
luogo, viene sviluppato un metodo per stimare il futuro potenziale energetico della biomassa e il
cambiamento di uso del suolo, per paesi il cui mercato nazionale non influenza i mercati
internazionali. Il metodo proposto è una combinazione di approcci focalizzati sul tipo di risorsa e
guidati dalla domanda, in cui l'energia potenziale della biomassa è influenzato dalla domanda
interna, dall’uso del suolo, dall'economia, dalla macroeconomia e dall'uso di biocarburanti globale.
In terzo luogo, la tesi propone un metodo per tracciare la roadmap per l’utilizzo di tecnologie
energetiche, adattato alle condizioni dei paesi in via di sviluppo, e una nuova strategia per costruire
il consenso sulla base del metodo Delphi. Questi strumenti sono impiegati per la definizione di un
piano per implementare tecnologie bioenergetiche sostenibili in Colombia fino al 2030. Il piano è
costituito da una serie di obiettivi a lungo termine, di tappe, di barriere e di “azioni” individuate da
più di 30 esperti per le diverse aree tecnologiche. In quarto luogo, viene sviluppato un modello
generale di simulazione per valutare gli impatti che l’implementazione a lungo termine delle
tecnologie bioenergetiche potrebbe causare su domanda e richiesta di energia, emissioni e uso del
territorio a livello nazionale. Il metodo combina elementi sia quantitativi sia qualitativi. L'elemento
qualitativo integra i risultati della tecnologia di sviluppo della roadmap con analisi di scenari per
indagare varie storie con diverse ipotesi circa le azioni di politica energetica da attuare. L'elemento
quantitativo comprende quattro strumenti integrati, vale a dire il modello di sistema energetico
(ESM), l'uso del suolo e un modello di mercato (LUTM), un modello economico e un modello che
tiene conto del clima. Questi strumenti servono per quantificare in modo integrato gli impatti
conseguenti all’attuazione di diversi scenari sul sistema energetico, le emissioni e l’uso del suolo a
livello nazionale, così come i legami con l'economia e il clima.
I risultati dello studio per il caso della Colombia indicano che la diffusione di tecnologie per la
produzione di biometano, la generazione di energia e la cogenerazione dovrebbero essere le
tecnologie sulle quali investire per il futuro, in quanto permettono di ridurre le emissioni di metano,
la sostituzione dei combustibili fossili, la riduzione delle emissioni di CO
2e la massimizzazione
della riduzione di gas serra per suolo incrementale utilizzato per la produzione di bioenergia.
Università degli Studi di Ferrara
DOTTORATO DI RICERCA IN
SCIENZE DELL'INGEGNERIA
CICLO XXVII
COORDINATORE Prof. Stefano Trillo
Strategic planning of biomass and bioenergy technologies
Settore Scientifico Disciplinare ING-IND/09
Dottorando Tutore
Miguel Angel Gonzalez Salazar Prof. Mauro Venturini
_______________________________ _____________________________
(firma) (firma)
i
i
Strategic planning of biomass and bioenergy technologies
Copyright © 2016 by Miguel Angel Gonzalez Salazar
All rights reserved
Please cite this document as: Gonzalez-Salazar, M.A., Strategic planning of biomass and bioenergy technologies, PhD thesis, Università degli Studi di Ferrara, 2016
For more information on this document, please contact: Miguel Angel Gonzalez Salazar, [email protected]
No part of the material protected by this copyright notice may be reproduced or utilized in any form or by any means, electronic or mechanical, including photocopying, recording or by any information storage and retrievals system, without permission from the author.
ii
Abstract
The design of sustainable, environmentally friendly energy systems which have adequate capacity is a critical challenge faced by nations across the globe. This challenge is compounded in developing countries, which contain with remote areas yet to be connected to the grid, an over-dependence on conventional sources of energy, a shortage of financial resources, and, limited supporting policies and legislation.
The objective of this thesis is to develop methods for strategic planning of biomass and bioenergy technologies in developing countries. The approach followed is to start from the general and move to the specific. After a general formulation of methods, an exemplary case study of Colombia is presented.
The formulated methods cover four main areas. Firstly, a method to estimate the current biomass energy potential and its uncertainty at a country level is formulated when availability and quality of data are limited. For this purpose, a bottom-up resource-focused approach with statistical analysis using a Monte Carlo algorithm is proposed. Secondly, a method to estimate the future biomass energy potential and land use change is formulated for countries with domestic markets unable to influence international markets. The proposed method is a combination of resource-focused and demand-driven approaches, in which the biomass energy potential is influenced by the internal demand, land use, economics, macroeconomics and global biofuel use. Thirdly, a method for energy technology roadmapping adapted to the conditions of developing countries and a new strategy to build consensus based on the Delphi method are formulated. These tools are employed for defining a plan to deploy sustainable bioenergy technologies in Colombia until 2030. The plan consists of a set of long-term goals, milestones, barriers and action items identified by over 30 experts for different bioenergy technology areas. Fourthly, a modeling framework to evaluate the impacts that long-term deployment of bioenergy technologies might cause on the energy supply and demand, emissions and land use at a country level is proposed. The method combines a quantitative and a qualitative element. The qualitative element integrates outcomes of technology roadmapping with scenario analysis to investigate various storylines with different underlying assumptions on policy measures. The quantitative element comprises four integrated tools, namely the energy system model (ESM), the land use and trade model (LUTM), an economic model, and an external climate model. These tools quantify in an integrated manner the impacts of implementing different scenarios on the energy system, emissions and land-use at a country level as well as the linkages with the economy and climate. Results of the study case of Colombia suggest that the deployment of technologies for biomethane production, power generation & CHP should be prioritized. These technology routes avoid methane release, substitute fossil fuels, reduce
CO2 emissions and maximize the GHG reductions per incremental land of bioenergy.
iii
Preface
This PhD thesis was developed at the Dipartimento di Ingegneria of the Università degli Studi di Ferrara (Italy), within the framework of a collaboration initiative with the Institute for Technology Assessment and System Analysis (ITAS) at the Karlsruhe Institute of Technology (Germany) and the Kempten University of Applied Sciences (Germany). It was supervised by Prof. Ing. Mauro Venturini at the Università degli Studi di Ferrara and co-supervised by Dr. Witold-Roger Poganietz at the Institute for Technology Assessment and System Analysis and by Prof. Dr. Matthias Finkenrath at the Kempten University of Applied Sciences. This thesis is based on various scientific manuscripts published or submitted to publication in peer-reviewed international journals, peer-reviewed conferences, peer-reviewed special reports and patent applications. These scientific publications are listed below. In all the scientific publications the author of this thesis was the leading author. Prof. Ing. Mauro Venturini, Dr. Witold-Roger Poganietz and Prof. Dr. Matthias Finkenrath jointly supervised the work.
Peer-reviewed international journals
1. Gonzalez-Salazar, M., Venturini, M., Poganietz, W., Finkenrath, M. (2015). Effects of long-term deployment of bioenergy in Colombia (submitted).
2. Gonzalez-Salazar, M., Venturini, M., Poganietz, W., Finkenrath, M., Kirsten, T., Acevedo, H., Spina, P. (2015). Development of a roadmap for bioenergy exploitation (submitted).
3. Gonzalez-Salazar, M., Venturini, M., Poganietz, W., Finkenrath, M., Kirsten, T., Acevedo, H., Spina, P. (2015). A framework to evaluate the energy, economy, emissions and land-use nexus for bioenergy exploitation (submitted). 4. Gonzalez-Salazar, M., Venturini, M., Poganietz, W., Finkenrath, M., Spina, P. (2015). Methodology for improving
the reliability of biomass energy potential estimation (submitted).
5. Gonzalez-Salazar, M., Morini, M., Pinelli, M., Spina, P., Venturini, M., Finkenrath, M., Poganietz, W. (2014). Methodology for estimating biomass energy potential and its application to Colombia. Applied Energy, 136, 781-796.
6. Gonzalez-Salazar, M., Morini, M., Pinelli, M., Spina, P., Venturini, M., Finkenrath, M., Poganietz, W. (2014). Methodology for biomass energy potential estimation: projections of future potential in Colombia. Renewable Energy, 69, 488-505.
Peer-reviewed international conferences
1. Gonzalez-Salazar, M., Morini, M., Pinelli, M., Spina, P., Venturini, M., Finkenrath, M., Poganietz, W. (2013). Methodology for biomass energy potential estimation: projections of future potential in Colombia. International Conference on Applied Energy (ICAE).
2. Gonzalez-Salazar, M., Morini, M., Pinelli, M., Spina, P., Venturini, M., Finkenrath, M., Poganietz, W. (2013). Methodology for biomass energy potential estimation: assessment of current potential in Colombia. International Conference on Applied Energy (ICAE).
Peer-reviewed special reports
1. Gonzalez-Salazar, M., Venturini, M., Poganietz, W., Finkenrath, M., Kirsten, T., & Acevedo, H. (2014). Bioenergy
technology roadmap for Colombia. Università degli Studi di Ferrara. DOI:
http://dx.doi.org/10.15160/unife/eprintsunife/774 Patent applications
1. Gonzalez-Salazar, M., Becquin, G. (2015). Process of producing, transporting and combusting novel fuels consisting of gas hydrocarbons (including biomethane) dissolved in liquid fuels. Filed in the U.S. Patent Office on November
iv
Acknowledgements
A smooth sea never made a skillful sailor. That’s true. Four years ago I had the crazy idea of pursuing a PhD, to become, you know, “a skillful sailor”. I didn’t really know how to do it, but I wanted to do it anyway. So, I set out against the wind and tide, like in the Odyssey. By the middle of the project, my life had completely changed. I had got married, my father had passed away and I myself had become a father. I struggled to find the right balance between my new life and the PhD thesis. Many people inspired me and helped me in different ways to find answers to these challenges. Thanks to them this work has survived many storms and wild seas. This thesis is dedicated to all of them. On a different level, the thesis is devoted to my homeland, Colombia, as a reward for so many good things I experienced there.
First, I want to thank Maria, my wife, for travelling with me in this adventure, for supporting me all the time and for forgiving the difficult moments. You are the reason to start a thousand Odysseys. Amelia, my dear, thanks for being here and for showing us what is important in life, you are our most precious treasure. Many thanks to my mom and dad for teaching me all I know and for encouraging me to pursue my dreams ¡muchas gracias! I would not be here writing this without you. Thanks to my sisters Ana & Efa, for their love and unconditional backing. Many thanks to the Salazar family (Abuelita, María Claudia, Sofía, Claus, Iván, Mariana, Sami, Carlitos, Tere, Robledo and Felipe), for being my spiritual support back at home, for the crazy ideas, stubbornness, appetite and good moments. Thank you so much to my parents-in-law Kathrin and Jörg, for looking after us so many times.
Many people believed in me from the beginning and I am very grateful to all of them. To my supervisor Prof. Ing. Mauro Venturini, thanks a lot for your advice and guidance, for supporting my unconventional research setup and crazy initiatives, for encouraging me in difficult moments and for being my friend. To my co-advisor Dr. Witold-Roger Poganietz, thanks for bringing your thoroughness and experience to our team, for your valuable contributions and constructive feedback, which helped me to improve this work. To my co-advisor Prof. Dr. Matthias Finkenrath, thank you so much for supporting my work unconditionally, for sharing your technical depth, experience and enthusiasm with me, for teaching me how to enjoy life at work and for your friendship (and Fasching!). Many, many, many thanks to Trevor Kirsten - finishing this thesis would have not been possible without your help, continuous support, encouragement, and good humor.
I would also like to thank the following people for contributing to the technical content of my work: Prof. Helmer Acevedo, Dr. Regis Leal, Prof. Suani Coelho, Javier Rodríguez, Dr. Maria Fernanda Gómez, Alejandra Corredor, Dr. Jimmy Lopez, Dr. Aymer Maturana, Prof. Pier Ruggero Spina, Prof. Michele Pinelli and Dr. Mirko Morini. Many thanks to the office for international students at the Università degli Studi di Ferrara. Thank you so much to the roadmap experts and reviewers for participating in the surveys and workshops as well as for reviewing and providing comments on the drafts. This thesis could not have been carried out with your contribution.
I am very grateful to Alex Simpson, who backed me up and “blessed” me at work at the very beginning of this Odyssey. To Gary Leonard, Carlos Härtel and Johanna Wellington, many thanks for believing in my work and in this project. Thanks a lot to my colleagues Gabi Gómez, Guillaume Becquin, Theodosia Kourkoutsaki, Jorge Carretero and Carlos Díaz, who in one way or another made my life easier.
This work would not have been possible without the LEAP license and the technical support kindly provided by the Stockholm Environment Institute through the Community for Energy, Environment and Development (COMMEND). Thank you!
Finally, thanks from the bottom of my heart to my friends for helping me to return to Ithaca from the underworld and for being here when I needed help: Jorge Pérez, Andrés & Anni, Rodrigo & Ariana, Alvaro & Mayra, Renato & Fafa and Mani.
“Never give in, never give in, never, never, never, never—in nothing, great or small, large or petty— never give in
except to convictions of honour and good sense” – Churchill
v Para mi Papá
y para Amelia
vi
Nomenclature
Chapter C
Symbolsa availability factor
b biogas yield from manure
c by-product to product ratio in forestry
d dry basis
f manure production per head
k by-product to product ratio in agriculture
H heads, animal stocks
LHV lower heating value
HHV higher heating value
M moisture content
P production
Q theoretical energy potential
QT technical energy potential
w wet basis
𝑥 mean of x
∝ constraint factor to calculate availability
𝜎 standard deviation 𝜂 energy efficiency 𝜌 density Subscripts AR agricultural residue AW animal waste
current state-of-the-art technology
F forest-based
i i-th agricultural crop
j j-th residue for each i-th agricultural crop
m m-th type of animal
n n-th sub-category of type of animal
r r-th forestry resource
s s-th biofuel
x x-th type of urban waste
U urban waste
Chapter D
SymbolsA area
c production cost
d demand per capita of commodities
D domestic demand of commodities
E exchange rate
FPI fertilizers price index
GDG GDP deflator growth
I volume of imported commodities
I1 volume of imported commodities subject to
tariffs
I2 volume of imported duty free commodities
k price sensitivity coefficient
LPI local price index
M profit
N population
P domestic production of commodities
PI price index
PIC price index for Colombia
Y yield
W local minimum wage
π price “Free On Board” (FOB), non-discounted
𝜋∗ price “Cost Insurance and Fright” (CIF),
non-discounted
𝜋∗∗ price “Cost Insurance and Fright” plus margin
for importer, non-discounted Subscripts
i i-th time step, year
j j-th commodity T theoretical Superscripts D domestic production E exports I imports
I1 imports subject to tariffs
I2 duty free imports
Max maximal
Chapter F
SymbolsA dummy variable to estimate vehicle ownership
AL activity level
b coefficient of equation to estimate saturation
of appliances
BMV blend mandate of biofuels by volume
C installed power generation capacity
C1 coefficient to estimate the energy consumption
of other appliances
C2 coefficient to estimate the energy consumption
of other appliances
CAD annual addition of power generation capacity
CC capacity credit
CDD cooling degree days
CF capacity factor
CK1 coefficient to evaluate the annual energy
demand for cooking per household
CK2 coefficient to evaluate the annual energy
demand for cooking per household
CK3 coefficient to evaluate the annual energy
demand for cooking per household
CKE annual energy demand for cooking
CKEp annual energy demand for cooking per person COP coefficient of performance for air conditioners Cov supply coverage
D population density
d parameter of Gompertz function to estimate
the ownership of refrigerators
DC total discounted cost
DE decommissioning cost
Deg factor representing the change in a property
vii
E access to energy services (electricity and
natural gas)
e parameter of Gompertz function to estimate
the ownership of refrigerators
ECA energy consumption for appliances
ECAp energy consumption for appliances per capita ECC energy consumption for cooking
ECCH energy consumption for cooking per household ECCI energy consumption in the cane industry ECCp energy consumption for cooking per capita ECF energy consumption by fuel for various sectors ECL energy consumption for lighting
ECLH energy consumption for lighting per household ECLp energy consumption for lighting per capita ECP consumption of energy resources for power
generation
ECPI energy consumption in the palm oil industry ECV energy consumption for a vehicle
ECW energy consumption for water heating ECWp energy consumption for water heating per
capita
EF emission factor
EIC energy intensity in the cane industry
EIP energy intensity in the palm industry
F fuel cost
FE fuel economy for a new vehicle
FFB fresh fruit bunches
FS floor space per person
FSQ floor space quintile factor
FU energy produced in a final use, e.g. power
generation, heat production, etc.
GDP gross domestic product
GDPp gross domestic product per capita GHG greenhouse gas emission
H number of households
HDD heating degree days
HH household expenditure
HHp household expenditure per person
I investment cost
IS income share for different regions or quintiles
LE lighting energy demand per household
LEp lighting energy demand per capita LHF lighting hours factor coefficient LHV lower heating value
M motorcycle ownership
m coefficient of equation to estimate saturation
of appliances
𝑚̇ mass flow
MEF multiplying emission factor for biofuels
Mil mileage for a vehicle
OD annual number of days demanding hot water
OM operation & maintenance cost OW appliance ownership
P population, e.g. number of inhabitants
PG power generation
PL peak load
Q quintile number, i.e. 1, 2, 3, 4 and 5
R dummy variable to estimate vehicle ownership
r discount rate
RM planning reserve margin
S household size
Sales number of vehicle sales
SH vehicle share
Stock number of vehicles
Sur survival rate of vehicles
T temperature
t year
TEP technical biomass energy potential
U urban fraction of population
UEC unit energy consumption by type of appliance
V vehicle ownership
VE85 percentage of vehicles able to run with E85 VEFF percentage of vehicles that are flex fuel
W unit energy consumption per light bulb
x mass content
𝛼 parameter of Gompertz function
𝛽 parameter of Gompertz function
𝜓 saturation level of Gompertz function
𝜆 negative constant of Gompertz function
𝜑 negative constant of Gompertz function
𝜃 speed of adjustment
𝜀 random error
𝑘 cost exponent in logit function
𝛾 cost sensitivity coefficient in logit function
𝜇 fuel share
ϑ coefficient that influence the unit energy
consumption in appliances
ζ coefficient that influence the unit energy
consumption in appliances
𝜉 coefficient that influence the energy
consumption by fuel for various sectors
∇ gradient to model differences in access to
energy services across quintiles Subscripts
a a-th type of appliance
AC related to air conditioners
b b-th type of biomass resource
ba related to bagasse
bg related to biogas
bio related to biofuels
biom related to biomethane
blend related to blends of fossil fuels and blends
c c-th type of vehicle
cj related to cane juice
cnl related to cane without leaves
cwl related to cane with leaves
d d-th time step, day
E type of energy service, e.g. electricity, natural
gas, heating, etc.
E20 related to the fuel program E20 (ethanol 20%v) E85 related to the fuel program E85 (ethanol 85%v)
El related to electricity
et related to bioethanol
F period of falling
f f-th type of fuel
fossil related to fossil fuels
viii
ko related to kernel oil
lg related to landfill gas
MAX maximum
nby related to non-usable by-products from palm
oil
O related to outputs
OA related to other appliances
Other related to other pollutants
p p-th type of pollutant
po related to palm oil
pr related to palm residues
Q q-th quintile
R period of rising
r region, i.e. rural and urban
Re reference
Ref related to refrigerators
Ro related to the different routes to produce sugar
and bioethanol, i.e. Route 1, Route 2 and Route 3
ru related to rural regions
s related to sugar
t t-th time step, year
tl related to cane tops and leaves
u related to urban regions
v v-th year of production (vintage) of a certain
type of vehicle or motorcycle
Acronyms in all chapters
ARIMA autoregressive integrated moving average
model
Asocaña Asociación de Cultivadores de Caña de Azúcar de Colombia (Association of Sugar Cane Growers of Colombia)
BID Inter-American Development Bank
BOD biochemical oxygen demand
BRICS Brazil, Russia, India, China & South Africa
CHP combined heat and power
CI confidence interval
CIF Cost, insurance and freight
CNG compressed natural gas
COE cost of electricity
COL Colombian peso
COP coefficient of performance
CREG Comisión de Regulación de Energía y Gas,
Colombia (Energy and Gas Regulatory Commission)
DANE Departamento Administrativo Nacional de
Estadística, Colombia (National
Administrative Department of Statistics)
DNP Dirección Nacional de Planeación,
Colombia (National Planning Division)
DOE U.S. Department of Energy
Ecopetrol Empresa Colombiana de Petróleos (Colombian Petroleum Co.)
EIA U.S. Energy Information Administration
ENSO El Niño and La Niña southern oscillation
ESCO energy service company
ESM energy system model
EUD extended uniform distribution
FAO Food and Agriculture Organization of the
United Nations
FAPRI Food and Agriculture Policy Research
Institute
FFB fresh fruit bunches (palm oil)
FFV flex-fuel vehicles
FTA Free Trade Agreement
GBEP Global Bioenergy Partnership
GDP gross domestic product
GHG greenhouse gas
GT gas turbine
GWP Global Warming Potential
HHD Human Development Index
IDEAM Instituto de Hidrología, Meteorología y
Estudios Ambientales de Colombia (Colombian Institute of Hydrology, Meteorology and Environmental Studies)
IEA International Energy Agency
IIASA International Institute for Applied Systems
Analysis
ILUC indirect land-use change
IPCC Intergovernmental Panel on Climate
Change
LCOE levelized cost of electricity
LDPS2 Livestock Development Planning System v2
LEAP Long-range Energy Alternatives Planning
System
LHV lower heating value
LPG liquefied petroleum gas
LULUCF land use, land-use change and forestry
LUTM land use and trade model
MME Ministry of Mines and Energy, Colombia
MSW municipal solid waste
MUV Manufactures Unit Value
NGO non-governmental organization
NGCC natural gas combined cycle
NIZ non-interconnected zones
NMVOC non-methane volatile organic compounds
NOx nitrogen oxides
NREL U.S. National Renewable Energy Laboratory
OECD Organisation for Economic Co-operation
and Development
OEM original equipment manufacturer
PPP purchasing power parity
R&D research and development
SME small and medium-sized enterprises
SOx sulfur oxides
TED technology and environmental database
TOE ton of oil equivalent
TRQ Tariff Rate Quota
UEC unit energy consumption
UPME Unidad de Planeación Minero Energética,
Colombia (Mining and Energy Planning Unit)
WB World Bank
ix
Table of contents
Nomenclature ... vi Chapter A. Introduction ... 1 A.1. Overview ... 1 A.2. Motivation ... 2A.3. Objective and research questions ... 2
A.4. Challenges ... 2
A.5. Criteria to design methods ... 3
A.6. Research approach ... 4
A.6.1. Addressing research question Q1 ... 4
A.6.2. Addressing research question Q2 ... 5
A.6.3. Addressing research question Q3 ... 6
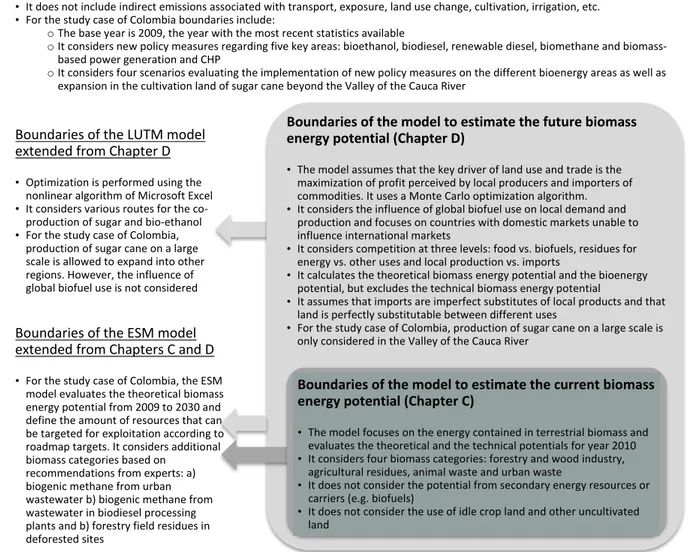
A.7. Boundary conditions ... 6
A.8. Limitations ... 8
A.9. Thesis structure ... 8
Chapter B. Current status of bioenergy in Colombia ... 9
B.1. Overview ... 9
B.2. Biomass for energy purposes ... 10
B.3. Regulations ... 10
B.4. Wood ... 11
B.5. Sugar cane and bioethanol... 11
B.6. Palm oil and biodiesel ... 11
B.7. Biomass-based power generation & CHP ... 12
Chapter C. Method of assessing current biomass energy potential ... 13
C.1. Overview ... 13
C.2. Literature review ... 13
C.2.1. State-of-the-art methods of assessing biomass energy potential ... 13
C.2.2. Methods of assessing uncertainty in biomass energy potential ... 14
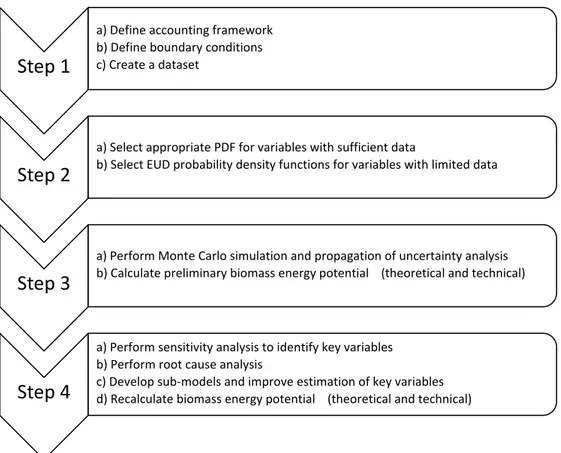
C.2.3. Gaps in knowledge ... 15 C.3. Method ... 15 C.3.1. Step 1 ... 17 C.3.2. Step 2 ... 19 C.3.3. Step 3 ... 19 C.3.4. Step 4 ... 19
C.3.5. Limitations of the proposed method ... 20
C.4. Study case: Colombia ... 22
C.4.1. Prior art ... 22
C.4.2. Site-specific boundary conditions and assumptions ... 23
C.4.3. Calculation of the theoretical potential ... 25
C.4.4. Calculation of the technical biomass energy potential ... 30
C.4.5. Calculation of the current biomass energy utilization ... 34
C.4.6. Re-evaluation of other studies ... 34
C.5. Summary and discussion ... 34
Chapter D. Method of assessing future biomass energy potential ... 38
D.1. Overview ... 38
D.2. Method ... 38
D.2.1. State-of-the-art ... 38
D.2.2. Modeling approach and assumptions ... 39
D.2.3. Information processing ... 40
D.2.4. Mathematical formulation ... 40
D.2.5. Optimization algorithm ... 42
D.2.6. Sensitivity analysis ... 42
D.2.7. Selected global scenarios ... 43
D.3. Study case: Colombia ... 43
D.3.1. Prior art ... 43
x
D.3.3. Model validation ... 47
D.3.4. Results ... 48
D.3.5. Sensitivity analysis ... 52
D.4. Summary and discussion ... 53
Chapter E. Development of a technology roadmap for bioenergy exploitation ... 54
E.1. Overview ... 54
E.1.1. Chapter structure ... 54
E.1.2. Technology roadmapping ... 54
E.2. Method ... 55
E.2.1. State-of-the-art ... 55
E.2.2. Gaps in knowledge ... 55
E.2.3. Proposed method ... 56
E.3. Application of the method to Colombia ... 57
E.3.1. Motivation ... 57
E.3.2. Scope ... 57
E.3.3. Positions towards residual biomass ... 57
E.3.4. Process ... 58
E.4. Results of the roadmapping process for Colombia ... 58
E.4.1. Overview of the vision ... 58
E.4.2. Long-term goals ... 59
E.4.3. Milestones of the bioenergy technology roadmap ... 59
E.4.4. Barriers to implement the bioenergy technology roadmap ... 59
E.4.5. Action items to implement the bioenergy technology roadmap ... 65
E.5. Guidelines and recommendations ... 72
E.6. Summary and discussion ... 73
Chapter F. Framework for evaluating the energy, emissions and land-use nexus ... 74
F.1. Overview ... 74
F.2. Method ... 74
F.2.1. State-of-the-art ... 74
F.2.2. Gaps in knowledge ... 75
F.2.3. Proposed modeling framework ... 75
F.3. Energy System Model (ESM) ... 80
F.3.1. General assumptions... 81
F.3.2. Modeling techniques ... 81
F.3.3. Model of the demand side ... 81
F.3.4. Model of the transformation side ... 87
F.4. Application of the modeling framework to Colombia... 93
F.4.1. Technology roadmapping and scenario analysis... 93
F.4.2. Assumptions of the climate model ... 94
F.4.3. Application of the economic model ... 95
F.4.4. Application of the LUTM model ... 97
F.4.5. Application of the ESM model ... 97
F.5. Summary and discussion ... 105
Chapter G. Roadmap impacts ... 107
G.1. Overview ... 107
G.2. Impacts on the energy system ... 107
G.2.1. Primary energy demand ... 107
G.2.2. Impacts on the demand side ... 109
G.2.3. Impacts on power generation and combined heat and power (CHP) ... 112
G.2.4. Bioenergy outlook by scenario ... 116
G.3. Impacts on land use ... 118
G.3.1. Land uses ... 118
G.3.2. Land for biofuels and woodfuel for local consumption ... 119
G.3.3. Trade balance of biofuels ... 120
G.4. Impacts on emissions ... 121
G.4.1. Overall emissions by scenario ... 121
G.4.2. Domestic bioenergy-induced emissions reductions ... 123
G.5. Supplementary material ... 124
xi
Chapter H. Conclusions & recommendations ... 126
H.1. Conclusions ... 126
H.1.1. Method of assessing current biomass energy potential ... 126
H.1.2. Method of assessing future biomass energy potential ... 126
H.1.3. Development of a technology roadmap for bioenergy exploitation ... 126
H.1.4. Framework for evaluating the energy, emissions and land-use nexus ... 127
H.1.5. Roadmap impacts ... 127
H.2. Policy recommendations ... 128
H.3. Recommendations for further studies ... 128
Glossary….…… ... 129
References.….. ... 130
Appendix for Chapter C ... 146
Appendix for Chapter D ... 153
Appendix for Chapter E ... 159
Appendix for Chapter F ... 166
Appendix for Chapter G ... 194
xii
List of tables
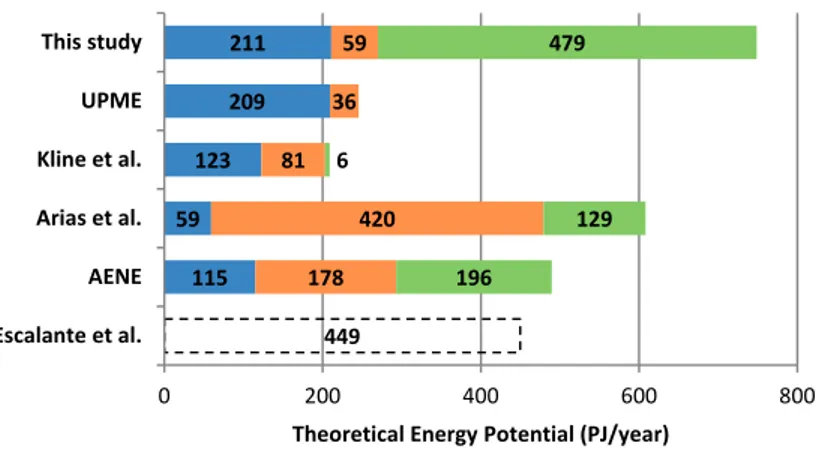
Table 1. Comparative overview of existing estimations of biomass energy in Colombia ... 23
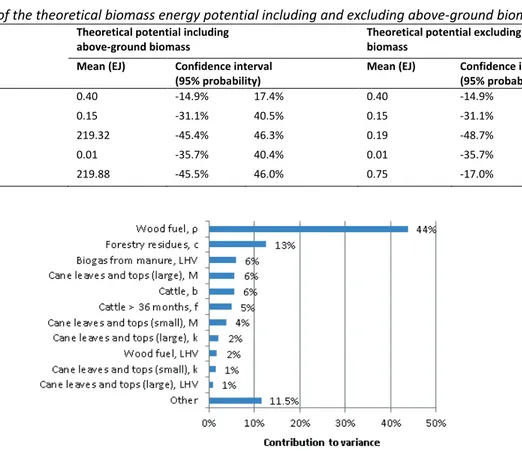
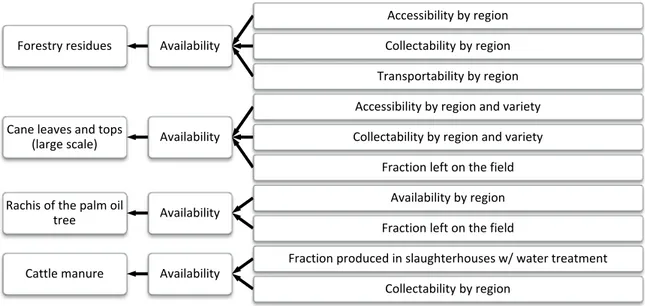
Table 2. Results of the theoretical biomass energy potential including and excluding above-ground biomass in forests ... 28
Table 3. Preliminary vs. recalculated theoretical potential ... 30
Table 4. Preliminary technical biomass energy potential and associated uncertainty... 31
Table 5. Preliminary vs. recalculated technical potential ... 35
Table 6. Comparative overview of selected global scenarios and datasets ... 43
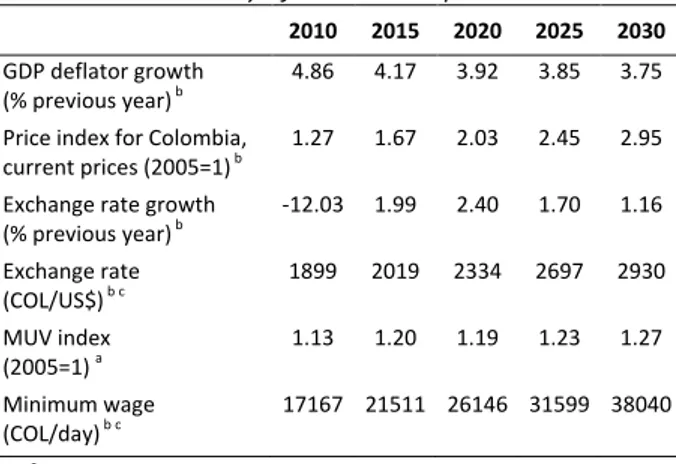
Table 7. Summary of economic inputs to the model ... 44
Table 8. Availability of land in the period 2010-2030 ... 45
Table 9. Assumed population ... 45
Table 10. Assumptions of local biofuel scenarios ... 47
Table 11. Set of long-term goals and milestones ... 60
Table 12. Regulatory barriers ... 62
Table 13. Market barriers ... 63
Table 14. Public acceptance barriers ... 66
Table 15. Regulatory action items ... 69
Table 16. Action items on financing mechanisms and business development ... 70
Table 17. Multiplying emission factors for biofuels (TNO, 2009) ... 84
Table 18. Energy intensity for producing sugar and bioethanol ... 90
Table 19. Energy intensity for producing palm oil and biodiesel ... 91
Table 20. Comparative overview of scenarios ... 94
Table 21. Assumed population ... 95
Table 22. Assumed GDP [PPP] and GDP growth ... 95
Table 23. Number of vehicles by type ... 98
Table 24. Comparison of model parameters for the vehicle ownership model ... 99
Table 25. Historical fuel cost by vehicle ... 99
Table 26. Parameters of the logit function to estimate vehicle shares ... 99
Table 27. Model parameters of the motorcycle ownership model ... 99
Table 28. Energy intensity by vehicle type in year 2009 ... 100
Table 29. Dataset for agricultural residues in 2010 ... 146
Table 30. Dataset for animal waste in 2010 ... 147
Table 31. Dataset for forestry and wood industry in 2010 ... 147
Table 32. Dataset for calculating the above-ground biomass forestry in 2010 ... 148
Table 33. Dataset for urban waste in 2010 ... 148
Table 34. Data to estimate weighted mean of forestry residues ... 149
Table 35. Availability of resources for energy production ... 151
Table 36. Comparison of assumptions used by different studies ... 152
Table 37. Commodities considered in the model ... 153
Table 38. Comparison of international FOB price of commodities for selected global scenarios and datasets (US$2005) ... 153
Table 39. Minimum and maximum yearly growth for commodities ... 154
Table 40. Yields for different commodities... 154
Table 41. Demand per capita for different commodities ... 155
Table 42. Production costs in current prices (non-discounted) ... 156
Table 43. Domestic price of commodities (current prices, non-discounted) ... 157
Table 44. Price sensitivity coefficient ... 157
Table 45. Assumptions about trade and estimated price of imported commodities ... 158
Table 46. Questions formulated in the first survey and responses from experts ... 159
Table 47. Questions formulated in the second survey ... 161
Table 48. Assumed energy prices (US$2005) ... 166
Table 49. Assumed availability of land ... 167
Table 50. Produced volumes of biomass resources ... 168
Table 51. Specific energy of biomass resources ... 169
Table 52. Availability of biomass resources ... 170
xiii
Table 54. Technical biomass energy potential (including current uses) used in roadmap ... 172
Table 55. Primary energy targeted in long-term goals of biomethane and biomass-based power generation in Scenarios I and II ... 172
Table 56. Validation of the primary energy demand by fuel in the ESM model against official statistics ... 173
Table 57. Goodness of fit between primary energy modeled values and official statistics ... 173
Table 58. Validation of the GHG emissions by branch in the ESM model against official statistics ... 174
Table 59. Goodness of fit between GHG emissions modeled values and official statistics ... 174
Table 60. Updated production costs of sugar, palm oil and biofuels in LUTM model ... 174
Table 61. Updated yields of sugar, palm oil and biofuels in LUTM model ... 175
Table 62. Other assumptions about expansion of sugar cane in the Llanos and Costa regions ... 175
Table 63. Income shares by quintile and region in 1999 ... 177
Table 64. Past and future income shares by quintile ... 177
Table 65. Household expenditure per person by quintile and region ... 177
Table 66. Floor space by region and quintile ... 178
Table 67. Historical access to electricity and natural gas by region ... 178
Table 68. Gompertz parameters to model the access to electricity and natural gas ... 179
Table 69. Model parameters to estimate fuel shares for rural cooking ... 184
Table 70. Model parameters to estimate fuel shares for urban cooking ... 184
Table 71. Results of the regression analysis of the energy demand by fuel for various sectors ... 185
Table 72. Assumed energy demand by sector in fuel in cases where regression was not satisfactory ... 185
Table 73. Assumptions about power generation technologies ... 186
Table 74. Exogenous capacity added by technology until 2019 ... 187
Table 75. Capacity exogenously added to comply with the biogas and landfill gas targets in Scenarios I and II ... 187
Table 76. Maximum annual capacity addition by technology ... 188
Table 77. Fuel assumptions ... 189
Table 78. Characteristics of conversion processes (Part I) ... 190
Table 79. Characteristics of conversion processes (Part II) ... 191
Table 80. Emission factors by fuel and application taken from TED in LEAP (Part I) ... 192
Table 81. Emission factors by fuel and application taken from TED in LEAP (Part II) ... 193
Table 82. Levelized cost of electricity (LCOE) by technology ... 194
Table 83. General assumptions regarding the technical analysis of technology routes ... 197
Table 84. Technical and economic characteristics of PSA and water scrubbing ... 198
Table 85. Technical assumptions of technology routes ... 199
Table 86. Production capacities of technology routes ... 200
Table 87. Annual costs of technology routes ... 200
xiv
List of figures
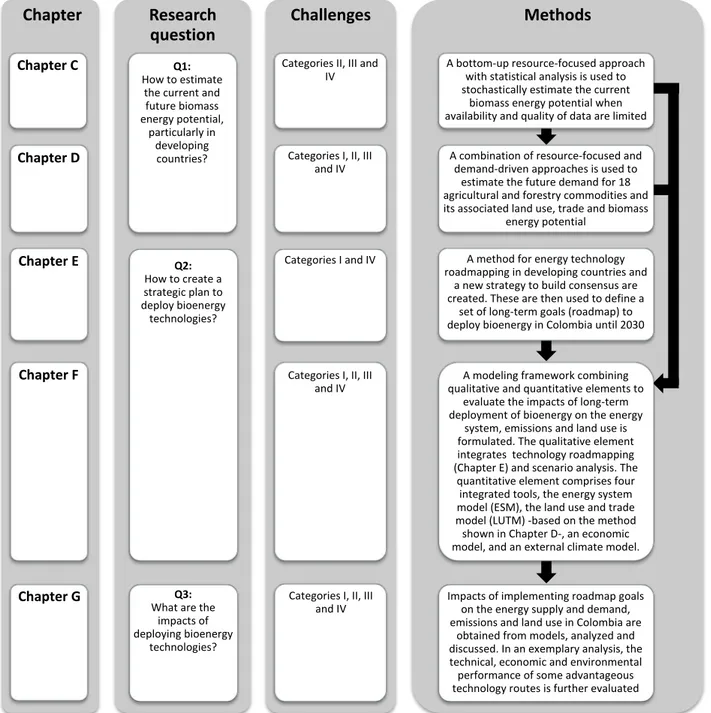
Figure 1. Research approach describing research question, challenges and methods by chapter ... 5
Figure 2. Boundary conditions of the different models ... 7
Figure 3. Primary energy demand and contribution ... 10
Figure 4. Method of assessing biomass energy potential and its associated uncertainty ... 16
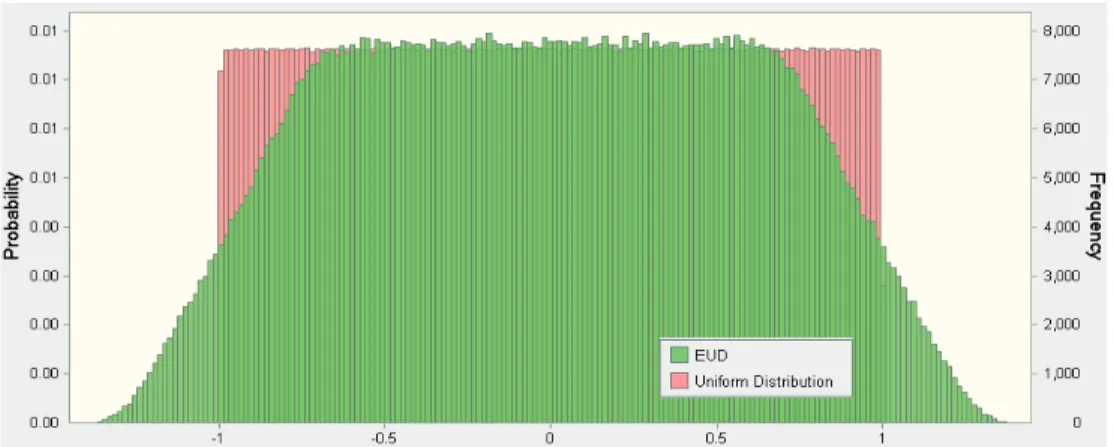
Figure 5. Extended uniform distribution (EUD) compared to uniform distribution ... 20
Figure 6. Limitations of the proposed method ... 21
Figure 7. Boundary conditions for Colombia ... 24
Figure 8. Sensitivity analysis for the theoretical biomass potential excluding above-ground biomass in forests ... 28
Figure 9. Root cause analysis to identify sub-components affecting key variables to the theoretical potential ... 28
Figure 10. Sensitivity analysis for the preliminary technical biomass energy potential ... 32
Figure 11. Root cause analysis to identify sub-components affecting key variables to the technical potential ... 32
Figure 12. Comparison of the theoretical and technical biomass energy potential (C.I. of 95% probability) ... 35
Figure 13. Comparison of the current biomass energy utilization and the technical potential ... 35
Figure 14. Theoretical (left) and technical biomass energy potential (right) for different biomass categories. Blue areas describe the preliminary estimation, while read areas describe the improved estimation. ... 36
Figure 15. Method of estimating future biomass energy potential ... 39
Figure 16. Proposed method ... 40
Figure 17. Representation of the market structure ... 40
Figure 18. Deviation between calculated and historical values ... 47
Figure 19. Theoretical biomass energy potential for calculated vs. historical production values ... 48
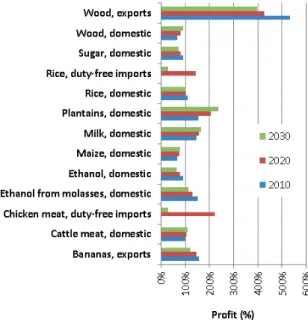
Figure 20. Profit by commodity for FAO-REF-00 ... 48
Figure 21. Profit by commodity for TAR-V1 ... 48
Figure 22. Overall profit for all scenarios ... 49
Figure 23. Agricultural area for all scenarios ... 49
Figure 24. Agricultural area by commodity for FAO-REF-00 ... 49
Figure 25. Agricultural area by commodity for TAR-V1 ... 49
Figure 26. Area for woodfuel production by scenario ... 50
Figure 27. Area for cattle for all scenarios ... 50
Figure 28. Theoretical biomass energy potential for all scenarios ... 50
Figure 29. Bioenergy potential for all scenarios ... 51
Figure 30. Difference in overall profit between reference and local biofuel scenarios ... 51
Figure 31. Agricultural area for local biofuel scenarios ... 51
Figure 32. Sugar cane area for local biofuel scenarios ... 52
Figure 33. Differences in bioenergy potential between reference and local biofuel scenarios ... 52
Figure 34. Sensitivity analysis of the theoretical biomass energy potential for FAO-REF-01 ... 52
Figure 35. Proposed method for energy technology roadmapping, adapted from (IEA, 2010) ... 56
Figure 36. Proposed strategy to build consensus ... 56
Figure 38. Technologies to deploy by bioenergy technology area ... 70
Figure 39. Modeling framework ... 75
Figure 40. Quantitative element of the modeling framework ... 77
Figure 41. Linkages between the ESM and LUTM models ... 80
Figure 42. Outlook of the energy system model (ESM) ... 82
Figure 43. Summary of the employed modeling techniques by branch ... 82
Figure 44. Process to estimate energy demand of road transport ... 83
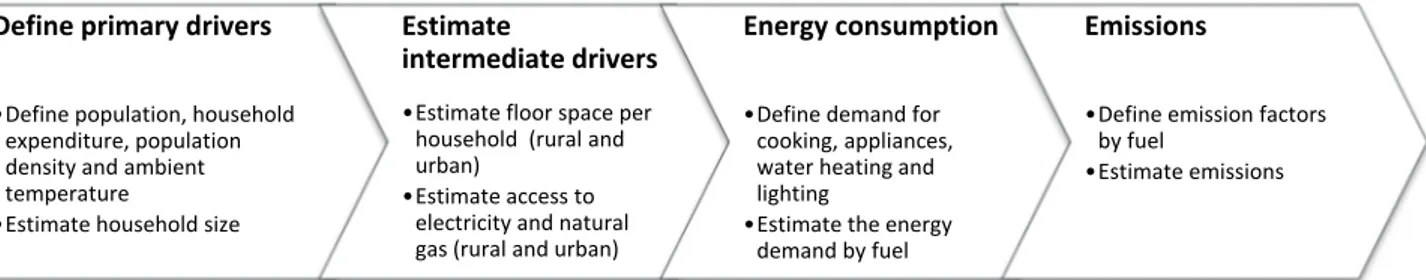
Figure 45. Method process to estimate energy demand of residential sector ... 85
Figure 46. Relationship between energy demand and drivers, adapted from (Daioglou V. , 2010) ... 85
Figure 47. Method to analyze power generation ... 87
Figure 48. Inputs and outputs of sugar cane mill ... 89
Figure 49. Sugar and bioethanol co-production routes ... 90
xv
Figure 51. Inputs and outputs of Route 2 ... 90
Figure 52. Inputs and outputs of Route 3 ... 90
Figure 53. Inputs and outputs of palm oil extraction mill ... 91
Figure 54. Inputs and outputs of the production process of biodiesel ... 91
Figure 55. Estimated access to electricity and natural gas ... 96
Figure 56. Age distribution by vehicle (MinTransporte, 2005) ... 99
Figure 57. Survival rate by vehicle type (UPME, 2010b) ... 99
Figure 58. Primary energy demand vs. GDP ... 107
Figure 59. Primary energy demand by fuel for baseline scenario ... 107
Figure 60. Differences in primary energy demand by fuel between Scenario I and baseline ... 108
Figure 61. Differences in primary energy demand by fuel between Scenario II and baseline ... 108
Figure 62. Final energy demand by sector for baseline ... 109
Figure 63. Final energy demand by fuel for baseline ... 109
Figure 64. Estimated number of vehicles... 110
Figure 65. Secondary energy demand in road transport by vehicle type ... 110
Figure 66. Secondary energy demand in road transport by fuel for baseline scenario ... 110
Figure 67. Differences in secondary energy demand in road transport between Scenario II and baseline ... 110
Figure 68. Final energy demand in the residential sector for baseline scenario ... 111
Figure 69. Demand for natural gas and biomethane for Scenarios I and II ... 111
Figure 70. Electricity supply and demand by sector for baseline scenario ... 112
Figure 71. Power generation by source for the baseline scenario ... 112
Figure 72. Energy balance in power generation for the baseline scenario ... 113
Figure 73. Power generation by source for Scenario I ... 113
Figure 74. Installed power generation capacity by source for baseline scenario ... 113
Figure 75. Differences in installed power generation capacity between Scenario I and baseline... 114
Figure 76. Contribution of hydro and bioenergy to power generation in Scenario I and baseline scenario ... 114
Figure 77. Cost of producing electricity by scenario ... 115
Figure 78. Cost of electricity by scenario ... 115
Figure 79. Cost of electricity by technology for baseline ... 115
Figure 80. Differences in cost of electricity by technology between Scenario I and baseline ... 115
Figure 81. Cost of electricity by cost type for the baseline ... 116
Figure 82. Differences in cost of electricity by cost type between Scenario I and baseline ... 116
Figure 83. Share of bioenergy by category and scenario ... 117
Figure 84. Reduction in demand for fossil fuels in Scenario I vs. baseline ... 118
Figure 85. Reduction in demand for fossil fuels in Scenario II vs. baseline ... 118
Figure 86. Land uses by scenario ... 119
Figure 87. Land for producing biofuels and woodfuel for local consumption ... 119
Figure 88. Aggregated land for producing biofuels and woodfuel for local consumption ... 120
Figure 89. Trade balance of liquid biofuels by scenario ... 120
Figure 90. Imports vs. demand for biofuels by scenario ... 121
Figure 91. Global warming potential by scenario ... 121
Figure 92. Reduction in GWP by policy measure for Scenario I ... 122
Figure 93. Reduction in GWP by policy measure for Scenario II ... 122
Figure 94. Reduction in GWP in the power generation and CHP sector for Scenario I... 122
Figure 95. Reduction in GWP in the power generation and CHP sector for Scenario II... 123
Figure 96. Domestic bioenergy-induced emissions reductions by scenario ... 123
Figure 97. Domestic bioenergy-induced savings in fossil fuel demand by scenario ... 123
Figure 98. Emissions reductions per incremental land ... 124
Figure 99. Results of the weighted mean of density (left) and residue to product ratio (right) for forestry residues ... 149
Figure 100. Special constraint factor for forestry residues ... 149
Figure 101. Weighted mean of by-product to crop ratio of cane leaves and tops ... 150
Figure 102. Weighted mean of moisture and LHV of cane leaves and tops ... 150
Figure 103. Weighted mean of moisture and LHV of cane leaves and tops (small-scale) ... 150
Figure 104. Results of the improved availability factors for key variables ... 151
Figure 105. Answers from experts regarding Part 2 of the second survey (increase share of renewable power generation) ... 163
xvi
Figure 106. Answers from experts regarding Part 3 of the second survey (increase share of bioethanol
in road transport fuel) ... 164
Figure 107. Answers from experts regarding Part 4 of the second survey (increase share of biodiesel in road transport fuel) ... 165
Figure 108. Answers from experts regarding Part 5 of the second survey (alternative biofuels and additives) ... 165
Figure 109. Capacity factor of renewable energies as a function of solar radiance (XM, 2013) ... 166
Figure 110. Capacity factor of renewable energies for arranged days in different years (XM, 2013) ... 167
Figure 111. Averaged assumed profiles for hydro and biomass-based power ... 167
Figure 112. Modeled primary energy demand vs. official data ... 173
Figure 113. Modeled GHG emissions vs. official data ... 174
Figure 114. Supply coverage of biofuels at a national level (left) and percentage of vehicles that are flex fuel (right) ... 175
Figure 115. Degradation profiles for: a) NOx, b) NMVOC, c) N2O, d) CO and e) methane emissions (Toro Gómez, Molina Vásquez, Londoño Largo, & Acevedo Cardona, 2012) ... 176
Figure 116. Household size by region and quintile ... 178
Figure 117. Estimated access to electricity by region and quintile ... 179
Figure 118. Estimated access to natural gas by region and quintile ... 179
Figure 119. Historical and estimated useful demand for water heating ... 180
Figure 120. Historical and estimated fuel shares for water heating ... 180
Figure 121. Ownership of refrigerators by region and quintile ... 180
Figure 122. Energy demand for refrigeration per capita (historical vs. estimations) ... 181
Figure 123. Ownership of air conditioners by region and quintile ... 181
Figure 124. Energy demand for air conditioning per capita (historical vs. estimations) ... 181
Figure 125. Ownership of other appliances by region and quintile ... 182
Figure 126. Energy demand for other appliances per capita (historical vs. estimations) ... 182
Figure 127. Energy demand for lighting per capita (historical vs. estimations) ... 182
Figure 128. Historical urban energy demand for cooking per capita ... 183
Figure 129. Historical and estimated rural energy demand for cooking per capita ... 183
Figure 130. Historical and estimated fuel shares for rural cooking ... 183
Figure 131. Historical and estimated fuel shares for urban cooking ... 184
Figure 132. Organized energy load shape (% of annual load), taken from (XM, 2013) ... 187
Figure 133. Results of vehicle ownership and comparison to other studies ... 194
Figure 134. Final energy demand by type in the residential sector for baseline scenario ... 194
Figure 135. Power generation by source for Scenario II ... 195
Figure 136. Differences in installed power generation capacity between Scenario II and baseline scenario ... 195
Figure 137. Differences in cost of electricity by technology between Scenario II and baseline ... 195
Figure 138. Differences in cost of electricity by cost type between Scenario II and baseline ... 195
Figure 139. GWP-100 years disaggregated by fuel for the baseline scenario ... 196
Figure 140. GWP-100 years disaggregated by category for the baseline scenario ... 196
Figure 141. Domestic bioenergy-induced emissions reductions by category and scenario ... 196
Figure 142. Approach for analyzing the different technology routes ... 197
Figure 143. GHG emissions reduction by technology route ... 201
Figure 144. Average GHG emissions reduction by technology route and effect ... 201
1
Chapter A. Introduction
A.1. Overview
Assuring the quality of life of citizens and increasing their economic prosperity are some of the most important responsibilities of a nation. One resource necessary to both quality of life, and economic development is energy. Access to energy contributes in several ways to the reduction of extreme poverty and to meeting the U.N. Millennium Development Goals: it is essential for the provision of clean water, sanitation, healthcare, reliable and efficient lighting, heating, cooking, mechanical power, transport and telecommunication services (IEA-UNDP-UNIDO, 2010). Energy is also critical in order to sustain economic growth. Economic growth has, in fact, historically been accompanied by an increasing energy demand. In the
20th century, industrialization and population growth
led to a rapid increase in energy consumption and economic growth in OECD countries. This trend has been followed in recent years by various emerging economies (e.g. Brazil, Russia, India, China and South Africa –BRICS–) and it is likely that many other developing countries will follow suit. However, the need to meet a growing energy demand to sustain economic growth has resulted in serious negative impacts. The demand for fossil fuel resources and the resulting deterioration of natural resources have dramatically increased. In a planet with finite resources, this has ultimately led to major international conflicts over resources and unsustainable environmental practices, such as deforestation, soil and water contamination, loss of biodiversity, higher greenhouse gas emissions and climate change.
Nations therefore face the critical challenge of designing energy systems able to ensure an adequate energy supply and a sustainable development, while protecting the environment and avoiding conflicts with other nations. Thus, it has become apparent that long-term and strategic planning of energy resources, as well as energy supply and demand, is urgently required. Long-term and strategic planning offers multiple benefits: a) it enables a nation to prepare for the future in an orderly and systematic way, b) it provides a basis for building consensus on needs and for measuring progress and impact and c) it turns consensus and analytical work into systematic actions. While long-term and strategic planning is highly advantageous, it is also demanding. It involves many uncertainties in a rapidly changing external environment that demands significantly more time
and resources than short-term planning (McKay, 2001).
But what exactly is strategic planning?
Generally speaking, strategic planning is the process of defining future goals for an organization (i.e. a vision) and determining the priorities and measures (i.e. strategies) to achieve that vision. In other words, strategic planning identifies what should be attempted and how to achieve it. While there is not a single, definitive and unambiguous approach for it, there are common key elements across studies:
• The span of strategic planning places emphasis on
the long-term rather than on the short-term.
• Long-term goals are measureable and achievable,
but also challenging.
• Strategic planning identifies opportunities and
barriers to achieve long-term goals.
• Strategic planning assumes that strategies can
influence certain aspects of the future and design them to exploit opportunities and overcome barriers.
In the particular context of energy, strategic planning relates to various processes (IEA, 2010; DOE-VEIC-ORNL, 2013), including:
a) Assessing the current and future energy demand and supply, policies and programs.
b) Defining a long-term energy vision, goals and strategies.
c) Identifying barriers and gaps in knowledge to achieve long-term goals.
d) Identifying specific actions (e.g. policies, funding, programs, projects, etc.) and priorities to achieve the long-term goals.
e) Developing a plan for implementing concrete actions, measuring progress and monitoring impacts.
Strategic planning can be applied to any energy technology, but for many reasons, which will now be discussed, it is particularly useful for renewable energy technologies. While benefits of renewable energies are apparent (e.g. enhancing energy security, mitigating climate change and contributing to sustainable economic development), various barriers hinder their deployment in many regions of the world. Barriers to deployment include: techno-economic barriers, regulatory and policy barriers, institutional barriers, market barriers, financial barriers,
2 environmental barriers and public acceptance barriers. Strategic planning has recently been employed in different countries to envisage a challenging, but beneficial long-term future where these barriers are overcome and the deployment of renewable energy technologies is accelerated (IEA, 2015).
The use of strategic planning to define programs to exploit biomass resources and to deploy bioenergy technologies is not new. It has been applied in numerous examples in industrialized countries and emerging economies. Examples include: global technology roadmaps on biofuels for transport (IEA, 2011b) and bioenergy for heat and power (IEA, 2012c), European Union roadmaps on biomass technology (RHC, 2014), biofuels for transport (E4tech, 2013) and biogas (AEBIOM, 2009), United States roadmaps on bioenergy and biobased products (Biomass Technical Advisory Committee, 2007) and algal biofuels technology (DOE, 2010a), a roadmap for sustainable aviation biofuels for Brazil (Boeing-Embraer-FAPESP-UNICAMP, 2014), China roadmaps on biomass energy technologies (ERI-NDRC, 2010) and rural biomass energy (Zhang, Watanabe, Lin, DeLaquil, Gehua, & Howell Alipalo, 2010), and a roadmap for biorefineries in Germany (Bundesregierung, 2012).
A.2. Motivation
While most R&D activities regarding biomass and bioenergy technologies have so far been carried out in industrialized countries and in few large economies, the largest growth in biomass to power and biofuel production is expected in developing countries (Eisentraut, 2010; IEA, 2011b; IEA, 2012c). Despite the vast potential, developing countries face several challenges to using biomass resources sustainably. Hurdles include limited industrial experience, constrained investment in R&D and absence of support policies. In order to ensure sustainable exploitation of biomass resources in the future, governmental and industrial efforts are required in developing countries and emerging economies in Africa, Asia and Latin America. These efforts include diffusing best agricultural practices, modernizing agriculture and bioenergy technology and promoting national and regional policies (IEA, 2009). Strategic planning might substantially contribute to putting these efforts into practice in a well-structured and systematic manner.
A.3. Objective and research
questions
The objective of this thesis is to develop methods for strategic planning of biomass and bioenergy technologies in developing countries. While Colombia is selected as a case study, the approach is intended to
be applicable to other countries. Colombia is selected as a case study for various reasons. Firstly, Colombia is one of the seven countries in the world where more than half of the potentially available global arable land is concentrated (FAO, 2003). Secondly, Colombia has an obvious interest in biomass as it is the second largest renewable energy resource after large hydro (UPME, 2011b). Thirdly, Colombia is currently negotiating peace agreements with guerrilla groups after a 50-year armed conflict; in a post-conflict context, Colombia faces the challenge of reinventing rural regions and planning a long-term energy system capable of supporting ambitious reforms.
In this framework, the thesis focuses on providing answers to the following research questions in the particular context of developing countries:
Q1. How to estimate the current and future biomass energy potential at a country level?
Q2. How to create a strategic plan to deploy bioenergy technologies at a country level? Q3. What are the impacts of deploying bioenergy
technologies on the future energy supply and demand, greenhouse gas emissions and land use of a country?
The three questions are approached in sequence. The first question relates to the challenge of developing well-structured approaches to quantifying the magnitude and significance of biomass in the energy mix of a country and to design structured approaches to exploit it, particularly in developing countries. The first question is addressed in Chapter C and Chapter D of this thesis. The second question addresses the challenge of identifying long-term goals regarding sustainable bioenergy deployment as well as identifying barriers and defining strategies, plans, and action items to accomplish the proposed goals. Assessing the future biomass energy potential is important in order to understand the strategic importance of biomass and to design sound policies that ensure sustainable operation and environmental benefits. The second question is addressed in Chapter E and Chapter F. Finally, the third question relates to the challenge of quantifying the impacts of deploying bioenergy technologies and of using findings to enable sound policy-making. The third question is analyzed in Chapter G.
A.4. Challenges
Applying strategic planning for exploiting biomass resources and deploying bioenergy technologies in developing countries involve various challenges that can be divided into four main categories.