1
SCIENtIFICRePoRts | 7: 9134 | DOI:10.1038/s41598-017-09530-5
www.nature.com/scientificreports
Rate of entropy model for
irreversible processes in living
systems
R. Zivieri 1,2, N. Pacini3, G. Finocchio2 & M. Carpentieri4
In living systems, it is crucial to study the exchange of entropy that plays a fundamental role in the understanding of irreversible chemical reactions. However, there are not yet works able to describe in a systematic way the rate of entropy production associated to irreversible processes. Hence, here we develop a theoretical model to compute the rate of entropy in the minimum living system. In particular, we apply the model to the most interesting and relevant case of metabolic network, the glucose catabolism in normal and cancer cells. We show, (i) the rate of internal entropy is mainly due to irreversible chemical reactions, and (ii) the rate of external entropy is mostly correlated to the heat flow towards the intercellular environment. The future applications of our model could be of fundamental importance for a more complete understanding of self-renewal and physiopatologic processes and could potentially be a support for cancer detection.
The irreversible processes in living systems are fundamental for determining the autopoietic life development and lead to entropy production in living systems1–3. Examples of irreversible chemical reactions that
repre-sent basic processes both for prebiotic life and for life development and maintenance are sodium/potassium pump, β-oxidation of fatty acids, protein catabolic process, glucose catabolism, etc. The full understanding of the non-equilibrium thermodynamics of irreversible reactions is important for the origin and the maintenance of life4, 5. Very interestingly, while mechanical phenomena are invariant under time-reversal symmetry,
thermody-namic ones introduce an arrow of time breaking this symmetry. This behaviour is naturally linked to the concept of entropy6 that, according to its first definition by Clausius and Boltzmann7, 8, describes the thermodynamics of
catabolic processes.
Recent works have shown that there is a link between the irreversible processes in the metabolic network, such as glucose catabolism, and epigenetic and gene network9–13, and that the entropy definition introduced by
Clausius and Boltzmann7, 8 is equivalent to Shannon information entropy14–19. Since the 20 s20, 21, it is known that
almost all cancer cells show a deep alteration of their metabolic networks with a marked shift towards the lactic acid fermentation or aerobic glycolysis at the expense of oxidative phosphorylation (OXPHO). Interestingly, the relation between the glucose catabolism and the gene and epigenetic network strengthens during the cancer development22–28, likewise there has been a wide use of the intensity of aerobic glycolysis in diagnostics with
correlations to cancer prognosis29–31.
Although it is well-known the crucial role played by irreversible reactions in living systems, a self-consistent description of the calculation of the entropy exchanges between the cell and the environment is missing. This is because the quantitative description of cell thermodynamics is still incomplete. Furthermore, the important quantitative aspects related to the time behaviour of entropy have not been taken into account. Indeed, it has emphasized the exergy concept regardless of the ATP yield and of coupling between exo- and endo-ergonic reactions32, 33. In other words, the concept of rate of entropy is different from the concepts of finite variations of
entropy and Gibbs free energy between reactants and products. Moreover, some in vitro experiments and bio-physical theoretical investigations have proved that the heat flow is not only the simple effect of degradation of
1Department of Physics and Earth Sciences and Consorzio Nazionale Interuniversitario per le Scienze Fisiche della
Materia, Unit of Ferrara, University of Ferrara, via G. Saragat 1, Ferrara, I-44122, Italy. 2Department of Mathematical
and Computer Sciences, Physical Sciences and Earth Sciences, University of Messina, V.le F. D’Alcontres, 31, 98166, Messina, Italy. 3Department of General Surgery and Senology, University Hospital Company, Policlinico Vittorio
Emanuele, via S. Citelli 6, 95124, Catania, Italy. 4Department of Electrical and Information Engineering, Politecnico
di Bari, via E. Orabona 4, Bari, I-70125, Italy. Correspondence and requests for materials should be addressed to R.Z. (email: [email protected])
Received: 30 March 2017 Accepted: 17 July 2017 Published: xx xx xxxx
www.nature.com/scientificreports/
2
SCIENtIFICRePoRts | 7: 9134 | DOI:10.1038/s41598-017-09530-5
energy but plays also an important role in the ionic transport and in the interactions among biomolecules such as DNA, proteins and so on34–36.
Here, we formulate a model relying on the Clausius definition of entropy and on Prigogine’s approach able to give a full thermodynamic description of the rate of entropy density production associated to irreversible chemi-cal processes in living systems. This model considers: i) the time dependence of the entropy exchanges in the cell and out of it, and ii) the effect of the cell size on the rate of entropy density production. We apply the model to the glucose catabolism in a typical human tissue represented by breast cells. The choice of glucose catabolism is essentially twofold. First, several recent works have shown its important role for the different pathways driving cancer development37–39. Second, the glucose catabolism is, among the irreversible reactions occurring in cells,
the one having the highest frequency of occurrence and the largest entropy production40. The key result of our
work on glucose catabolism is that the diffusion of chemical species gives the largest contribution to the rate of internal entropy density both in normal and cancer cells, while the rate of external entropy density, mainly due to heat diffusion, has an enhancement in cancer cells. Although most of cancer therapy is mainly pharmacological, a wider knowledge of the physical processes like, for example, the observation of temperature differences between the intracellular and the intercellular environment is important for developing new prospects in cancer detec-tion41–43. This latter aspect is widely coherent with the experimental trials and clinical data, and could open new
perspectives on the hyperthermia cancer therapy44, 45.
Model for the calculation of the rate of entropy in living systems. We have studied the cell as an open thermodynamic system in local equilibrium. Hence, starting from Prigogine’s approach46 combined with
diffusion equations valid for heat and mass transport, we have computed the rate of entropy density production =
r ds dt/ for a cell with s entropy density and t time (see Methods). The exchange of entropy occurs at two differ-ent levels, in the cell interior and with the intercellular environmdiffer-ent, hence = +r ri re where =ri ds dti/ is the rate
of internal entropy density production (RIEDP) where the subscript “i” denotes internal and =re ds dte/ is the rate of external entropy density production (REEDP) where the subscript “e” denotes external. To calculate ri we have
made the following main assumptions:
(i) Cells are assumed of cubic shape having volume Vcell = L3 with L the side of the average cube;
(ii) Flows are along a preferential direction (1D approximation) (x direction here); (iii) Irreversible processes start in the centre of the cytoplasm region, namely for x = L/2; (iv) Cross-effects in determining either the heat flow or the mass flow are absent; (v) The volume of the cell nucleus is negligible.
The model is applicable to any kind of chemical reaction involved in the metabolic cellular activity of living systems.
Assumption (i) allows the study of cells of various shapes (e.g. spherical, cylindrical, elliptical and so on) rep-resented as cubes having volumes equivalent to those of the specific shape studied. In particular, assumption (i) applies to several epithelium tissues like, for example, the breast epithelium and the exocrine glands epithelium whose shape is columnar47. As cellular processes occur prevalently along a preferential direction48, typically
assumption (ii) is valid in real systems. Assumption (iii) is supported by the fact that mytochondria, where most of the catabolic processes in normal and cancer cells occur (e.g. Krebs cycle, β-ossidation and part of protein catabolism), are approximately placed in the perinuclear region49. Moreover, in cancer cells also lactic acid
fer-mentation takes place in the mytocondrial region. However, note that in some cases a few catabolic reactions like, for instance chemotaxis, occur in cell peripheral zones. In these specific cases, it would be enough to make a translation of the origin of L/2 to the cell border. Assumption (iv) is consistent in the presence of polarization effects occurring in cells48, 50. Assumption (v) is reasonable in most of the cells being the volume of the nucleus
much smaller than Vcell49. By taking into account all the above assumptions, we have computed
= + +
r x ti( , ) r x ti Q( , ) r x ti D( , ) r x ti r( , ) where ri Q (x,t) is due to heat flow with the subscript “Q” labelling heat, ri D (x,t) is caused by molecules diffusion with the subscript “D” standing for diffusion and ri r (x,t), with the
sub-script“r” indicating reactions, is directly related to irreversible chemical reactions. All terms are products between thermodynamic forces and flows generated by them. In explicit form, for any irreversible reactions, the contribu-tion due to heat flow ri Q (x,t) is given by
α = ∑ − π κ = ∞ − − π −τ r x t n x e e T x t ( , ) cos (2 1) [ ( , )] (1) i Q n 1 L (2n 1) t 2 2 L t 2 2 2 Here, α = pK16 TL02
2 with p the weight associated to the specific chemical reaction evaluated as a function of the
occurrence frequency of the reaction, K is the thermal conductivity, κ is the thermal diffusivity and τ is a typical cell decay time. The term T x t( , )= 4πT0∑∞n=1 − π − −κ −
π
n x n e
sin (2 1)L /(2 1) (2n 1) Lt
2 2
2 is the temperature
distribu-tion (see Supplementary informadistribu-tion, Secdistribu-tion 2, equation (S3) and equation (S5)) showing that the temperature inside the cell has a weak spatial dependence coherently with the data obtained by means of fluorescent tech-nique43. The cosine series at the numerator results both from the calculation of the thermodynamic force
calcu-lated as the gradient of the inverse of the temperature distribution and the heat flow proportional to the spatial derivative of T (x,t) (see Supplementary information, Section 2, equation (S6) and equation (S7), respectively).
www.nature.com/scientificreports/
3
SCIENtIFICRePoRts | 7: 9134 | DOI:10.1038/s41598-017-09530-5
∑ β = − ∑ − π κ − = − − = ∞ − − − − τ π r x, t x L e t u ND e n x e e T x t ( ) ( /2) 4 cos (2 1) [ ( , )] (2) iD k N k m k k x L D t n L n t x L L 3/2 1 ( /2) 4 1 (2 1) /2 / 2 t k L 2 2 2 2 Here, β = π V T 1 1 0 1
2 cell , N is the number of chemical species involved in the reaction and µ
= − − + τ
x t u e
( , )
k k (x L/2 /L t/ )
is the kth chemical potential with u
k the partial molar energy, Dk is the corresponding mass diffusion coefficient
and Nm k is the number of moles of the kth chemical species. It is e− −(x L/2)/L (e−( /2L −x L)/) for 0 ≤ x ≤ L/2 (L/2 ≤ x
≤ L). The cosine series at the numerator results from the thermodynamic force evaluated as the gradient of the ratio between the chemical potential and the temperature distribution, while the Gaussian distribution comes from the diffusion flow proportional to the derivative of the number of moles per unit volume (see Supplementary information, Section 2, equation (S11) and equation (S15), respectively).
Finally, ri r (x,t) is γ ν = − ∑ τ + = − | − | +
(
)
r x t V k u e N N T x t ( , ) 1 [ ( , )] (3) ir p q kN k k x L L t mp mq cellkin 1 ( /2 / / ) A reag B reag 2
where, γ = π4T0, kkin is the pathway kinetic constant of the given irreversible process with “kin” standing for kinetic, νk are stoichiometric coefficients, µk( , )x t =u ek − −(x L/2 /L t+/ )τ is the chemical potential of the kth species.
Here p = 0, 1, 2, q = 0, 1, 2 and p + q = 1, 2 for first- and second-order irreversible chemical reactions, respectively and N V mAreag cell ( N V mBreag
cell ) is the molar concentration of reagent A (B) taking the volume of the solution equal to Vcell. The
dependence on the chemical potential and on the molar concentrations at the numerator results from the defini-tion of affinity and of the velocity of the given reacdefini-tion (see Supplementary informadefini-tion, Secdefini-tion 2, equation (S20), equation (S21) and equation (S22), respectively). For the detailed derivation of equations (1–3), see Supplementary Information, Section 2.
We now discuss r x te( , ) calculated by taking into account assumptions (i), (ii) and (v). We express
= +
r x te( , ) r x teQ( , ) re exch( , )x t, where re Q (x,t) is the contribution due to heat released by the cell in the
inter-cellular environment, while re exch (x,t), with “exch” standing for exchanges, is the one related to exchanges of
matter with the intercellular environment.
The derivation of re Q (x,t) lies on simple thermodynamic considerations. Specifically, we have used the first
principle of thermodynamics for the expression of the heat released, the solution of heat equation in the intercel-lular environment (see Supplementary information, Section 3 equation (S29)) and exploiting the analogy of the behaviour of the cellular system mainly composed by water with that of an ideal gas. As in the case of a monoa-tomic gas, we derive the cell internal energy starting from its partition function that has a direct thermodynamic relation with the internal energy. It turns out that re Q (x,t) reads
δ κ − r x t N x L t ( , ) ( ) (4) eQ mpr 2 2 Here, δ = V1 38 B Ak N
cell with kB the Boltzmann constant, NA the Avogadro number and Nmpr is the number of moles
of the products in every irreversible process. Instead, re exch is ∑ η τ = − κ τ − = − − + r x t t e u e d N d ( , ) (5) e x L t k N k x L L t e m k exch 1 2 (4 ) 1 ( /2 / / ) 1 2 pr Here, η =V1 1 (4x π κT ) cell 0 1 2
0 , where x0 is a characteristic length of the order of the size of the normal cell, T0 is the
max-imum intercellular temperature, dτ1 is a characteristic time of the order of the inverse of kkin, Npr is the number of
products of the irreversible chemical process with “pr” indicating products and d Ne mk is the variation of the
num-ber of moles of the products of the irreversible reaction. To derive equation (5) we have substituted the intercellu-lar temperature distribution determined by solving the heat equation in the intercelluintercellu-lar environment with no boundary conditions and the expression of the chemical potential. For the detailed calculations leading to equa-tions (4) and (5), respectively see Supplementary Information, Section 3 for the detailed.
As expected, equations (1)–(5) do not fulfil the time-reversal symmetry ( ( , )r x t =r x( ,−t)) and this is an elegant demonstration of the irreversible nature of spontaneous processes occurring in living systems. Finally, note that the model developed for a single cell can be extended to a tissue by generalizing equations (1)–(5) to the number of cells composing it and by considering their mutual interactions but this is outside the scope of this work.
Application of the rate of entropy model to glucose catabolism in normal and cancer breast cells. We have applied the general model, described in the previous section, to glucose catabolism in a typical epithelial breast tissue. In a cell, the glucose catabolism is an essential step in the production of ATP for energy purposes. In general, in differentiated cells there is the production of about 80–90% of the ATP through OXPHOs,
www.nature.com/scientificreports/
4
SCIENtIFICRePoRts | 7: 9134 | DOI:10.1038/s41598-017-09530-5
while in undifferentiated cells or cancer cells, where there is a prevalence of lactic acid fermentation, this ratio can considerably change and sometimes it can even invert. In the same interval of time the major rapidity of the fermentation process produces a high amount of ATP, as long as a high uptake of glucose and a high expression and activity of lactic acid dehydrogenase, conditions that are present in the predominantly fermentative cellular systems. In addition, there is a major number of processed molecules through the fermentative way in order to maintain a sufficient stock of ATP. In normal cells, the glucose catabolism is 80% through OXPHOs and 20% through lactic acid fermentation, while in cancer cells 90% occurs through lactic acid fermentation and 10% through OXPHOs20, 21.
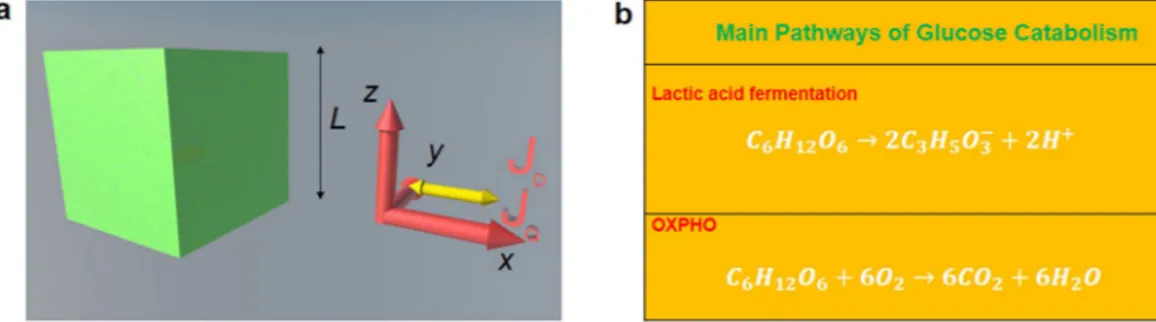
We show the representative cell (either normal or cancer) in the form of a cubic cell of average side L and the glucose catabolism process in Fig. 1 where JQ is the internal heat flow and JD is the internal diffusion flow.
In the numerical calculations, we have taken the typical sizes of epithelial cells of human breast tissue (normal or cancer). Specifically, we have employed an average size L = 10 μm for the normal cell and L = 20 μm for the cancer cell51. Moreover, the membrane between the cell and the intercellular environment is of the order of a few
Angstroms and it is much smaller than the cell size so that it can be neglected. In addition, for the same tissue we have taken an average size of the intercellular space about 0.2–0.3 μm between two adjacent normal cells and about 1.5 μm between two cancer cells52. Within the 1D model employed the flows and the thermodynamic
forces generating the flows occur along the x direction in the cytoplasm and on both sides. Indeed, according to assumption iii), we have considered that all processes originate in the centre of the cell at x = L/2 for values of y and z coordinates corresponding to cytoplasm region.
We distinguish between two kinds of reactions. The first one refers to the cell respiration process involv-ing the catabolism of glucose (C6H12O6) via the oxygen molecule (O2) and consists of: (a) glycolysis (b) Krebs
cycle and (c) oxidative phosphorylation. The general balancing of all reactions is summarized in the simple form C6H12O6 + 6O2 → 6 CO2 + 6 H2O leading to the formation of carbon dioxide (CO2) and water (H2O). The second
process is the lactic acid fermentation process with no Krebs cycle and oxidative phosphorylation. The corre-sponding reaction leads to the formation of lactic acid ions (C3H5 O3−) and is summarized in the simple form
C6H12O6 → 2 C3H5 O3− + 2 H+. For our purposes, we have not considered the NAD+/ NADH and purine
nucle-otides such as ATP/ADP/AMP53 because their concentrations vary within small ranges and do not affect the
calculation of the RIEDP and REEDP. Furthermore, the oxide/reduction reactions of NAD+/NADH are reversible
and the reactions leading to ATP synthesis molecule are not spontaneous and processes irreversible54, 55. For the
sake of simplicity, note that here we describe the stoichiometric balancing of the above reactions by considering one mole of glucose even though during the glucose catabolism the range of glucose concentration in a single cell is between pico- and micromoles.
Results
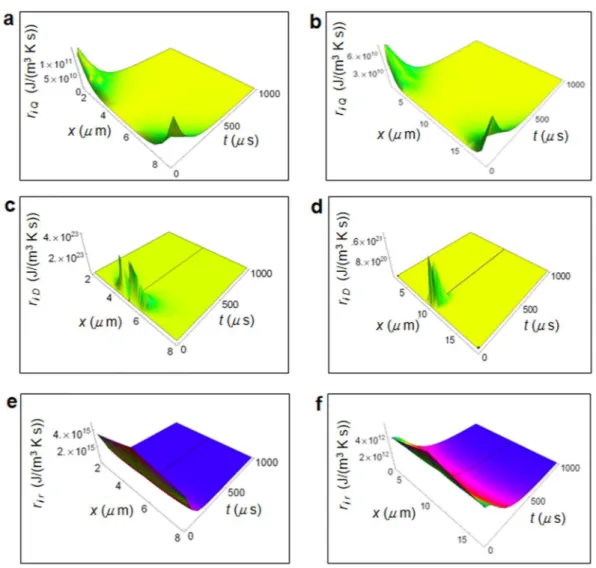
Numerical calculation of the rate of internal entropy density production for breast cells.
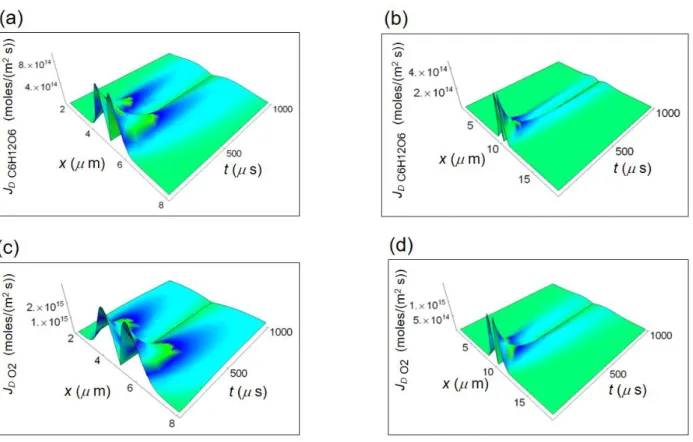
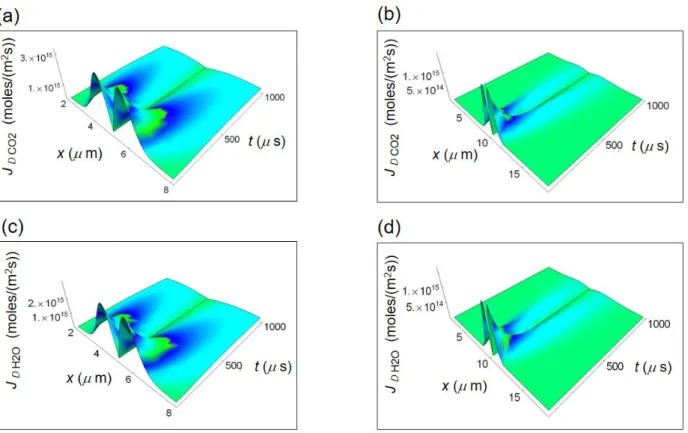
Figure 2 shows the RIEDP calculated for a normal and cancer breast cell as a function of the spatial coordinate and time56 obtained by using the chemical potentials and diffusion coefficients in Tab.1. The use of the chemical
potential at standard conditions shown in Table 1 in the numerical calculations is justified by the fact that, within the ideal gas description of a cell, the temperature dependent chemical potential μ (T) is very close to the μ at standard conditions from the Gibbs-Duhem relation being the pressure inside a cell close to the atmospheric pressure.
We have chosen the time interval of 1000 μs because it a typical internal time57 for most biological processes.
ri Q, was calculated using equation (1) taking K = 0.600 J/(m s K), κH20 = 0.143 ×10⁻⁶ m2/s, the thermal diffusivity
in water and p = 0.85 (0.90) for normal (cancer) cells21, 38. r
i D was calculated according to equation (2), while ri r
was calculated according to equation (3) applied to glucose catabolism (see Supplementary Information, Section 2, equations (S17) and (S26), respectively for more details). In addition, Nresp = 4 (Nferm = 3) is the number
of chemical species involved in the respiration (fermentation) process, wresp = 0.8 (wferm = 0.2) with “resp” (“ferm”)
labelling respiration (fermentation) are the corresponding weights of the respiration (fermentation) processes for a normal cell and wresp = 0.1 (wferm = 0.9) for a cancer cell37–39. We have also taken the pathway kinetic constants
Figure 1. Cell representation and balancing of glucose catabolism. (a) Sketch of the cubic cell according to the
cyto-morphological features of the epithelial tissue chosen as the reference tissue in our theoretical model. (b) Schematics of main pathways of glucose catabolism. The internal heat flow and the mass diffusion flow start in the cytoplasm region for x = L/2 and are along + x and −x directions as shown by the yellow arrows.
www.nature.com/scientificreports/
5
SCIENtIFICRePoRts | 7: 9134 | DOI:10.1038/s41598-017-09530-5 kkinresp = 10−4/s and k
kinferm = 10−5/s and both processes, in general, are first-order chemical reactions57. In addition,
we have used τ = 10−4 s as typical cell decay time and N =1
m C H O6 12 6 for both respiration and fermentation
processes.
ri Q shown in Fig. 2a and b has a strong variation going towards cell borders and quickly decreases with time. ri D depicted in Fig. 3c and d exhibits a significant magnitude close to the centre of the cell and strongly decreases
towards the border and with increasing time. ri r displayed in Fig. 2e and f is maximum close to the centre of the
cell, slightly reduces the amplitude towards the cell border and strongly decreases with increasing time especially
Figure 2. Calculated RIEDP during glucose catabolism for a breast cell. (a) RIEDP associated to heat flow for
a normal cell. (b) RIEDP associated to heat flow for a cancer cell. (c) RIEDP related to matter diffusion for a normal cell. (d) RIEDP related to matter diffusion for a cancer cell. (e) RIEDP due to irreversible reactions for a normal cell. (f), RIEDP due to irreversible reactions for a cancer cell.
Chemical species Chemical potential μ (kJ/mole) T = 298 K, p = 1 atm Diffusion coefficient D in H2O (m2/s) T = 298 K, p = 1 atm
C6H12O6 −917.44 6.73 × 10⁻¹⁰ O2 16.44 21.00 × 10⁻¹⁰ CO2 −385.99 19.20 × 10⁻¹⁰ H2O −237.18 21.00 × 10⁻¹⁰ Lactate ion C3H5O3− −516.72 9.00 × 10 −10 H+ aqueous solution 0 45.00 × 10⁻¹⁰
Table 1. Chemical potentials and diffusion coefficients for the chemical species involved in glucose catabolism
for cell respiration and lactic acid fermentation. The data are from G. Job and R. Rüffler, Physikalische Chemie, Vieweg + Teubner Verlag Springer (2011).
www.nature.com/scientificreports/
6
SCIENtIFICRePoRts | 7: 9134 | DOI:10.1038/s41598-017-09530-5
in a normal cell. Both riD and rir are much greater than ri Q and are about two order of magnitude greater in a
nor-mal cell with respect to a cancer cell.
Numerical calculation of the rate of external entropy density production for breast cells.
Figure 3 displays calculated re Q and re exch for a normal and a cancer breast cell starting from the cell border to
the border of the adjacent cell taking into account the typical size of the intercellular space for this tissue, namely about 0.2 – 0.3 μm for a normal cell and about 1.5 μm for a cancer cell52.
re Q was calculated according to equation (4) applied to glucose catabolism, while re exch was calculated
accord-ing to equation (5) applied to glucose catabolism (see Supplementary information, Section 3, equation (S32) and equation (S36), respectively). The parameters used in the numerical calculations are kB = 1.3805 × 10⁻²³ J/K, Nmpr resp = 12,
the number of moles of the products of respiration, Nmpr resp = 4, the number of moles of the lactic acid
fermen-tation reaction. In addition, like for the calculation of the rate of internal entropy density production we have taken wresp = 0.8 (wferm = 0.2), the corresponding weights of the respiration (fermentation) processes for a normal
cell and wresp = 0.1 (wferm = 0.9) for a cancer cell37–39. The trend of re Q and re exch for cancer cells is suitable to the
observations29, 30, 32.
As shown in Fig. 3a and b, re Q increases as a function of x for vanishing time and decreases with increasing
time. re exch displayed in Fig. 3c and d does not vary appreciably as a function of x and decreases with increasing
time. The magnitude of re Q is much larger than the corresponding re exch and this behaviour is enhanced in cancer
cells where re Q is about one order of magnitude larger than in normal cells.
Discussion
According to the described model, we can draw important conclusions about the cell behaviour during glucose catabolism in terms of entropy production. While ri is mainly due to matter exchanges, the greatest contribution
to re comes from the heat irreversible release. Moreover, the amount of re is greater for a cancer cell and, due to the
minor volume of a normal cell, ri is on average greater for a normal cell. In contrast, re is greater in a cancer cell
due to the larger contribution of re Q because of the prevalence of the dependence on the spatial coordinate with
respect to that on the cell volume.
Note that we have applied the model to the particular case of cells belonging to breast tissue but it would be still valid if applied to different tissues characterized by other volume ratios between normal and cancer cells and easily extended to staminal cells that are of much smaller size.
As shown in Figs 2 and 3 for the epithelium breast normal and cancer cells, we have proved that
= +
r x t( , ) r x ti( , ) r x te( , ) tends towards a minimum value with increasing time such that the cell reaches a state of global equilibrium in accordance with the minimum dissipation Prigogine’s theorem. Moreover, looking espe-cially at Fig. 2 displaying r x ti( , ), the rate of entropy density production tends to its minimum value more slowly in a cancer cell with respect to a normal cell. This is a key point because it demonstrates that the tendency to sta-bility or equivalently to global equilibrium is slower in a cancer cell. We can easily prove the fulfilment of the minimum dissipation Prigogine’s theorem calculating r x t( , ) for the other irreversible reactions via equations (1–5). So far, there has been an application of this theorem to the uptake of the oxygen molecule in cells that is proportional to the released heat. However, albeit partially correct, this application does not take into account the
Figure 3. Calculated REEDP during glucose catabolism for a breast cell. (a) REEDP associated to heat flow for a
normal cell as a function of the spatial and time coordinates. (b) REEDP associated to heat flow for a cancer cell. (c) REEDP due to exchange of matter for a normal cell. (d) REEDP due to exchange of matter for a cancer cell.
www.nature.com/scientificreports/
7
SCIENtIFICRePoRts | 7: 9134 | DOI:10.1038/s41598-017-09530-5
weight of glycolysis and of lactic acid fermentation or of other chemical reactions involving oxygen consumption. Instead, our model overcomes these limits encompassing quantitatively all those aspects and is not restricted to oxygen molecule consumption. We emphasize that the minimum dissipation of entropy is necessary to establish a condition compatible with the behaviour of Gibbs free energy in living systems because of the thermodynamic relation among free energy, enthalpy and entropy.
At the same time, we believe that the model, although giving general relations, represents a starting point and the results obtained are only an indication of what could occur in a specific calculation. Moreover, note that the calculated rates of entropy are not purely theoretical but strongly depend on consolidated experimental data like, for example, the frequency of occurrence of an irreversible process, the cellular volume and the average intercel-lular size. We wish that some experiments along this direction will be carried out to verify the importance of the calculations because we believe that measurements of the rate of entropy could bring new fundamental knowl-edge in the field shedding light on the important role played by metabolic, epigenetic and gene networks in living systems. For example, the number of moles of chemical species appearing in the main pathways like OXPHO and lactic acid fermentation can be carefully measured, e.g in vitro/in vivo via imaging techniques by means of Nuclear Magnetic Resonance or Positive Emission Tomography (PET). This leads to a quantitative estimate of the rate of entropy due to mass transport opening the root for new measurements in cell biology. Note that the model can be applied to surfaces of internal parenchyma generalizing the rate of entropy relations found for a single cell to agglomerates of cells displayed with PET technique. On the other hand, measurements done by means of microcalorimetry technique may be employed to quantify the heat flow.
As the glucose catabolism is strongly correlated with the development of cancer and self-renewal processes, the described model, if validated by specific and real measures of glucose absorption29, 30 could introduce a new
way to quantify the glucose catabolism in relation to the exchange of entropy occurring during this irreversible process.
Moreover, the interplay between the glucose uptake or production of lactate ion and the rate of entropy might be particularly important for clinical studies on cancer development and self-renewal process58. It is also
interest-ing to note that the developed formalism might be used also for electrophysiological processes with special regard to ionic fluxes. These processes have a crucial role in the development and progression of neoplastic processes and, in addition, the modulation of ionic currents might modulate the patterns of metabolic network42, 59.
In summary, although the thermodynamics of irreversible processes introduced by De Donder and subse-quently developed by Prigogine is, often, regarded as mainly theoretical and speculative, it could play a crucial role in describing a unified phenomenological paradigm of biological systems. More precisely, when modern biology faces the challenge of a systemic vision of life in terms of interactions among complex networks, the study of the rate of entropy represents a starting point able to reveal the phenomenological and unitary feature of life. Indeed, our results show that the study of the rate of entropy density production open new perspectives in mod-ern biology giving a simple picture of irreversible processes in living systems.
Methods
Basic principles. Let us consider an open system (cell) that exchanges energy and matter with the environ-ment. For a system in local equilibrium but not in global equilibrium, it is convenient to define an entropy density
=
s S V/ cell with = +s si se where si is the internal entropy density (subscript “i” indicates internal), se the external
entropy density (subscript “e” indicates external) and Vcell the volume of the cell. The entropy density infinitesimal
variation =ds dsi+dse includes the contribution dsi related to internal irreversible processes and dse associated
to the external exchanges of heat and matter with the intercellular environment. To fully describe the temporal evolution, it is useful to define the rate of entropy density production in a time interval dt in the form
= +
r ds dti/ ds dte/ . This quantity gives a direct measure of irreversible processes.
Rate of internal entropy density production. First, we express in a time interval dt the rate of internal entropy density production =ri dsdti giving the amount of local increase of entropy inside a cell that can be
regarded as a continuous system. In a compact form43
∑ µ ∑ = ∇ ∇ ⋅ − ⋅ + = = r , t T , t , t t T , t , t T , t A , t x x J x x x J x x x ( ) 1 ( ) ( ) ( , ) ( ) ( ) 1 ( ) ( ) v (6) i u k N k D k j M j j 1 1
Here, the first term on the second member is associated with the internal flow =Ju JQ+ ∑kN=1uk D kJ , with N the
number of chemical species, getting contributions from irreversible heat flow JQ and diffusion flow JD k and driven
by the heat thermodynamic force F x( , t)= ∇( (T , tx ))−
u 1. The second term is related to the diffusion flow JD k
and is driven by the matter thermodynamic force F xk( , t)= ∇
( )
µT , tk( )( , )xxt with µk the chemical potential of the kth
chemical species.
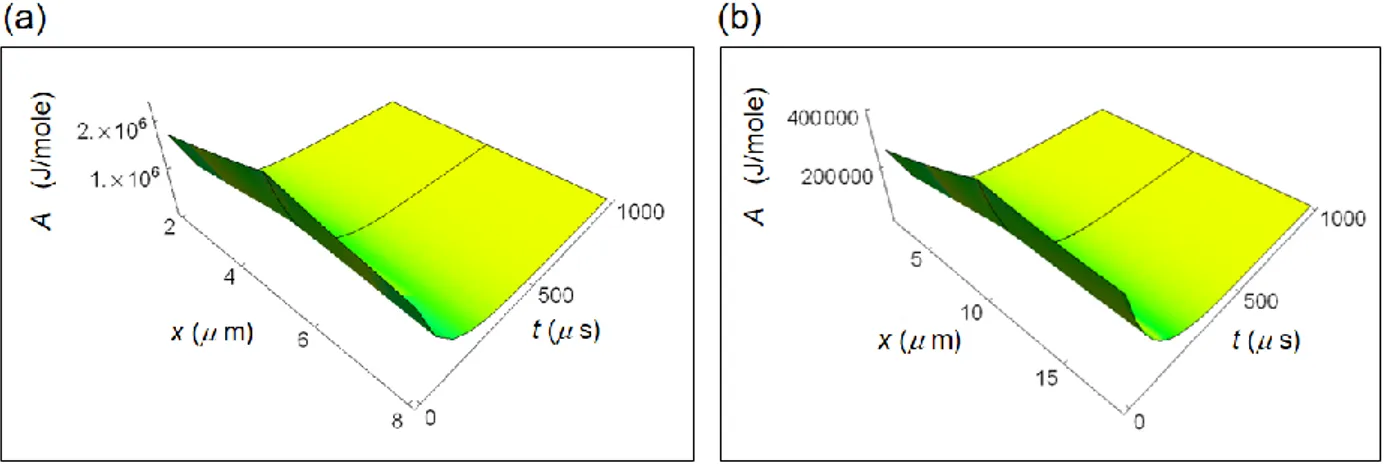
Finally, the last term is associated with irreversible reactions being M the number of chemical reactions with the thermodynamic force represented by the affinity Aj( , )x t = − ∑kN=1ν µjk k( , )x t with νjk the stoichiometric
coefficients, and the corresponding flow by the velocity of the jth reaction = ξ vj V d dt 1 cell j with ξd
j the variation of the jth degree of advancement.
Rate of external entropy density production. We express, in the same time interval dt the rate of exter-nal entropy density production =re dsdte giving the amount of local increase of entropy outside the cell corre-sponding to the intercellular environment. In its general form
www.nature.com/scientificreports/
8
SCIENtIFICRePoRts | 7: 9134 | DOI:10.1038/s41598-017-09530-5
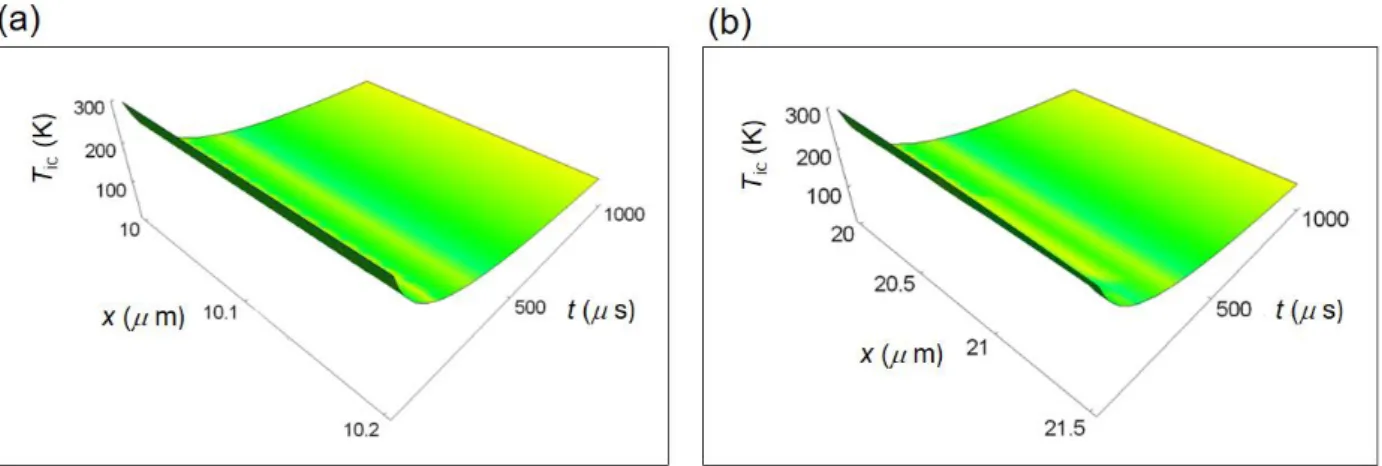
∑µ = − = r t T t V dQ dt T t t d Ndt x x x x ( , ) 1 ( , ) 1 1 ( , ) ( , ) (7) N e k k e mk ic cell ic 1 pr here, V1 dQdt = dudt +V1 pdVdt
cell cell according to the first principle of thermodynamics. dQ=dU+pdV with dQ the
infinitesimal heat transfer, =du V1dU the infinitesimal variation of the internal energy density u (dU is the infin-itesimal variation of the internal energy U), p the pressure and dV the infininfin-itesimal variation of the volume V. In addition, Tic(x, t) is the intercellular temperature distribution and deNm k the variation of the number of moles of
the kth chemical species with Npr the number of products of the irreversible reaction (“pr” indicates products) due
to exchange of matter with the intercellular environment.
The first term on the second member expresses the heat flow outside the cell, while the second one results from the exchange of matter with the intercellular environment.
Diffusion equations. In order to find the heat and mass flow appearing in the expression of the RIEDP given in equations (1) and (2), we employ the well-known heat and mass transport equations. We consider a rectangular frame xyz with the origin in the center of the cell and we suppose that the flow direction is along x (see Fig. 1).
Concerning the heat diffusion, it is mainly due to a conduction transport neglecting the convection transport present to a much lesser extent inside a typical cell and the term of heat source. Hence, it is
κ ∂ ∂ = ∇ T t t T t x x ( , ) ( , ) (8) 2
where the solution T(x,t) is the temperature distribution function depending on both spatial and time variable,
κ =cKρ
s is the thermal diffusivity (m
2 s−1) with K the thermal conductivity expressed in J m−1 s−1 K−1) and
sup-posed uniform, cs the specific heat expressed in J Kg−1 K−1 and ρ the density expressed in Kg m−3. The flow JQ( , )x t is proportional to the spatial derivative of T( , ).x t
Analogously, the mass transport equation or Fick’s second diffusion law reads ∂ ∂ = ∇ n t t D n t x x ( , ) ( , ) (9) 2
where, the solution n( , ) is the concentration of molecules, a distribution function depending both on spatial x t
and time variables and D is the diffusion coefficient (m2 s−1) supposed uniform. The flow J ( , )x t
D is proportional
to the spatial derivative of n( , ).x t
References
1. Prigogine, I., Mayné, F., George, C. & De Haan, M. Microscopic theory of irreversible processes. Proc. Natl. Acad. Sci. 74, 4152–456 (1977).
2. Lucia, U. The Gouy-Stodola Theorem in Bioenergetic Analysis of Living Systems (Irreversibility in Bioenergetics of Living Systems).
Energies 7, 5717 (2014).
3. Zotin, A. A. & Zotin, A. I. Phenomenological theory of ontogenesis. Int. J. Dev. Biol. 41, 917–921 (1997). 4. Luisi, P. L. The minimal autopoietic unit. Orig. Life Evol. Biosph. 44, 335–338 (2014).
5. Keller, M. A., Turchyn, A. V. & Ralser, M. Non-enzymatic glycolysis and pentose phosphate pathway-like reactions in a plausible Archean ocean. Mol. Syst. Biol. 10, 725 (2014).
6. Nicolis, G. & Prigogine, I. Self-organization in non-equilibrium systems (Wiley, 1977). 7. Clausius, R. The Mechanical Theory of Heat. London (Taylor and Francis, 1867). 8. Huang, K. Statistical mechanics (Wiley, 1987).
9. Wong, C. C., Qian, Y. & Yu, J. Interplay between epigenetics and metabolism in oncogenesis: mechanisms and therapeutic approaches. Oncogene 36, 1–16 (2017).
10. Peng, M. et al. Aerobic glycolysis promotes T helper 1 cell differentiation through an epigenetic mechanism. Science 354, 481–484 (2016). 11. Moussaieff, A. et al. Glycolysis-mediated changes in acetyl-CoA and histone acetylation control the early differentiation of
embryonic stem cells. Cell Metab. 21, 392–402 (2015).
12. Gut, P. & Verdin, E. The nexus of chromatin regulation and intermediary metabolism. Nature 502, 489–498 (2013).
13. Hino, S., Nagaoka, K. & Nakao, M. Metabolism-epigenome crosstalk in physiology and diseases. J. Hum. Genet. 58, 410–415 (2013). 14. Banerji, C. R. et al. Cellular network entropy as the energy potential in Waddington’s differentiation landscape. Sci. Rep. 3, 3039 (2013). 15. Himeoka, Y. & Kaneko, K. Entropy production of a steady-growth cell with catalytic reactions. Phys. Rev. E 90, 042714 (2014). 16. Vilar, J. M. G. Entropy of Leukemia on Multidimensional Morphological and Molecular Landscapes. Phys. Rev. X 4, 021038 (2014). 17. Ridden, S. J., Chang, H. H., Zygalakis, K. C. & MacArthur, B. D. Entropy, Ergodicity, and Stem Cell Multipotency. Phys. Rev. Lett.
115, 208103 (2015).
18. Banerji, C. R., Severini, S. & Teschendorff, A. E. Network transfer entropy and metric space for causality inference. Phys. Rev. E 87, 052814 (2013).
19. Funo, K., Shitara, T. & Ueda, M. Work fluctuation and total entropy production in nonequilibrium processes. Phys. Rev. E 94, 062112 (2016).
20. Warburg, O. On respiratory impairment in cancer cells. Science 124, 269–270 (1956).
21. Pacini, N. & Borziani, F. Cancer stem cell theory and the warburg effect, two sides of the same coin? Int. J. Mol. Sci. 15, 8893–8930 (2014). 22. Pacini, N. & Borziani, F. Oncostatic-Cytoprotective Effect of Melatonin and Other Bioactive Molecules: A Common Target in
Mitochondrial Respiration. Int. J. Mol. Sci. 17, 344 (2016).
23. Wang, P., Wan, W., Xiong, S. L., Feng, H. & Wu, N. Cancer stem-like cells can be induced through dedifferentiation under hypoxic conditions in glioma, hepatoma and lung cancer. Cell Death Dis. 3, 16105 (2017).
24. Qian, X., Hu, J., Zhao, J. & Chen, H. ATP citrate lyase expression is associated with advanced stage and prognosis in gastric adenocarcinoma. Int. J. Clin. Exp. Med. 8, 7855–7860 (2015).
25. Li, X. et al. Metabolic reprogramming is associated with flavopiridol resistance in prostate cancer DU145 cells. Sci. Rep. 7, 5081 (2017). 26. Lévy, P. & Bartosch, B. Metabolic reprogramming: a hallmark of viral oncogenesis. Oncogene 35, 4155–4164 (2016).
www.nature.com/scientificreports/
9
SCIENtIFICRePoRts | 7: 9134 | DOI:10.1038/s41598-017-09530-5
27. Baumann, K. Stem cells: A metabolic switch. Nat. Rev. Mol. Cell Biol. 2, 64–65 (2013).
28. Ito, K. & Suda, T. Metabolic requirements for the maintenance of self-renewing stem cells. Nat. Rev. Mol. Cell Biol. 4, 243–256 (2014). 29. Marinelli, B. et al. Prognostic value of FDG PET/CT-based metabolic tumor volumes in metastatic triple negative breast cancer
patients. Am. J. Nucl. Med. Mol. Imaging 6, 120–127 (2016).
30. Grootjans, W. et al. PET in the management of locally advanced and metastatic NSCLC. Nat. Rev. Clin. Oncol. 12, 395–407 (2015). 31. Wulaningsih, W. et al. Serum lactate dehydrogenase and survival following cancer diagnosis. Br. J. Cancer 113, 1389–1396 (2015). 32. Lucia, U. & Grisolia, G. Second law efficiency for living cells. Front. Biosci. 9, 270–275 (2017).
33. Ozernyuk, N. D., Zotin, A. I. & Yurowitzky, Y. G. Deviation of the living system from the stationary state during oogenesis. Wilhelm
Roux Archiv. 172, 66–74 (1973).
34. Lucia, U. Bioengineering Thermodynamics: An Engineering Science for Thermodynamics of Biosystems. IJoT 18, 254–265 (2015). 35. Lucia, U. Carnot efficiency: Why? Physica A 392, 3513–3517 (2013).
36. Lucia, U. Electromagnetic waves and living cells: A kinetic thermodynamic approach. Physica A 461, 577–585 (2013).
37. Daniele, S. et al. Lactate dehydrogenase-A inhibition induces human glioblastoma multiforme stem cell differentiation and death.
Sci. Rep. 5, 15556 (2015).
38. Son, M. J. et al. Upregulation of mitochondrial NAD+ levels impairs the clonogenicity of SSEA1+ glioblastoma tumor-initiating cells.
Exp. Mol. Med. 49, e344 (2017).
39. Sancho, P., Barneda, D. & Heeschen, C. Hallmarks of cancer stem cell metabolism. Br. J. Cancer 114, 1305–1312 (2016). 40. Scott, C. B. A Primer for the Exercise and Nutrition Sciences (Humana Press, 2008).
41. Lucia, U. et al. Constructal thermodynamics combined with infrared experiments to evaluate temperature differences in cells. Sci.
Rep. 5, 11587 (2015).
42. Lucia, U., Ponzetto, A. & Deisbock, S. T. Constructal approach to cell membranes transport: Amending the ‘Norton-Simon’ hypothesis for cancer treatment. Sci. Rep. 6, 19451 (2016).
43. Okabe, C. et al. Intracellular temperature mapping with a fluorescent polymeric thermometer and fluorescence lifetime imaging microscopy. Nat. Comm. 3, 1714 (2012).
44. Kase, K. & Hahn, G. M. Differential heat response of normal and transformed human cells in tissue culture. Nature 255, 228–230 (1975). 45. Ohtake, M. Hyperthermia and chemotherapy using Fe (Salen) nanoparticles might impact glioblastoma treatment. Sci. Rep. 7, 42783
(2017).
46. Kondepudi, D. & Prigogine, I. Modern thermodynamics: From heat engines to dissipative structures (Wiley, 2015). 47. Dabbs, D. J. et al. Molecular alterations in columnar cell lesions of the breast. Mod. Pathol. 19, 344–349 (2006).
48. Iden, S. & Collard, J.G. Crosstalk between small GTPases and polarity proteins in cell polarization. Nat. Rev. Mol. Cell Biol. 9, 846–859 (2008).
49. Lim, C. S. et al. Measurement of the nucleus area and nucleus/cytoplasm and mitochondria/nucleus ratios in human colon tissues by dual-colour two-photon microscopy imaging. Sci. Rep. 5, 18521 (2015).
50. Deng, D. et al. Molecular basis of ligand recognition and transport by glucose transporters. Nature 526, 391–396 (2015).
51. Geltmeier, A. et al. Characterization of dynamic behaviour of MCF7 and MCF10A cells in ultrasonic field using modal and harmonic analyses. PLoS One 10, e0134999 (2015).
52. Ozzello, L. Ultrastructure of human mammary carcinoma cells in vivo and in vitro. J. Natl. Cancer Inst. 48, 1043–1050 (1972). 53. De la Fuente, I. M. et al. On the dynamics of the adenylate energy system: homeorhesis vs homeostasis. PLoS One 9, e108676 (2014). 54. Apps, D. K. & Nairn, A. C. The equilibrium constant and the reversibility of the reaction catalysed by nicotinamide-adenine
dinucleotide kinase from pigeon liver. Biochem. J. 167, 87–93 (1977).
55. Mitchell, P. Aspects of the chemiosmotic hypothesis. Biochem. J. 116, 5P–6P (1970).
56. Chiang, E. Y. et al. Potassium channels Kv1.3 and KCa3.1 cooperatively and compensatorily regulate antigen-specific memory T cell functions. Nat. Comm. 8, 14644 (2017).
57. Beck, W. S. A kinetic analysis of the glycolytic rate and certain glycolytic enzymes in normal and leukemic leucocytes. J. Biol. Chem. 216, 333–350 (1955).
58. Sánchez-Danés, A. et al. Defining the clonal dynamics leading to mouse skin tumour initiation. Nature 536, 298–303 (2016). 59. Lucia, U. Bioengineering thermodynamics of biological cells. Theor. Biol. Med. Model. 12, 29 (2015).
Acknowledgements
This work was partially supported by National Group of Mathematical Physics (GNFM-INdAM). We are grateful to S. Gangi, A. Strazzanti and F. Borziani for helpful discussion and kind support in this research activity. We thank Domenico Romolo for his graphical support in making Fig. 1a. This work is dedicated to the memory of Ilya Prigogine in occasion of his 100th birth anniversary.
Author Contributions
R.Z. developed the theoretical model and performed numerical calculations. N.P. conceived the problem. R.Z., N.P. and M.C. wrote the paper with inputs from G.F. All authors contributed to the analysis of the results.
Additional Information
Supplementary information accompanies this paper at doi:10.1038/s41598-017-09530-5
Competing Interests: The authors declare that they have no competing interests.
Publisher's note: Springer Nature remains neutral with regard to jurisdictional claims in published maps and
institutional affiliations.
Open Access This article is licensed under a Creative Commons Attribution 4.0 International
License, which permits use, sharing, adaptation, distribution and reproduction in any medium or format, as long as you give appropriate credit to the original author(s) and the source, provide a link to the Cre-ative Commons license, and indicate if changes were made. The images or other third party material in this article are included in the article’s Creative Commons license, unless indicated otherwise in a credit line to the material. If material is not included in the article’s Creative Commons license and your intended use is not per-mitted by statutory regulation or exceeds the perper-mitted use, you will need to obtain permission directly from the copyright holder. To view a copy of this license, visit http://creativecommons.org/licenses/by/4.0/.
1
SUPPLEMENTARY INFORMATION
Rate of entropy model for irreversible processes
in living systems
R. Zivieri
1,2, N. Pacini
3, G. Finocchio
2, M. Carpentieri
41Department of Physics and Earth Sciences and Consorzio Nazionale Interuniversitario per le
Scienze Fisiche della Materia, Unit of Ferrara, University of Ferrara, via G. Saragat 1, Ferrara I-44122, Italy
2Department of Mathematical and Computer Sciences, Physical Sciences and Earth Sciences,
University of Messina, V.le F. D'Alcontres, 31, 98166, Messina, Italy
3Department of General Surgery, Section of Senology, University Hospital Company, Policlinico
Vittorio Emanuele, via S. Citelli 6, 95124, Catania, Italy
4Department of Electrical and Information Engineering, Politecnico di Bari, via E. Orabona 4, Bari
2
1. OVERVIEW
We restrict ourselves to the study of the thermodynamics in the single cell representing an open thermodynamic system. Since we are dealing with phenomena taking place locally and under conditions of local equilibrium inside and outside a typical cell, all intensive and extensive thermodynamic variables have a space and time dependence[S1]. On this basis, it is useful to define the rate of entropy density production,r ri re, where ri is the rate of internal entropy density
production (RIEDP) and re the rate of external entropy density production (REEDP). Starting from
the definition of the entropy density
cell
S s
V
with s si se where si is the internal entropy density,
e
s the external entropy density and Vcell the volume of the cell it is possible to compute r.
In the next two sections, we give the details about the calculation of ri andre, respectively valid
for any irreversible processes occurring in a cell, either normal or cancer. The calculation lies on thermodynamic arguments combined with heat and mass transport equations. The expressions are general and valid for any irreversible chemical process and we then apply them to glucose catabolism. To calculate the rate of entropy density production, for the sake of convenience and without loss
of generality, we represent the cell (either normal or cancer) as a cube of volume 3
cell
V L taking as
reference the breast epithelium tissue. Here, L is the average size with L = 10 m for a typical normal cell and L = 20 m for a cancer cell[S2] and we assume that the flows occur mainly along the x direction within a 1D model (see Fig. 1 in the main text). In the numerical calculations shown in the following we assume that all irreversible processes take place at x = L/2 and for values of y and z corresponding to the region of the cytoplasm where glucose catabolism occurs (see the main text for more details).
To describe the glucose catabolism we recall the two reactions described in detail in the main text, namely the respiration process and the lactic acid fermentation process involving glucose (C6H12O6)
catabolism. The respiration process is summarized as C6H12O6 + 6O2 6 CO2 + 6 H2O leading to
the formation of carbon dioxide (CO2) and water (H2O). The lactic acid fermentation process leads
3 simple form C6H12O6 → 2 C3H5 O3- + 2 H+ [S3, S4] (for a more detailed discussion on this point
see the main text).
2. RATE OF INTERNAL ENTROPY DENSITY PRODUCTION
We define the space and time dependent RIEDP ri
,t dsi
,t dt x
x (with x= ( , , )x y z and t the
time) giving the amount of local increase of entropy in continuous thermodynamic systems. In our special case, we consider a cell (either normal or cancer) and the RIEDP associated to irreversible processes occurring inside it.
In order to do that, we recall its general expression in terms of heat flow and mass flow (see Methods):
1
1
, 1 1 v (S1) N M k i u D k j j k j t r ,t ,t ,t A ,t T ,t T ,t T ,t
x x = J x J x x x x x Here,
1 T ,t x is the thermodynamic force leading to the internal energy flow
1 N u Q k D k k u
J = J J with JQthe heat flow, uk the partial molar energy and JD kthe diffusion flow of
the kth chemical species with N the number of chemical species. In particular, k
m k T u u n is
expressed in J/mole with u the energy density expressed in J/m3, m k
m k
N n
V
the number of moles
per unit volume of the kth species with Nm k the number of moles. Instead,
, k t T ,t x x is the kththermodynamic force giving rise to the diffusion flowJD k
x,t . Finally, Aj
x,t is the affinity of the jth chemical reaction and vj is the velocity of reaction with M the number of chemical reactions.It is possible to identify three different contributions to the RIEDP: 1) the one associated to heat transport; 2) the one related to molecules diffusion and 3) the one due to irreversible chemical reactions. The second and third contributions are those due to mass transport. The heat transport is
4 caused by the temperature gradient inside the human cell. Within this model, we do not include the
term
1
1 N k D k k u ,t T ,t x
J x that expresses the thermodynamic force due to temperature
distribution gradient inside the cell and the corresponding mass flow. In this way, we do not take into account the contribution to the rate of internal entropy density caused by diffusion of chemical species whose flow results from the temperature distribution gradient.
A. RATE OF INTERNAL ENTROPY PRODUCTION ASSOCIATED TO HEAT TRANSPORT
First, we derive the RIEDP associated to heat transport related to the flow JQ
x,t within our model. In its general form:riQ
x,t =FQ
x,t JQ x,t (S2) Here,
1 , Q t T ,t F x x is the thermodynamic force. In our 1D model, without loss of
generality, flows are assumed along x; hence, x= ( , 0, 0)x , ˆi
x , T
x,t T x,t
and ( , 0, 0) Q JQJ . Heat flow occurs symmetrically with respect to x = L/2 along the two directions (x
and –x).
To calculate the heat flow, we make the assumption that heat diffusion is mainly due to a conduction transport neglecting, in a first approximation, the convection transport present to a much lesser extent inside a typical cell. The heat transport equation in the 1D case, neglecting the term of heat source, takes the well-known form:
2 2 , , (S3) T x t T x t t
x Here, the solution to Equation (S3) T (x,t) is the temperature distribution function depending both on spatial and time variable, and, for a given material, = K/(cs) is the thermal diffusivity in m2 /s
5 m3. Both K and are assumed uniform throughout the cell. We impose the following initial and boundary conditions on the temperature distribution:
0
, 0 for 0 initial condition
(S4)
0, , 0 for >0 boundary conditions
T x T x L T t T L t t
This choice is not restrictive because the temperature vanishes only exactly at the cell border due to the boundary conditions corresponding to the cell membrane and has a weak dependence on x inside the cell. However, note that the temperature on the cell membrane is not zero as inferred from the expression of the temperature distribution in the intercellular environment (see paragraph B for details) obtained in the absence of boundary conditions. The solution to equation (S3) taking into
account the initial and boundary conditions expressed by equation (S4) reads
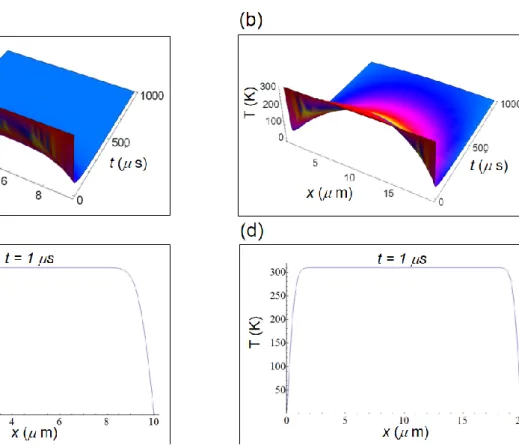
2 2 2 2 1 0 1 sin 2 1 4 , 2 1 (S5) n t L n n x T L T x t e n
A graphical solution to equations (S4) and (S5) of the temperature distribution (in Kelvin, K) inside the cell is shown in Fig. S1a and Fig.S1b as a function of x and of t with t ranging from 0 to 1000 s, a typical cell time interval. In the numerical calculations, we have taken the initial temperature T0 =
310 K and, taking into account that the cytoplasm is mainly composed by water, we have used the thermal diffusivity of water, viz. H20 = 0.143 10-6 m2/s. The temperature is almost uniform and,
on average, about T0 especially for the initial instant of times (see Fig.S1c and Fig.S1d). The
temperature vanishes only at the border corresponding to the cellular membrane for t > 0 because of the boundary condition of equation (S4).
6
Figure S1. Temperature distribution inside a human cell according to equations (S4) and (S5). (a) Temperature distribution inside a normal cell as a function of the spatial coordinate and time. (b) Temperature distribution inside a cancer cell as a function of the spatial coordinate and time. (c) Temperature as a function of the spatial coordinate in a normal cell. (d) Temperature as a function of the spatial coordinate in a cancer cell.
For the 1D case FQ
FQ, 0, 0
with
,
,
1 ˆt Q x t T x t e i x F expressed in 1/ (m K) where an
exponential time decay depending on a typical decay time has been included to describe the time evolution of the force. Hence, by inserting the solution to heat equation given in equation (S5), we get
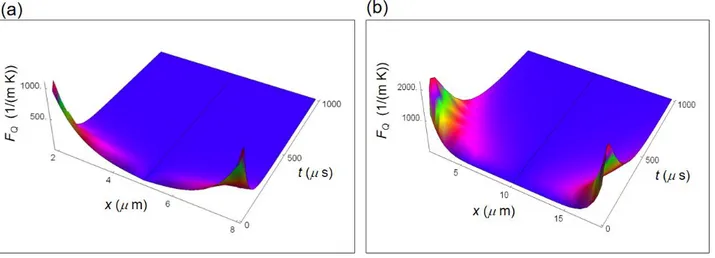
2 2 2 2 2 2 2 1 2 1 2 0 2 1 1 cos 2 1 1 1 ˆ , (S6) 4 1 sin 2 1 2 1 t n t L n Q n t L n n x e e L x t i T L n x e n L
F7 Fig. S2 displays the force expressed in equation (S6) for a normal and a cancer cell with = 10-4 s a typical cell decay time. In the interval 0 x L/2 we have taken the modulus of FQ to have the
force positive in the whole interval. The force becomes greater passing from the center to the border and reduces its magnitude with increasing time. This force is only due to the internal temperature distribution and it is the same for all chemical species.
Figure S2. Force associated to internal heat flow calculated by means of equation (S6) as a function of the spatial coordinate and of time. (a) Force inside a normal cell. (b) Force inside a cancer cell.
Within the 1D model, the heat flow per unit time and area expressed in J/ (m2 s) is JQ
JQ, 0, 0
with Q 1 Q
dX J
A dt
, dXQ the heat flow and A is the cell area. According to Fourier law, the heat flow per
unit time and per unit area along x isJQ x t, K T x t , x
. The minus sign on the second member only
indicates that heat flows from the region at higher temperature corresponding to the cell centre to the region at lower temperature close to the cell membrane, namely in the direction along which the temperature decreases (in this case it is symmetrical along +x and –x). Explicitly
2 2 2 2 1 0 1 1 ˆ , 4 cos 2 1 n Lt (S7) Q n x t p K T n x e i L L
JHere, p denotes the frequency of occurrence of the irreversible reaction. In Fig. S3, we display the bidirectional heat flow per unit time and area given in equation (S7) for both the normal and the cancer cell referred to glucose catabolism. For 0 x L/2 we have plotted the modulus of the heat flow to have JQ positive in the whole interval. In the numerical calculations we have taken K = 0.600
8 J/ (msK) and, for the case of glucose catabolism, p = 0.90 for cancer cells and p = 0.85 for normal cells[S5] (see the main text for more details). The trend of JQ is symmetric with respect to the centre
for the two types of cells, is less sharp for a cancer cell especially for t ranging between 0 and 100 s and tends to zero with increasing time.
Figure S3. Internal heat flow per unit time and area calculated according to equation (S7) plotted as
a function of the spatial coordinate and of time. (a) Heat flow inside a normal cell. (b) Heat flow inside a cancer cell.
The RIEDP due to the heat flow and expressed in J/ (m3 K s), via equation (S6) and equation (S7), is
2 2 2 2 2 2 2 2 1 2 1 2 2 2 1 1 cos 2 1 , 1 sin 2 1 2 1 (S8) t n t L n i Q n t L n n x e e L r x t p K L n x e n L
From equation (S8), it turns out that riQ