UNIVERSITA’ DELLA CALABRIA
Dipartimento di Farmacia e Scienze della Nutrizione e della Salute
Dottorato di Ricerca in
Biochimica Cellulare ed Attivita’ dei Farmaci in Oncologia
Con il contributo di FSE-Regione Calabria CICLO XXVI
Leptin as a Novel Mediator of Tumor/Stroma Interaction
Promotes the Invasive Growth of Breast Cancer
Settore Scientifico Disciplinare MED/05
Coordinatore: Ch.mo Prof. Diego Sisci
Tutor: Ch.mo Prof.ssa Catalano Stefania
2
"La presente tesi è cofinanziata con il sostegno della Commissione Europea, Fondo Sociale Europeo e della Regione Calabria. L’autore è il solo responsabile di questa tesi e la Commissione Europea e la Regione Calabria declinano ogni responsabilità sull’uso che potrà essere fatto delle informazioni in essa contenute".
Table of Contents
Introduction
Pag. 6
Materials and Methods
Reagent and Antibodies Plasmids
Cell Culture CAFs Isolation
Conditioned Medium System ERE-Luciferase Reporter Assay Expression Microarray Analysis Immunoblot Analysis
Immunofluorescence
Reverse Transcription and Real-Time Transcriptase PCR assays
Cell proliferation Assays (MTT Assasy, Tripan Blue Assays, Soft Agar Assasy) Wound-Healing Scratch Assays
Transmigration Assays Invasion Assays
Leptin measurement by radioimmunoassay Leptin-immunodepleted conditioned media Aromatase Activity Assays
Synthesis and Characterization of Peptide LDFI Tumor Xenografts Statistical Analysis
Pag. 8
Pag. 13 Pag. 13 Pag. 13 Pag. 14 Pag. 14 Pag. 14 Pag.15 Pag. 15 Pag. 16 Pag. 18 Pag. 18 Pag. 19 Pag. 19 Pag. 19 Pag. 19 Pag. 19 Pag. 20 Pag. 20 Pag. 20 Pag. 21
4
Evaluation of the Mechanisms Underlying Tumor-Stroma
Interaction in ERα-positive breast cancer (Aim 1).
Tumor/Stroma Interactions Stimulate Cell Proliferation and Motility Gene Transcription Patterns of WT and K303R ERα-overexpressing Cells K303R ERα-overexpressing Cells Exhibit Increased Leptin Signaling Activation K303R ERα mutationand leptin hypersensitivity
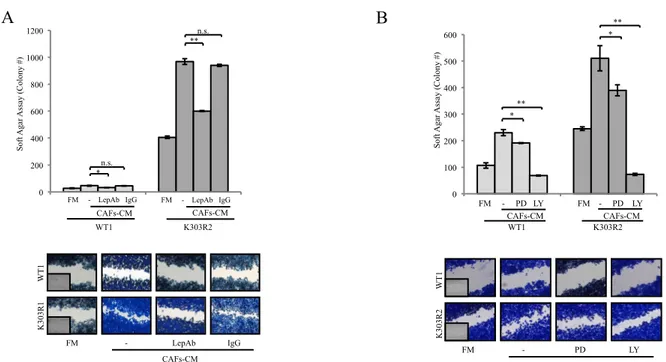
Leptin is responsible for CAFs-induced Cell Growth and Motility Tumor/Stroma Interactions in SKBR3 Breast Cancer Cells
Effects of Breast Cancer Cell-secreted Factors on CAFs Phenotype
Pag. 23 Pag. 24 Pag. 27 Pag. 29 Pag. 31 Pag. 32 Pag. 33
Evaluation of the Potential Role of Leptin in Driving Aromatase
Inhibitor Resistance in Breast Cancer (Aim 2).
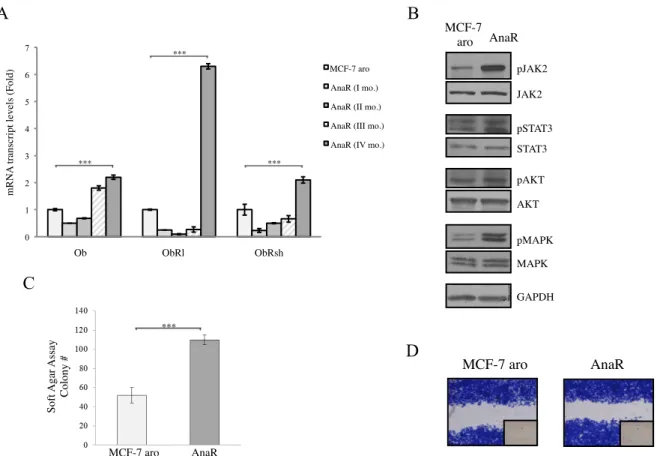
Generation of Anastrozole-Resistant Breast Cancer Cells AnaR Cells Exhibits Increased Activation of Leptin Signalings CAFs enhance Growth and Motility of AnaR Cells
Enhanced Recruitment and Protumor Activation of Macrophages from AnaR Cell through Leptin Signalings
Macrophages Promotes Growth and Migration of AnaR Cells.
Pag. 37 Pag. 39 Pag. 40 Pag. 41 Pag. 43
Evaluation of the Efficacy of a Novel Peptide to Block Leptin
Action in Breast Cancer (Aim 3).
Design, Synthesis and Characterization of Peptide LDFI Peptide LDFI Reduces Leptin-induced Cell Growth and Motility Peptide LDFI Antagonizes Leptin Signaling Pathways
Peptide LDFI Abolishes Leptin-induced Up-regulation of the Ob Gene Efficacy of PEG-LDFI Treatment in Breast Cancer Xenografts
Pag. 45 Pag. 48 Pag. 49 Pag. 49 Pag. 50
Discussion
Pag. 53
Introduction
6
Introduction
For the past 3 decades, cancer research focused predominantly on the characteristics of breast cancer cells. Recently, clinical and experimental studies revealed that both tumor initiation and progression are related to the complex interactions that transpire within the tumor microenvironment. The stromal compartment is composed of mesenchymal cells (fibroblasts, adipocytes, blood cells) and extracellular matrix (ECM; lamin, fibronectin, collagen, proteoglycans, and so on), and signals from these cells come as soluble secreted factors, ECM components, or direct cell–cell contacts (Fig. 1).
Figure 1. A schematic representation of tumor microenvironment.
Growth factors, cytokines, adipokines, proteases, and vascular-stimulating factors are involved in stroma-mediated procancerous activities (1–4). The chemokines CXCL12, CXCL14, and CCL7 stimulated tumor cell proliferation and invasion in vitro and in vivo and increased tumor angiogenesis and macrophage presence at tumor sites (5–7). The interleukins (IL)-1 and -8 induced cancer progression by enhancing metastasis and cachexia (8, 9).
As important adipocyte-derived endocrine and paracrine mediator, the adipokine leptin has been correlated with breast cancer occurrence. Indeed, leptin synthesis and plasma levels increase with obesity, a pandemic condition that influences both risk and prognosis of breast cancers (10).
The processes of heterotypic signaling involve a constant bidirectional cross-talk between stromal cells and malignant cells. Stromal cells influence tumor invasiveness and malignancy, whereas at the onset and during breast cancer progression the microenvironment is reorganized by cancer cells (11). Tumors recruit stromal fibroblasts in a process referred to as the desmoplasmic reaction, and these carcinoma-associated fibroblasts (CAFs) are reprogrammed to produce growth factors, cytokines, and ECM-remodeling proteins, that acting in autocrine and paracrine fashion support tumor proliferation and invasion into surrounding tissues (4). Moreover, in the microenvironment of most neoplastic tissue, as those of the breast, an inflammatory component is present an included infiltration of white blood cells, essentially tumor associated macrophages (TAMs). The majority of TAMs exhibits alternatively activated M2 properties, produce abundant anti-inflammatory factors and facilitate tumor development. Accumulating evidences from both patient biopsies and experimental animal models have shown that TAMs function in tumor angiogenesis and vessel abnormalization in a density- and phenotype-dependent manner (12). Multiple clinical studies compellingly indicate the association between high TAMs influx and poor prognosis in patients with breast cancers (13). Also, the pro-inflammatory microenvironment is associated with the obese state (14-16), specifically highlighting the involvement of obesity-associated hormones/growth factors in the cross-talk between macrophages, adipocytes, and epithelial cells in many cancers. Moreover, a variety of these factors may activate estrogen receptor alpha (ERα) (17).
Estrogens and its receptor play a crucial role in regulating breast cancer growth and differentiation. Variant forms of ERα due to alternative splicing or gene mutation have been reported, but their clinical significance is still unresolved (18, 19). A naturally occurring mutation at nucleotide 908, introducing a lysine to arginine transition at residue 303 within the hinge domain of the receptor (K303R ERα) (Fig. 2), was identified in one third of premalignant breast hyperplasias and one half of invasive breast tumors.
Introduction
8
Figure 2. Tridimensional structure of Estrogen Receptor alpha (ERα) and schematic representation of the different domains within ERα, AF-1 and (activation function-1), DBD (DNA binding domain), Hinge region, HBD (hormone binding domain)/AF-2.
This mutation is correlated with poor outcomes, older age, larger tumor size, and lymph node– positive disease (20, 21) (Table 1).
Table 1. Clinical characteristics of breast cancer cases expressing wild-type (WT) or K303R ERα mutation.
Other studies did not detect the mutation in invasive cancers (22–25), but our data suggest that the detection method used might be insensitive. However, K303R expression was found at low frequency in invasive breast tumors by Conway and colleagues (26).
0% 34% 50% !
!!!!!!!!!!AF-1!!!!!!!!!!!!DBD Hinge HBD/AF-2
NH2
*
COOH "K303R
(n=133)"
WT"
(n=134)"P value"
" Age (y), (%)! " " " ≤50 " 20.3" 33.6" 0.015! >50 " 79.7" 66.4" Tumor Size (cm) (%) ! 0-2" 24.2" 42.9" 0.002! >2-5 " 61.4" 51.1" >5 " 14.4" 6.0" Nodes, (%) ! Node Negative "42.1" 78.4" <0.0001! Node Positive " 1-3 " 31.6" 13.4" >3" 26.3" 8.2"
K303R mutation allows ERα to be more highly phosphorylated by different kinases, and it alters the dynamic recruitment of coactivators and corepressors (27–29). Mutant overexpression in MCF-7 breast cancer cells increased sensitivity to subphysiologic levels of estrogen and decreased tamoxifen responsiveness when elevated growth factor signaling was present (20, 30). K303R ERα mutation also conferred resistance to the aromatase inhibitor anastrozole (28, 31), suggesting a pivotal role for this mutation in more aggressive breast cancers.
Resistance to hormone therapy remains a major clinical challenge in the treatment of the ER-positive breast cancers. Despite the efficacy of inhibiting ERα action by using the antiestrogen tamoxifen or reducing estrogen production with the aromatase inhibitors (AIs), letrozole, anastrozole or examestane (Fig. 3), a large number of patients fail to respond to initial therapy (de novo resistance) or develop resistance after prolonged treatment (acquired resistance) that limit the usefulness of these drugs.
Figure 3. Schematic action of Tamoxifen and Aromatase Inhibitors.
The mechanisms responsible for the development of resistance remain poorly defined. Several mechanisms have been proposed (Fig. 4), including the loss of ERα expression or function (32), alterations in the balance of regulatory cofactors, increased oncogenic kinase signaling (33), and deregulated cell proliferation (34). Resistance may also result from altered expression of growth
Introduction
10
factor signaling pathways, such as insulin-like growth factor receptor-1 (IGF-1R) and human epidermal growth factor receptor ERBB2, or increased activity of the G coupled-protein receptor GPER, that serve to stimulate estrogen-independent growth (35-38). Recently, a role for the tumor microenvironment in the development of endocrine resistance in breast cancer has also been suggested (39).
Figure 4. Molecular mechanisms involved in the development of endocrine resistance in breast cancer.
On the basis of all these observations, the aims of our study were the following:
1) to elucidate the mechanisms underlying tumor–stroma interactions in ERα-positive
breast cancer cells. First, we investigated how CAFs could impact breast cancer cell
proliferation, migration and invasiveness in relation to the expression of wild-type or the K303R ERα. We then defined the effect that a single factor-leptin has on stroma-mediated breast cancer progression. Finally, we examined the bidirectional interactions between CAFs and breast cancer cells, leading to increased malignancy.
2) to investigate the potential role of leptin in driving AI resistance in breast cancer, in
the contest of tumor microenvironment. Specifically, we evaluated wheter the
activation of leptin signaling pathway may provide AI resistant tumors with alternative proliferative and survival advantage and how CAFs may influence AI resistant behavior through leptin. Then, we explored if AI resistant breast cancer cells through the proinflammatory cytokine leptin may control the phenotype of macrophages, to futher support breast cancer progression.
3) to test the ability of a newly synthetized peptide to block leptin action in breast
12
Materials and Methods
Reagents and antibodies.The following reagents and antibodies were used: leptin, 17β-estradiol, and epidermal growth factor (EGF), anastrozole, androstenedione from Sigma; ICI182780 from Tocris Bioscience; Gentamicin from Invitrogen. AG490, AG1478, PD98059, and LY294002 from Calbiochem; ERα, ERβ, glyceraldehyde-3- phosphate dehydrogenase (GAPDH), ObRl, ObRs, Ob, Akt, and pAktSer437, Cyclin D1 antibodies from Santa Cruz Biotechnology; and mitogen-activated protein kinase (MAPK), Janus-activated kinase (JAK)2, STAT3, pMAPKThr202/Tyr204, pJAK2Tyr1007/1008, pSTAT3Tyr705/pERαSer118, and pERαSer167 from Cell Signaling Technology, Aromatase from Serotec.
Plasmids.
YFP-WT and YFP-K303R-ERα, was provided by Dr. Fuqua, Baylor College of Medicine, Houston, Texas. XETL plasmid, containing an estrogen-responsive element, was provided by Dr. Picard, University of Geneva, Geneva, Switzerland.
Cell culture.
Breast cancer epithelial ER-positive MCF-7 cell line was cultured in DMEM medium containing 10% FBS, 1% L-glutamine, 1% Eagle’s nonessential amino acids, and 1 mg/ml penicillin-streptomycin at 37 °C with 5% CO2 air.
Breast cancer epithelial ER-negative SKBR3 cell line was cultured in phenol red-free RPMI medium containing 10% FBS, 1% L-glutamine, 1% Eagle’s nonessential amino acids, and 1 mg/ml penicillin-streptomycin.
The murine macrophage RAW 264.7 cell line was cultured in DMEM medium containing 10% FBS, 1% L-glutamine, 1% Eagle’s nonessential amino acids, and 1 mg/ml penicillin-streptomycin.
YFP-WT and YFP-K303R ERα stably expressing MCF-7 cells, MCF-7 and SKBR3 pools stably transfected with YFP-WT and YFP-K303R ERα were generated as described (28, 31). Immortalized normal human foreskin fibroblasts BJ1-hTERT were provided by Dr Lisanti, Jefferson University, Philadelphia, PA. MCF-7 aro cells stably expressing the aromatase enzyme were generated as previously described (31).
Materials and Methods
14
Anastrazole-resistant MCF-7 cells (AnaR) cells were generated by culturing MCF-7 aro cells in MEM with 10% FBS, 1% L-glutamine, 1% Eagle’s nonessential amino acids, 1mg/ml penicillin/streptomycin, zeocin 0.2mg/ml and anastrozole 1µM. Cells were routinely maintained in 1µM anastrozole for longer than one year. Every 4 months, cells were authenticated by single tandem repeat analysis at our Sequencing Core; morphology, doubling times, estrogen sensitivity, and mycoplasma negativity were tested (MycoAlert, Lonza).
CAF isolation.
Human breast cancer specimens were collected in 2011 from primary tumors of patients who signed informed consent. Following tumor excision, small pieces were digested (500 IU collagenase in Hank's balanced salt solution; Sigma; 37°C for 2 hours). After differential centrifugation (90 g for 2 minutes), the supernatant containing CAFs was centrifuged (500 g for 8 minutes), resuspended, and cultured in RPMI-1640 medium supplemented with 15% FBS and antibiotics. CAFs between 4 and 10 passages were used, tested by mycoplasma presence, and authenticated by morphology and fibroblast activation protein (FAP) expression.
Conditioned medium systems.
CAFs and RAW 264.7 cells were incubated with regular full media (48–72 hours). Conditioned media were collected, centrifuged to remove cellular debris, and used in respective experiments. Alternatively, conditioned media were collected from WT- and K303R ERα–expressing MCF-7 cells or MCF-7 aro and AnaR cells incubated in media supplemented with 5% charcoal- stripped FBS (72 hours).
ERE-Luciferase reporter assay
Cells were transiently transfected using the FuGENE 6 reagent as recommended by the manufactures with XETL reporter plasmid (0.5 µg/well) and TK Renilla luciferase plasmid (25 ng/well). After transfection cells were treated as indicated. The firefly and Renilla luciferase activities were measured using a dual luciferase kit (Promega). The firefly luciferase data for each sample were normalized on the basis of transfection efficiency measured by Renilla luciferase activity.
Expression microarray analysis.
Expression profiles were determined with Affymetrix GeneChip Human Genome U133 plus 2.0 arrays. Data quality and statistical analyses were conducted as described in the work of Barone and colleagues (28). Microarray study followed MIAME (Minimum Information About a Microarray Experiment) guidelines.
Immunoblot analysis.
Cells were grown to 50–60% confluence and treated as indicated before lysis in 500µl of 50 mM Tris-HCl, 150 mM NaCl, 1% NP-40, 0.5% sodium deoxycholate, 2 mM sodium fluoride, 2 mM EDTA, 0.1% SDS, containing a mixture of protease inhibitors (aprotinin, phenylmethylsulfonyl fluoride, and sodium orthovanadate) for protein extraction. Protein extracts from frozen tumors were prepared by homogenizing the tissue in lysis buffer supplemented with 10% glycerol, and protease inhibitors (0.1 mM Na3VO4, 1% PMSF, 20 µg/ml aprotinin). Tumor lysates were collected, sonicated (5× for 5s on ice), and microcentrifuged at 14000×g for 20 min at 2°C. Supernatants of the lysates were aliquoted and stored at −80°C.
Equal amounts of cell extracts were resolved under denaturing conditions by electrophoresis in 8% to 10% polyacrylamide gels containing SDS (SDS-PAGE), and transferred to nitrocellulose membranes by electroblotting. After blocking the transferred nitrocellulose membranes were incubated with primary antibodies overnight at 4°C. The antigen-antibody complex was detected by incubation of the membranes with peroxidase-coupled goat anti-mouse, goat anti-rabbit and revealed using the ECL System. To ensure equal loading all membranes were stripped and incubated with anti GAPDH or β-actin antibodies for total extracts. The bands of interest were quantified by Scion Image laser densitometry scanning program.
Immunofluorescence.
Cells were fixed with 4% paraformaldehyde, permeabilized with PBS ± 0.2% Triton X-100 followed by blocking with 5% bovine serum albumin (1 hour at room temperature), and incubated with anti-ObR antibody (4°C, overnight) and with fluorescein isothiocyanate– conjugated secondary antibody (30 minutes at room temperature). IgG primary antibody was used as negative control. 4,6-Diamidino-2-phenylindole (DAPI; Sigma) staining was used for
Materials and Methods
16
nuclei detection. Fluorescence was photographed with OLYMPUS BX51 microscope, 100 objective.
Reverse transcription and real-time reverse transcriptase PCR assays.
Total RNA was extracted from cells using TRIzol reagent and the evaluation of Ob, FAP, cyclin D1, ps2, cathepsin and 36B4 gene expression was performed by the reverse transcription-PCR method using a RETROscript kit.
Analysis gene expression of the other genes used in this study was performed by Real-time reverse transcription–PCR. Total RNA (2µg) was reverse transcribed with the RETROscript kit; cDNA was diluted 1:3 in nuclease-free water and 5µl were analysed in triplicates by real-time PCR in an iCycler iQ Detection System (Bio-Rad, USA) using SYBR Green Universal PCR Master Mix with 0.1 mmol/l of each primer in a total volume of 30 µl reaction mixture following the manufacturer’s recommendations. Negative control contained water instead of first strand cDNA was used. Each sample was normalized on its GAPDH mRNA content.
The relative gene expression levels were normalized to a calibrator that was chosen to be the basal, untreated sample. Final results were expressed as n-fold differences in gene expression relative to GAPDH mRNA and calibrator, calculated using the ∆Ct method as follows:
n-fold=2- (∆Ctsample–∆Ctcalibrator) where ∆Ct values of the sample and calibrator were determined by subtracting the average Ct value of the GAPDH mRNA reference gene from the average Ct value of the gene analysed.
Gene Name Gene
Symbol Primer Sequences
Fibroblast activation protein FAP Forward 5’-AGAAAGCAGAACTGGATGG-3’ Reverse 5’-ACACACTTCTTGCTTGGAGGAT-3’
36B4 36B4 Forward 5’-CTCAACATCTCCCCCTTCTC-3’
Reverse 5’- CAAATCCCATATCCTCGT -3’ Leptin Receptor Long
Isoform ObRl Forward
5’-GATAGAGGCCCAGGCATTTTTTA-3’ Reverse 5’- ACACCACTCTCTCTCTTTTTGATTGA-3’ Leptin Receptor Short
Isoform ObRs Forward Reverse 5’- ATTGTGCCAGTAATTATTTCCTCTTCC-3’ 5’- CCACCATATGTTAACTCTCAGAAGTTCAA-3’ Chemokine (C-X-C motif)
receptor 4 CXCR4 Forward
5’-AATCTTCCTGCCCACCATCT-3’ Reverse 5’-GACGCCAACATAGACCACCT-3’
Insulin Receptor IR Forward 5’-AGGAGCCCAATGGTCTGA-3’
Reverse 5’-AGACGCAGAGATGCAGC-3’ Interleukin 2 Receptor IL2R Forward 5’-GGCCATGGCTGAAGAAGGT-3’
Reverse 5’-CTGGACGTCTCCTCCATGCT-3’ Interleukin 6 Receptor IL6R Forward 5’-TGAGCTCAGATATCGGGCTGAAC-3’
Reverse 5’-CGTCGTGGATGACACAGTGATG-3’ Epidermal growth factor
receptor EGFR Forward
5’-GGACTCTGGATCCCAGAAGGTG-3’ Reverse 5’-GCTGGCCATCACGTAGGCTT-3’ Insulin growth factor-1
receptor IGF1R Forward
5’-CACGACGGCGAGTGCAT-3’ Reverse 5’-ACAGACCTTCGGGCAAGGA-3’ Fibroblast growth factor
receptor 3 FGFR3 Forward
5’-TGCTGAATGCCTCCCACG-3’ Reverse 5’-CGTCTTCGTCATCTCCCGAG-3’ Estrogen receptor ERα Forward 5’-TGATTGGTCTCGTCTGGCG-3’
Reverse 5’-CATGCCCTCTACACATTTTCCC-3’
Cyclin D1 CD1 Forward 5’-TCTAAGATGAAGGAGACCTATC-3’
Reverse 5’-GCGGTAGTAGGACAGGAAGTT-3’
18s rRNA 18s Forward 5’-CCCACTCCTCCACCTTTGAC-3’
Reverse 5’-TGTTGCTGTAGCCAAATTCGTT-3’
Cathepsin D CD Forward 5’-AACAACAGGGTGGGCTTC-3’
Reverse 5’-TTTGAGTAGTCAAAGTCAGAGC-3’ Trefoil factor 1/pS2 pS2 Forward 5’-TTCTATCCTAATACCATCGACG-3’
Materials and Methods
18
Table 1. Oligonucleotide primers used in this study.
Cell proliferation assays.
MTT assays.
Cell viability was determined by using 3-(4,5-Dimethylthiazol-2-yl)-2,5-Diphenyltetrazolium Bromide (MTT) reagent following the recommendation of the manufacturer.
Trypan blue cell count assays.
Cell numbers were evaluated by trypsin suspension of samples followed by microscopic evaluation using a hemocytometer.
Soft agar growth assays.
Cells (25000/well) were plated in 4 ml of 0.35% agarose with 5% charcoal-stripped FBS in phenol red-free media, in a 0.7% agarose base in six-well plates. Two days after plating, media containing control vehicle or treatments was added to the top layer, and the media was replaced every two days. After 14 days, 150 µl of MTT was added to each well and allowed to incubate at
Gene Name Gene Symbol Primer Sequences Leptin Ob Forward Reverse 5’-GAGACCTCCTCCATGTGCTG-3’ 5’-TGAGCTCAGATATCGGGCTGAAC-3’
Epidermal Growth Factor EGF Forward
Reverse
5’-CCCTAAGTCGAGACCGGAAGT-3’ 5’-CAAGAGTACAGCCATGATTCCAAA-3’
Interleukin-6 IL-6 Forward
Reverse
5’-CCAGGAGCCAGCTATGAAC-3’ 5’-CCAGGGAGAAGGCAACTG-3’
Insulin INS Forward
Reverse
5’-TCAGAAGAGGCCATCAAGCA-3’ 5’-AGATGCTTCACGAGCCCAGC-3’
Transforming Growth Factor Beta TGFβ Forward
Reverse
5’-ATCCTGTCCAAACTAAGGCTCG-3’ 5’-ACCTCTTTAGCATAGTAGTCCGC-3’
Small mothers against decapentaplegic Smad3 Forward
Reverse
5’-GGATCCATGTCGTCCATCCTGCCC-3’
5’-GAATTCCTAAGACACACTGGAACAGCGGATG-3’
Interleukin-10 IL-10 Forward
Reverse
5’-CTGGACAACATACTGCTAACCG-3’ 5’-GGGCATCACTTCTACCAGGTAA-3’
Interleukin-12 IL-12 Forward
Reverse
5’-TGGTTTGCCATCGTTTTGCTG-3’ 5’-ACAGGTGAGGTTCACTGTTTCT-3’
Arginase Argi Forward
Reverse
5’-CTCCAAGCCAAAGTCCTTAGAG-3’ 5’-AGGAGCTGTCATTAGGGACATC-3’
Inducible nitric oxide synthase iNOS Forward
Reverse
5’-GTTCTCAGCCCAACAATACAAGA-3’ 5’-GTGGACGGGTCGATGTCAC-3’
37°C for 4h. Plates were then placed in 4°C overnight and colonies > 50 µm diameter from triplicate assays were counted.
Wound-healing scratch assays.
Cell monolayers were scraped and treated as indicated. Wound closure was monitored over 24 hours; cells were fixed and stained with Coomassie brilliant blue. Images represent 1 of 3 independent experiments (10 contrast microscopy).
Transmigration assays.
Cells untreated or treated as indicated were placed in the upper compartments of Boyden chamber (8-µm membranes; Corning Costar). Bottom well contained the specific chemoattractant as indicated. After 24 hours, migrated cells were fixed and stained with Coomassie brilliant blue. Migration was quantified by viewing 5 separate fields per membrane at 20 magnifications and expressed as the mean number of migrated cells.
Invasion assays.
Matrigel-based invasion assay was conducted in invasion chambers (8-µm membranes) coated with Matrigel (BD Biosciences; 0.4 µg/mL). Cells treated with or without leptin were seeded into top Transwell chambers, whereas regular full medium was used as chemoattractant in lower chambers. After 24 hours, invaded cells were evaluated as described for transmigration assays.
Leptin measurement by radioimmunoassay.
Leptin was measured by a competitive in-house immunoassay (Chematil) following manufacturer's protocol. Results are presented as nanograms per cell.
Leptin-immunodepleted conditioned media.
Protein G-agarose beads were incubated with anti-leptin or IgG antibodies. Antibody–beads complexes were incubated with CAF conditioned media and centrifuged. Leptin immunodepletion was verified by radioimmunoassay (RIA).
Materials and Methods
20
Aromatase activity assays.
The aromatase activity was measured by the tritiated water release assay using 0.5 µM
[1β-3H]androst-4-ene-3,17-dione as substrate (40). The incubations were performed at 37 °C for 5 h
under an air/CO2 (5%) atmosphere. The results obtained were expressed as picomole/h and
normalized to mg of protein (pmol/h/mg of protein).
Synthesis and characterization of peptide LDFI.
Peptide LDFI (4 amino acids residues, leucine, aspartate, phenylalanine, isoleucine) and a scrambled version of this peptide (leucine, leucine, leucine, alanine) were synthetized by CEM-Liberty microwave-assisted automated-synthesizer and characterized by 1H-NMR spectroscopy.
Tumor xenografts.
In vivo studies were conducted in 45-day-old female nude mice (nu/nu Swiss). At day 0, the
animals were fully anesthetized by i.m. injection of 1.0 mg/kg Zoletil (Virbac) and 0.12% Xylor (Xylazine) to allow the s.c. implantation of estradiol (E2) pellets (1.7 mg per pellet, 60-day release; Innovative Research of America, Sarasota, FL) into the intrascapular region of mice. The day after, exponentially growing MCF-7 WT and K303R ERα cells (5.0 x 10⁶ per mouse) were inoculated s.c. in 0.1 mL of Matrigel. Leptin treatment was started 24 h later, when animals were injected i.p. with either solutions: recombinant human leptin (230 µg/kg) diluted in saline + 0.3% bovine serum albumin (BSA) or saline + 0.3% BSA only (control). The treatment was done for 5 days a week until the 8th week. All the procedures involving animals and their care have been conducted in conformity with the institutional guidelines at the Laboratory of Molecular Oncogenesis, Regina Elena Cancer Institute in Rome.
For peptide LDFI experiments, mice were inoculated with exponentially growing SKBR3 cells (5.0 x 10⁶ per mouse) and injected i.p. with either solutions: LDFI peptide (10mg/kg/day) diluted in saline 0.3% bovine serum albumin (BSA) or saline. The treatment was done for 5 days a week until the 4th week. All animals were maintained and handled in accordance with the recommendation of the Guidelines for the Care and Use of Laboratory Animals and were approved by the Animal Care Committee of University of Calabria.
Tumor development was followed twice a week by caliper measurements along two orthogonal axes: length (L) and width (W). The volume (V) of tumors was estimated by the following
formula: V = L (W2) / 2. At the time of killing, tumors were dissected out from the neighboring connective tissue, frozen and stored in nitrogen for further analysis.
Statistical analysis
Each datum point represents the mean ± SD of three different experiments. Data were analyzed for statistical significance with 2-tailed Student t test using GraphPad Prism 4. Survival curves were computed by Kaplan–Meier method and compared using 2-sided log-rank tests.
22
AIM 1
Evaluation of the mechanisms
underlying tumor-stroma interactions
in ERα-positive breast cancer
Tumor/Stroma Interactions Stimulate Cell Proliferation and Motility.
Epithelial-stromal interactions support tumor cell proliferation and invasion. Thus, we first investigated the role of tumor microenvironment in influencing breast cancer phenotype in relation to the expression of wild-type (WT) or K303R ERα mutant receptor.
We used as experimental models for breast cancer ERα-positive MCF-7 cells stably transfected with YFP-WT or YFP-K303R ERα expression vectors. We chose this approach because WT receptor was present along with K303R ERα in invasive breast tumors (21). Stable clones were screened for ERα expression using immunoblot analysis (Fig. 1A). Two clones stably expressing YFP-WT (WT1-2) or YFP-K303R ERα (K303R1-2) are shown along with WT or mutant receptor stable pools (WT P and K303R P). As stromal cells, we employed cancer-associated fibroblasts (CAFs), isolated from biopsies of primary breast tumors. CAFs possessed the basic fibroblast characteristics of long and spindle-shaped morphology, and highly expressed the fibroblast activation protein-FAP (Fig. 1B). To create in vitro conditions that can mimic the complex in vivo microenvironment, we used co-culture experiments. Breast cancer cells were incubated with regular-full media (FM), CAFs-derived conditioned media (CM) or normal fibroblasts (NFs)-CM and growth was evaluated by soft agar assays (Fig. 1C, upper panel). As previously shown by Barone et al (28, 31) control basal growth of mutant-expressing cells was elevated compared to WT-expressing cells. CAFs-CM significantly increased colony numbers in both WT and K303R ERα-expressing cells; however, CAFs-CM enhanced K303R-expressing cell growth at a higher extent compared to WT-expressing cells. We then examined the ability of CAFs-CM to promote WT- and K303R-expressing cell movement in wound-healing scratch assays (Fig. 1C, lower panel). The mutant cells moved the farthest in either direction to close the gap compared to WT-expressing cells. CAFs-CM promoted net movement of WT-expressing cells compared to FM; but K303R-expressing cells exposed to CAFs-CM moved at higher rate to close the gap in the cell bed. As expected, CAFs possessed a higher ability to enhance both proliferation and motility of breast cancer cells than normal fibroblast (NFs) (Fig. 1C). CAFs-CM-induced cell growth and migratory potential was blocked by inhibition of the classic cytokine JAK2/STAT3 signaling cascade (AG490) and the ERα signaling inhibitor (ICI182,780), although to a higher extent in K303R clones (Fig. 1D). All functional effects described so far are the results of exposure to the total complement of CAFs-secreted proteins. However, it is desirable albeit experimentally difficult to define the contribution of a single
Aim 1
24
factor. Thus, we addressed which CAFs-secreted factor may promote breast cancer cell growth and motility.
Figure 1.CAF-induced breast cancer cell growth and motility. A, immunoblotting for ERα expression in
YFP-WT and YFP- K303R ERα stably expressing MCF- 7 cells. GAPDH (glyceraldehyde-3- phosphate dehydrogenase) was used as loading control. B, CAF morphology in monolayer growth using phase contrast microscopy. RT-PCR for FAP and 36B4 (internal standard). NC, negative control. C, soft agar (upper panel) and scratch assays (lower panel) in cells treated with regular full media (FM), CAF-derived conditioned media (CAF-CM), or normal fibroblasts- derived conditioned media (NF-CM). D, soft agar (upper panel) and scratch assays (lower panel) in cells treated with FM, CAF-CM with or without AG490 (AG, 10 mmol/L) or ICI182760 (ICI, 1 mmol/L). *P < 0.05; **P < 0.005. Small squares, time 0.
Gene Transcription Patterns of WT and K303R ERα-overexpressing Cells.
Diffusible growth factors, interleukins, chemokines and adipokines implicated as mediators of stromal-epithelial interactions are involved in breast carcinoma initiation and progression. To determine changes in gene expression for the different receptors of CAFs-secreted factors, that may be responsible of the different sensitivity of WT and mutant clones to CAFs-CM exposure, we performed microarray analysis. Gene expression profile comparing RNA isolated from K303R-expressing with WT-expressing cells is shown in Table 1 and Table 2. K303R ERα
Figure 1 A B GAPDH YFP-ERα ERα WT K303R 1 2 1 2 GAPDH W T P K 303R P YFP-ERα ERα CA F s M CF -7 NC 36B4 FAP C D FM - AG ICI K 303R1 W T 1 CAFs-CM FM CAFs-CM NFs-CM K 303R2 W T 1 WT1 K303R2 CAFs-CM FM - AG ICI * * ** ** 0 100 200 300 400 500 600 700 800 S oft A ga r A ss ay (Col ony #) * ** FM - AG ICI CAFs-CM 0 100 200 300 400 500 600 WT2 K303R1 CM S oft A ga r A ss ay (Col ony #) FM CAFs NFs CM FM CAFs NFs ** ** * * Figure 1 A B GAPDH YFP-ERα ERα WT K303R 1 2 1 2 GAPDH W T P K 303R P YFP-ERα ERα CA F s M CF -7 NC 36B4 FAP C D FM - AG ICI K 303R1 W T 1 CAFs-CM FM CAFs-CM NFs-CM K 303R2 W T 1 WT1 K303R2 CAFs-CM FM - AG ICI * * ** ** 0 100 200 300 400 500 600 700 800 S oft A ga r A ss ay (Col ony #) * ** FM - AG ICI CAFs-CM 0 100 200 300 400 500 600 WT2 K303R1 CM S oft A ga r A ss ay (Col ony #) FM CAFs NFs CM FM CAFs NFs ** ** * * Figure 1 A B GAPDH YFP-ERα ERα WT K303R 1 2 1 2 GAPDH W T P K 303R P YFP-ERα ERα CA F s M CF -7 NC 36B4 FAP C D FM - AG ICI K 303R1 W T 1 CAFs-CM FM CAFs-CM NFs-CM K 303R2 W T 1 WT1 K303R2 CAFs-CM FM - AG ICI * * ** ** 0 100 200 300 400 500 600 700 800 S oft A ga r A ss ay (Col ony #) * ** FM - AG ICI CAFs-CM 0 100 200 300 400 500 600 WT2 K303R1 CM S oft A ga r A ss ay (Col ony #) FM CAFs NFs CM FM CAFs NFs ** ** * * Figure 1 A B GAPDH YFP-ERα ERα WT K303R 1 2 1 2 GAPDH W T P K 303R P YFP-ERα ERα CA F s M CF -7 NC 36B4 FAP C D FM - AG ICI K 303R1 W T 1 CAFs-CM FM CAFs-CM NFs-CM K 303R2 W T 1 WT1 K303R2 CAFs-CM FM - AG ICI * * ** ** 0 100 200 300 400 500 600 700 800 S oft A ga r A ss ay (Col ony #) * ** FM - AG ICI CAFs-CM 0 100 200 300 400 500 600 WT2 K303R1 CM S oft A ga r A ss ay (Col ony #) FM CAFs NFs CM FM CAFs NFs ** ** * * A B D C
expression induced several genes potentially involved into tumor/stroma interactions; however, the leptin receptor (ObR) gene was the most highly induced (2.4 fold, Table 1).
Table 1. Gene expression profile comparing RNA isolated from K303R-expressing with WT-expressing cells.
Table 2. Unchanged genes in the receptor family of CAFs-secreted factors among WT and K303R ERα-expressing MCF-7 breast cancer cells.
Gene name Gene Symbol
Interleukin 2 receptor α, interleukin 2 receptor γ, interleukin 7 receptor, interleukin 8 receptor β, interleukin 10 receptor α, interleukin 12 receptor β2, interleukin 13 receptor α2, interleukin 18 receptor 1, interleukin 22 receptor α
IL2RA, IL2RG, IL7R,
IL8RB, IL10RA,
IL12RB2, IL13RA2, IL18R1, IL22RA
Colony stimulating factor 3 receptor, colony stimulating factor 2 receptor CSF3R, CSF2R
Platelet derived growth factor receptor β PDGFRB
Nerve growth factor receptor
Tumor necrosis factor receptor, member 8, 9, 10 and 17
Chemokine (C-X-C motif) receptor 3, chemokine (C-X-C motif) receptor 6, chemokine (C-C motif) receptor 2, chemokine (C-C motif) receptor 3, chemokine (C-C motif) receptor 5, chemokine (C-C motif) receptor 6
NGFR
TNFR8, TNFR9, TNFR10, TNFR17
CXCR3, CXCR6, CCR2, CCR3, CCR5, CCR6
Aim 1
26
We also observed increased expression of different leptin signaling downstream effectors such as JAK2, the transcription factors fos, STAT, as well as the suppressor of cytokine signaling 3 (Table 3).
Gene name Gene Symbol Parametric P-value Fold change in
K303R clones Janus Kinase 2
Signal Transducer and Activator of Transcription
v-fos FBJ Murine Osteosarcoma Viral Oncogene Homolog Suppressor of Cytokine Signaling 3 JAK2 STAT FOS SOCS3 <1e-07 <1e-07 4e-07 0.009 3,7 15,1 5,2 1,2
Table 3. Selection of relevant up-regulated genes in the leptin signaling pathway in K303R ERα-expressing MCF-7 breast cancer cells.
To validate the microarray study, YFP-WT and YFP-K303R ERα-expressing cells were evaluated for a panel of genes using real-time PCR (Fig. 2A). K303R-associated induction could be confirmed for all of them, and, again, the gene encoding the long and short leptin receptor isoforms (ObRl/ObRs) was the most highly up-regulated in mutant-expressing cells. However, we did not detect any differences in IGF1R mRNA expression levels between the two cells, although microarray analysis showed a significant decrease of IGF1R. ERα RNA levels were similar between K303R and WT ERα-expressing cells.
The increase in both ObRl and ObRs was then confirmed by evaluating protein levels using immunoblotting analysis (Fig. 2B) and immunofluorescence staining of WT and K303R ERα-expressing cells (red, Fig. 2C).
Figure 2.Increased leptin receptor expression in mutant cells. A, real-time RT-PCR for different receptors of
CAF-secreted factors. n.s., nonsignificant; **P < 0.01; ***P < 0.005. B, immunoblotting showing leptin receptor long and short isoforms (ObRl/ObRs). GAPDH, loading control. Numbers represent the average fold change in ObRl and GAPDH and ObRs and GAPDH levels. C, immunofluorescence of ObR (a and c) and DAPI (b and d). Small squares, negative controls.
K303R ERα-overexpressing Cells Exhibit Increased Leptin Signaling Activation.
Given the gene expression profile identified in the microarray study, we defined the impact that a single factor-leptin may have on K303R ERα breast cancer cell progression. First, time-course response studies were performed to analyze phosphorylation of leptin downstream effectors using immunoblot analysis (Fig. 3A). WT-expressing cells exhibited low basal levels of phosphorylated JAK2, STAT3, Akt and MAPK that were increased in a time-dependent manner after leptin treatment. In contrast, K303R-expressing cells showed elevated constitutive phosphorylation of these signaling molecules in control-vehicle conditions that was slightly increased after leptin treatment. Thus, the mutant ERα expression was associated with increased leptin signaling activation.
Figure 2 B W T 1 W T 2 K 303R1 K 303R2 K 303R P ObRl GAPDH 1 1.1 1.7 1.4 2 1 0.9 5.4 4.7 6.2 ObRs C W T 1 K 303R1 ObR DAPI a b d c A 0 0.5 1 1.5 2 2.5 3 3.5
ObRl ObRs CXCR4 IR IL2R IL6R EGFR IGF1R FGFR3 ERα WT 1-2 K303R 1-2 m RN A T ra sc ri pt L eve ls (F ol d) *** *** *** *** ** ** ** ** n.s. n.s. D WT P K303R P WT1 K303R2 Lep (min) - 5 10 - 5 10 - 5 10 - 5 10 pAKT AKT pMAPK MAPK GAPDH pSTAT3 STAT3 pJAK2 JAK2 1 1.8 2.1 2 2 1.9 1 1.1 1.9 1.9 2.4 2 1 1.9 1.5 2.1 2.1 3.1 1 1.4 3.4 3.2 4.5 3.5 1 3.1 5.9 7 7.4 9.6 1 2 3.7 2 2 2.5 1 1.6 5.3 6 6 9 1 3.7 4.7 5 5.2 5.2 Figure 2 B W T 1 W T 2 K 303R1 K 303R2 K 303R P ObRl GAPDH 1 1.1 1.7 1.4 2 1 0.9 5.4 4.7 6.2 ObRs C W T 1 K 303R1 ObR DAPI a b d c A 0 0.5 1 1.5 2 2.5 3 3.5
ObRl ObRs CXCR4 IR IL2R IL6R EGFR IGF1R FGFR3 ERα
WT 1-2 K303R 1-2 m RN A T ra sc ri pt L eve ls (F ol d) *** *** *** *** ** ** ** ** n.s. n.s. D WT P K303R P WT1 K303R2 Lep (min) - 5 10 - 5 10 - 5 10 - 5 10 pAKT AKT pMAPK MAPK GAPDH pSTAT3 STAT3 pJAK2 JAK2 1 1.8 2.1 2 2 1.9 1 1.1 1.9 1.9 2.4 2 1 1.9 1.5 2.1 2.1 3.1 1 1.4 3.4 3.2 4.5 3.5 1 3.1 5.9 7 7.4 9.6 1 2 3.7 2 2 2.5 1 1.6 5.3 6 6 9 1 3.7 4.7 5 5.2 5.2 Figure 2 B W T 1 W T 2 K 303R1 K 303R2 K 303R P ObRl GAPDH 1 1.1 1.7 1.4 2 1 0.9 5.4 4.7 6.2 ObRs C W T 1 K 303R1 ObR DAPI a b d c A 0 0.5 1 1.5 2 2.5 3 3.5
ObRl ObRs CXCR4 IR IL2R IL6R EGFR IGF1R FGFR3 ERα WT 1-2 K303R 1-2 m RN A T ra sc ri pt L eve ls (F ol d) *** *** *** *** ** ** ** ** n.s. n.s. D WT P K303R P WT1 K303R2 Lep (min) - 5 10 - 5 10 - 5 10 - 5 10 pAKT AKT pMAPK MAPK GAPDH pSTAT3 STAT3 pJAK2 JAK2 1 1.8 2.1 2 2 1.9 1 1.1 1.9 1.9 2.4 2 1 1.9 1.5 2.1 2.1 3.1 1 1.4 3.4 3.2 4.5 3.5 1 3.1 5.9 7 7.4 9.6 1 2 3.7 2 2 2.5 1 1.6 5.3 6 6 9 1 3.7 4.7 5 5.2 5.2 A B C
Aim 1
28
Leptin directly activates ERα in the absence of its own ligand in MCF-7 breast cancer cells (41). As a consequence of the enhanced leptin signaling, we found increased ERα-transcriptional activity (Fig. 3B) and up-regulated mRNA levels of the classical ERα-target genes Cyclin D1, pS2 and Cathepsin D in both control and leptin-treated conditions in K303R ERα-expressing cells (Fig. 3C). In addition, the mutant exhibited elevated pS118 and pS167 YFP-ERα levels
Figure 3. Leptin signaling activation in mutant cells. A, immunoblotting of phosphorylated (p)
JAK2/STAT3/AKT/MAPK and total proteins from cells treated with vehicle (-) or leptin (Lep 100 ng/mL, 5 and 10 minutes). GAPDH, was used as loading control. Numbers represent the average fold change between phospho-, total, and GAPDH levels. B, ERα-transactivation assay in cells treated with vehicle (-), Lep at 10 and 100 ng/ml or 17-β estradiol (E2 10nM, positive control). Data are reported as Relative Lights Units (RLU). n.s.=nonsignificant, **P<0.01. C, mRNA expression of Cyclin D1, pS2, Cathepsin D and 36B4 (internal standard) by RT-PCR in cells treated with vehicle (-) or Lep 100ng/ml for 24 hours. NC, negative control. Numbers represent the average fold change between Cyclin D1, pS2 or Cathepsin D and 36B4 levels. D, total extracts from cells treated with Lep 100ng/ml for 5 and 10 min were analyzed for phosphorylation of serines 118 and 167 (pS118 and pS167) and expression of ERα by immunoblot analysis. Numbers below the blots represent the average fold change between pERα levels and ERα total protein expression.
Cathepsin D pS2 Cyclin D1 - Lep - Lep NC 36B4 WT1 K303R2 B 1 2.4 2 3.5 1 2.5 2.2 4.7 1 1.9 2 4.6 A ER El uc A ct iv ity (R LU ) Lep (ng/ml) - 10 100 E2 - 10 100 E2 WT1 K303R1 n.s. ** ** ** **** pS118 pS167 ER! WT P K303R P C Lep (min) - 5 10 - 5 10 1 1.4 1.5 3 3.5 3.3 1 1.8 2 6.2 7.5 7.2
Supplementary Figure 1. Activation of K303R ER! receptor by leptin. A, ER!-transactivation assay in cells treated with vehicle (-), Lep at 10 and 100 ng/ml or 17-" estradiol (E210nM, positive control). Data are reported as Relative Lights Units (RLU). n.s.=nonsignificant, **P<0.01. B, mRNA expression of Cyclin D1, pS2, Cathepsin D and 36B4 (internal standard) by RT-PCR in cells treated with vehicle (-) or Lep 100ng/ml for 24 hours. NC, negative control. Numbers represent the average fold change between Cyclin D1, pS2 or Cathepsin D and 36B4 levels. C, Total extracts from cells treated with Lep 100ng/ml for 5 and 10 min were analyzed for phosphorylation of serines 118 and 167 (pS118 and pS167) and expression of ER! by immunoblot analysis. Numbers below the blots represent the average fold change between pER! levels and ER! total protein expression.
B Cathepsin D pS2 Cyclin D1 - Lep - Lep NC 36B4 WT1 K303R2 B 1 2.4 2 3.5 1 2.5 2.2 4.7 1 1.9 2 4.6 A ER El uc A ct iv ity (R LU ) Lep (ng/ml) - 10 100 E2 - 10 100 E2 WT1 K303R1 n.s. ** ** ** **** pS118 pS167 ER! WT P K303R P C Lep (min) - 5 10 - 5 10 1 1.4 1.5 3 3.5 3.3 1 1.8 2 6.2 7.5 7.2
Supplementary Figure 1. Activation of K303R ER! receptor by leptin. A, ER!-transactivation assay in cells treated with vehicle (-), Lep
at 10 and 100 ng/ml or 17-" estradiol (E210nM, positive control). Data are reported as Relative Lights Units (RLU). n.s.=nonsignificant,
**P<0.01. B, mRNA expression of Cyclin D1, pS2, Cathepsin D and 36B4 (internal standard) by RT-PCR in cells treated with vehicle (-) or Lep 100ng/ml for 24 hours. NC, negative control. Numbers represent the average fold change between Cyclin D1, pS2 or Cathepsin D and 36B4 levels. C, Total extracts from cells treated with Lep 100ng/ml for 5 and 10 min were analyzed for phosphorylation of serines 118 and 167 (pS118 and pS167) and expression of ER! by immunoblot analysis. Numbers below the blots represent the average fold change between pER! levels and ER! total protein expression.
C Cathepsin D pS2 Cyclin D1 - Lep - Lep NC 36B4 WT1 K303R2 B 1 2.4 2 3.5 1 2.5 2.2 4.7 1 1.9 2 4.6 A ER El uc A ct iv ity (R LU ) Lep (ng/ml) - 10 100 E2 - 10 100 E2 WT1 K303R1 n.s. ** ** ** **** pS118 pS167 ER! WT P K303R P C Lep (min) - 5 10 - 5 10 1 1.4 1.5 3 3.5 3.3 1 1.8 2 6.2 7.5 7.2
Supplementary Figure 1. Activation of K303R ER! receptor by leptin. A, ER!-transactivation assay in cells treated with vehicle (-), Lep
at 10 and 100 ng/ml or 17-" estradiol (E210nM, positive control). Data are reported as Relative Lights Units (RLU). n.s.=nonsignificant,
**P<0.01. B, mRNA expression of Cyclin D1, pS2, Cathepsin D and 36B4 (internal standard) by RT-PCR in cells treated with vehicle (-) or Lep 100ng/ml for 24 hours. NC, negative control. Numbers represent the average fold change between Cyclin D1, pS2 or Cathepsin D and 36B4 levels. C, Total extracts from cells treated with Lep 100ng/ml for 5 and 10 min were analyzed for phosphorylation of serines 118 and 167 (pS118 and pS167) and expression of ER! by immunoblot analysis. Numbers below the blots represent the average fold change between pER! levels and ER! total protein expression.
D Cathepsin D pS2 Cyclin D1 - Lep - Lep NC 36B4 WT1 K303R2
B
1 2.4 2 3.5 1 2.5 2.2 4.7 1 1.9 2 4.6A
ER El uc A ct iv ity (R LU ) Lep (ng/ml) - 10 100 E2 - 10 100 E2 WT1 K303R1 n.s. ** ** ** **** pS118 pS167 ER! WT P K303R PC
Lep (min) - 5 10 - 5 10 1 1.4 1.5 3 3.5 3.3 1 1.8 2 6.2 7.5 7.2Supplementary Figure 1. Activation of K303R ER! receptor by leptin. A, ER!-transactivation assay in cells treated with vehicle (-), Lep
at 10 and 100 ng/ml or 17-" estradiol (E210nM, positive control). Data are reported as Relative Lights Units (RLU). n.s.=nonsignificant, **P<0.01. B, mRNA expression of Cyclin D1, pS2, Cathepsin D and 36B4 (internal standard) by RT-PCR in cells treated with vehicle (-) or Lep 100ng/ml for 24 hours. NC, negative control. Numbers represent the average fold change between Cyclin D1, pS2 or Cathepsin D and 36B4 levels. C, Total extracts from cells treated with Lep 100ng/ml for 5 and 10 min were analyzed for phosphorylation of serines 118 and 167 (pS118 and pS167) and expression of ER! by immunoblot analysis. Numbers below the blots represent the average fold change between pER! levels and ER! total protein expression.
B Cathepsin D pS2 Cyclin D1 - Lep - Lep NC 36B4 WT1 K303R2
B
1 2.4 2 3.5 1 2.5 2.2 4.7 1 1.9 2 4.6A
ER El uc A ct iv ity (R LU ) Lep (ng/ml) - 10 100 E2 - 10 100 E2 WT1 K303R1 n.s. ** ** ** **** pS118 pS167 ER! WT P K303R PC
Lep (min) - 5 10 - 5 10 1 1.4 1.5 3 3.5 3.3 1 1.8 2 6.2 7.5 7.2Supplementary Figure 1. Activation of K303R ER! receptor by leptin. A, ER!-transactivation assay in cells treated with vehicle (-), Lep
at 10 and 100 ng/ml or 17-" estradiol (E210nM, positive control). Data are reported as Relative Lights Units (RLU). n.s.=nonsignificant,
**P<0.01. B, mRNA expression of Cyclin D1, pS2, Cathepsin D and 36B4 (internal standard) by RT-PCR in cells treated with vehicle (-) or Lep 100ng/ml for 24 hours. NC, negative control. Numbers represent the average fold change between Cyclin D1, pS2 or Cathepsin D and 36B4 levels. C, Total extracts from cells treated with Lep 100ng/ml for 5 and 10 min were analyzed for phosphorylation of serines 118 and 167 (pS118 and pS167) and expression of ER! by immunoblot analysis. Numbers below the blots represent the average fold change between pER! levels and ER! total protein expression.
C Cathepsin D pS2 Cyclin D1 - Lep - Lep NC 36B4 WT1 K303R2 B 1 2.4 2 3.5 1 2.5 2.2 4.7 1 1.9 2 4.6 A ER El uc A ct iv ity (R LU ) Lep (ng/ml) - 10 100 E2 - 10 100 E2 WT1 K303R1 n.s. ** ** ** **** pS118 pS167 ER! WT P K303R P C Lep (min) - 5 10 - 5 10 1 1.4 1.5 3 3.5 3.3 1 1.8 2 6.2 7.5 7.2
Supplementary Figure 1. Activation of K303R ER! receptor by leptin. A, ER!-transactivation assay in cells treated with vehicle (-), Lep
at 10 and 100 ng/ml or 17-" estradiol (E210nM, positive control). Data are reported as Relative Lights Units (RLU). n.s.=nonsignificant,
**P<0.01. B, mRNA expression of Cyclin D1, pS2, Cathepsin D and 36B4 (internal standard) by RT-PCR in cells treated with vehicle (-) or Lep 100ng/ml for 24 hours. NC, negative control. Numbers represent the average fold change between Cyclin D1, pS2 or Cathepsin D and 36B4 levels. C, Total extracts from cells treated with Lep 100ng/ml for 5 and 10 min were analyzed for phosphorylation of serines 118 and 167 (pS118 and pS167) and expression of ER! by immunoblot analysis. Numbers below the blots represent the average fold change between pER! levels and ER! total protein expression.
D Cathepsin D pS2 Cyclin D1 - Lep - Lep NC 36B4 WT1 K303R2
B
1 2.4 2 3.5 1 2.5 2.2 4.7 1 1.9 2 4.6A
ER El uc A ct iv ity (R LU ) Lep (ng/ml) - 10 100 E2 - 10 100 E2 WT1 K303R1 n.s. ** ** ** **** pS118 pS167 ER! WT P K303R PC
Lep (min) - 5 10 - 5 10 1 1.4 1.5 3 3.5 3.3 1 1.8 2 6.2 7.5 7.2Supplementary Figure 1. Activation of K303R ER! receptor by leptin. A, ER!-transactivation assay in cells treated with vehicle (-), Lep at 10 and 100 ng/ml or 17-" estradiol (E210nM, positive control). Data are reported as Relative Lights Units (RLU). n.s.=nonsignificant,
**P<0.01. B, mRNA expression of Cyclin D1, pS2, Cathepsin D and 36B4 (internal standard) by RT-PCR in cells treated with vehicle (-) or Lep 100ng/ml for 24 hours. NC, negative control. Numbers represent the average fold change between Cyclin D1, pS2 or Cathepsin D and 36B4 levels. C, Total extracts from cells treated with Lep 100ng/ml for 5 and 10 min were analyzed for phosphorylation of serines 118 and 167 (pS118 and pS167) and expression of ER! by immunoblot analysis. Numbers below the blots represent the average fold change between pER! levels and ER! total protein expression.
B Cathepsin D pS2 Cyclin D1 - Lep - Lep NC 36B4 WT1 K303R2
B
1 2.4 2 3.5 1 2.5 2.2 4.7 1 1.9 2 4.6A
ER El uc A ct iv ity (R LU ) Lep (ng/ml) - 10 100 E2 - 10 100 E2 WT1 K303R1 n.s. ** ** ** **** pS118 pS167 ER! WT P K303R PC
Lep (min) - 5 10 - 5 10 1 1.4 1.5 3 3.5 3.3 1 1.8 2 6.2 7.5 7.2Supplementary Figure 1. Activation of K303R ER! receptor by leptin. A, ER!-transactivation assay in cells treated with vehicle (-), Lep
at 10 and 100 ng/ml or 17-" estradiol (E210nM, positive control). Data are reported as Relative Lights Units (RLU). n.s.=nonsignificant,
**P<0.01. B, mRNA expression of Cyclin D1, pS2, Cathepsin D and 36B4 (internal standard) by RT-PCR in cells treated with vehicle (-) or Lep 100ng/ml for 24 hours. NC, negative control. Numbers represent the average fold change between Cyclin D1, pS2 or Cathepsin D and 36B4 levels. C, Total extracts from cells treated with Lep 100ng/ml for 5 and 10 min were analyzed for phosphorylation of serines 118 and 167 (pS118 and pS167) and expression of ER! by immunoblot analysis. Numbers below the blots represent the average fold change between pER! levels and ER! total protein expression.
C Cathepsin D pS2 Cyclin D1 - Lep - Lep NC 36B4 WT1 K303R2
B
1 2.4 2 3.5 1 2.5 2.2 4.7 1 1.9 2 4.6A
ER El uc A ct iv ity (R LU ) Lep (ng/ml) - 10 100 E2 - 10 100 E2 WT1 K303R1 n.s. ** ** ** **** pS118 pS167 ER! WT P K303R PC
Lep (min) - 5 10 - 5 10 1 1.4 1.5 3 3.5 3.3 1 1.8 2 6.2 7.5 7.2Supplementary Figure 1. Activation of K303R ER! receptor by leptin. A, ER!-transactivation assay in cells treated with vehicle (-), Lep
at 10 and 100 ng/ml or 17-" estradiol (E210nM, positive control). Data are reported as Relative Lights Units (RLU). n.s.=nonsignificant,
**P<0.01. B, mRNA expression of Cyclin D1, pS2, Cathepsin D and 36B4 (internal standard) by RT-PCR in cells treated with vehicle (-) or Lep 100ng/ml for 24 hours. NC, negative control. Numbers represent the average fold change between Cyclin D1, pS2 or Cathepsin D and 36B4 levels. C, Total extracts from cells treated with Lep 100ng/ml for 5 and 10 min were analyzed for phosphorylation of serines 118 and 167 (pS118 and pS167) and expression of ER! by immunoblot analysis. Numbers below the blots represent the average fold change between pER! levels and ER! total protein expression.
D A WT1 K303R2 WT P K303R P Lep (min) - 5 10 - 5 10 - 5 10 - 5 10 pAKT AKT pMAPK MAPK GAPDH pSTAT3 STAT3 pJAK2 JAK2 1 1.8 2.1 2 2 1.9 1 1.1 1.9 1.9 2.4 2 1 1.9 1.5 2.1 2.1 3.1 1 1.4 3.4 3.2 4.5 3.5 1 3.1 5.9 7 7.4 9.6 1 2 3.7 2 2 2.5 1 1.6 5.3 6 6 9 1 3.7 4.7 5 5.2 5.2 C D A B
K303R ERα Mutation and Leptin Hypersensitivity.
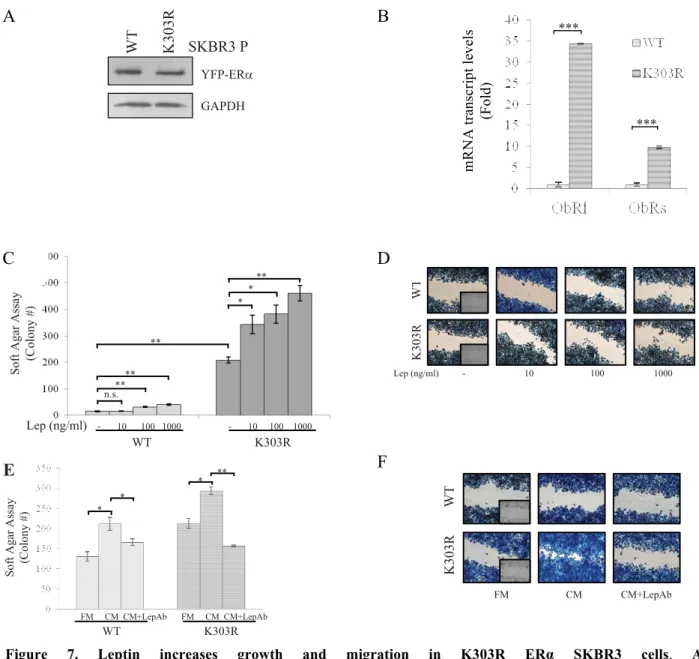
We next used these stably transfected clones as model systems to study leptin sensitivity, in relation to mutant receptor expression. First, we evaluated leptin effects on growth using anchorage-independent growth assays (Fig. 4A). Leptin treatments at 100 and 1000 ng/ml concentrations enhanced colony numbers in all four clones tested, even though to a higher extent in mutant-expressing cells. Moreover, leptin at 10 ng/ml increased anchorage-independent growth only in K303R cells. The increase in colony numbers induced by leptin was reversed by the JAK2/STAT3 inhibitor AG490 (Fig. 4B). We also used the antiestrogen ICI182,780 and found that this treatment suppressed anchorage-independent growth of both cell lines, indicating that ER expression remains important in growth regulation of these cells (Fig. 4B).
We next evaluated the ability of increasing doses of leptin to influence cell migration in wound-healing scratch assays (Fig. 4C). Again, the mutant cells moved farthest in either direction to close the gap compared to WT-expressing cells. Leptin treatments at 100 and 1000 ng/ml promoted cell motility in both WT and K303R-expressing cells, although to a higher extent in mutant cells. Interestingly, leptin at 10ng/ml stimulated migration only in K303R-expressing cells. Then, the capacity of cells to migrate across uncoated membrane in transmigration assays or to invade an artificial basement membrane-Matrigel in invasion assays was tested in the presence of leptin (Fig. 4D). While WT cells exhibited little motile and no invasive behaviour in
vitro, our data clearly demonstrated that mutant receptor expression increased both motility and
invasion of cells. High doses of leptin increased the number of migrated and invaded cells in both clones and again low doses of leptin stimulated motility and invasion only of cells expressing the K303R receptor. As expected, treatment with AG490 and ICI182,780 resulted in a clear reduction of both control-untreated and leptin-induced cell motility in wound-healing scratch assays, especially in K303R-expressing cells (Fig. 4E). In a previously work, Barone et al published that K303R ERα MCF-7 xenograft tumors grew faster than WT ERα tumors (31). In addition, MCF-7 xenograft tumors doubled control value after 13 weeks of leptin exposure (42). Thus, we determined if the mutant receptor-expressing breast cancer cells might exhibit an increased sensitivity to leptin stimulation also in vivo. We found that in mice treated with leptin, all xenografts derived from cells with K303R ERα expression doubled in size within 6 weeks of treatment, while none of xenografts from WT ERα-expressing cells doubled in size during this experiment (Fig. 4F). Thus, expression of the mutant generated a leptin hypersensitive phenotype
Aim 1
30
Figure 4. The K303R ERα mutation generates a leptin hypersensitive phenotype. A, soft agar assay in cells
treated with vehicle (-) or leptin (Lep 10, 100 and 1000 ng/mL). B, soft agar assay in cells treated with vehicle (-) or leptin (Lep; 100 ng/mL), with or without ICI182760 (ICI, 1 µmol/L) or AG490 (AG, 10 µmol/L). Scratch (C) and transmigration and invasion (D) assays in cells treated as indicated. n.s., nonsignificant;*P < 0.05; **P < 0.005; ***P < 0.001. E, scratch assay in cells treated with vehicle (-) or 100 ng/mL leptin, with or without ICI182760 or AG490. Small squares, time 0. F, WT- and K303R ERα– expressing cells were injected into mice (n=6 per group) supplemented with E2 and 230 µg/kg leptin OR vehicle (control). Survival curves [shown as percentage (%) of mice in which tumors had not doubled in size] are graphed as the time in weeks from treatment to a 2-fold increase in total tumor volume over baseline (time to tumor doubling).
Figure 3 A 0 50 100 150 200 250 300 350 S oft A ga r A ss ay (Col ony #) WT1 WT2 K303R1 K303R2 Lep (ng/ml) - 10 100 1000 - 10 100 1000 - 10 100 1000 - 10 100 1000 ** ** *** * * ** * n.s. ** ** n.s. ** C B F D E 0 5 10 15 20 25 Inva si on A ss ay (Ce ll s #) Lep (ng/ml) - 10 100 - 10 100 WT2 K303R2 n.s. * * ** * K303R2 WT2
ICI ICI + Lep
AG AG + Lep AG AG + Lep
- Lep
ICI ICI + Lep - Lep - 10 100 1000 Lep (ng/ml) W T 1 K 303R1 0 20 40 60 80 100 120 S oft A ga r A ss ay (Col ony #) Lep - + - + - + - + - + - + K303R2 WT1 ICI AG * * *** ** ICI AG Lep (ng/ml) 0 - 10 100 - 10 100 - 10 100 50 100 150 200 250 M igra ti on A ss ay (Ce ll s #) WT1 K303R1 K303R2 n.s. ** * * * ** *** * 0 1 2 3 4 5 6 7 8 0 20 40 60 80 100 120 WT1 K303R1 weeks % T um ors not doubl ed in s iz e ove r Cont rol
Figure 3
A
0 50 100 150 200 250 300 350 S oft A ga r A ss ay (Col ony #) WT1 WT2 K303R1 K303R2 Lep (ng/ml) - 10 100 1000 - 10 100 1000 - 10 100 1000 - 10 100 1000 ** ** *** * * ** * n.s. ** ** n.s. **C
B
F
D
E
0 5 10 15 20 25 Inva si on A ss ay (Ce ll s #) Lep (ng/ml) - 10 100 - 10 100 WT2 K303R2 n.s. * * ** * K303R2 WT2ICI ICI + Lep
AG AG + Lep AG AG + Lep
- Lep
ICI ICI + Lep - Lep - 10 100 1000 Lep (ng/ml) W T 1 K 303R1 0 20 40 60 80 100 120 S oft A ga r A ss ay (Col ony #) Lep - + - + - + - + - + - + K303R2 WT1 ICI AG * * *** ** ICI AG Lep (ng/ml) 0 - 10 100 - 10 100 - 10 100 50 100 150 200 250 M igra ti on A ss ay (Ce ll s #) WT1 K303R1 K303R2 n.s. ** * * * ** *** * 0 1 2 3 4 5 6 7 8 0 20 40 60 80 100 120 WT1 K303R1 weeks % T um ors not doubl ed in s iz e ove r Cont rol Figure 3 A 0 50 100 150 200 250 300 350 S oft A ga r A ss ay (Col ony #) WT1 WT2 K303R1 K303R2 Lep (ng/ml) - 10 100 1000 - 10 100 1000 - 10 100 1000 - 10 100 1000 ** ** *** * * ** * n.s. ** ** n.s. ** C B F D E 0 5 10 15 20 25 Inva si on A ss ay (Ce ll s #) Lep (ng/ml) - 10 100 - 10 100 WT2 K303R2 n.s. * * ** * K303R2 WT2
ICI ICI + Lep
AG AG + Lep AG AG + Lep
- Lep
ICI ICI + Lep - Lep - 10 100 1000 Lep (ng/ml) W T 1 K 303R1 0 20 40 60 80 100 120 S oft A ga r A ss ay (Col ony #) Lep - + - + - + - + - + - + K303R2 WT1 ICI AG * * *** ** ICI AG Lep (ng/ml) 0 - 10 100 - 10 100 - 10 100 50 100 150 200 250 M igra ti on A ss ay (Ce ll s #) WT1 K303R1 K303R2 n.s. ** * * * ** *** * 0 1 2 3 4 5 6 7 8 0 20 40 60 80 100 120 WT1 K303R1 weeks % T um ors not doubl ed in s iz e ove r Cont rol A B C D A 0 50 100 150 200 250 300 350 S oft A ga r A ss ay (Col ony #) WT1 WT2 K303R1 K303R2 Lep (ng/ml) - 10 100 1000 - 10 100 1000 - 10 100 1000 - 10 100 1000 ** ** *** * * ** * n.s. ** ** n.s. ** C B F D E 0 5 10 15 20 25 Inva si on A ss ay (Ce ll s #) Lep (ng/ml) - 10 100 - 10 100 WT2 K303R2 n.s. * * ** * K303R2 WT2
ICI ICI + Lep
AG AG + Lep AG AG + Lep
- Lep
ICI ICI + Lep - Lep - 10 100 1000 Lep (ng/ml) W T 1 K 303R1 0 20 40 60 80 100 120 S oft A ga r A ss ay (Col ony #) Lep - + - + - + - + - + - + K303R2 WT1 ICI AG * * *** ** ICI AG Lep (ng/ml) 0 - 10 100 - 10 100 - 10 100 50 100 150 200 250 M igra ti on A ss ay (Ce ll s #) WT1 K303R1 K303R2 n.s. ** * * * ** *** * 0 1 2 3 4 5 6 7 8 0 20 40 60 80 100 120 WT1 K303R1 weeks % T um ors not doubl ed in s iz e ove r Cont rol A 0 50 100 150 200 250 300 350 S oft A ga r A ss ay (Col ony #) WT1 WT2 K303R1 K303R2 Lep (ng/ml) - 10 100 1000 - 10 100 1000 - 10 100 1000 - 10 100 1000 ** ** *** * * ** * n.s. ** ** n.s. ** C B F D E 0 5 10 15 20 25 Inva si on A ss ay (Ce ll s #) Lep (ng/ml) - 10 100 - 10 100 WT2 K303R2 n.s. * * ** * K303R2 WT2
ICI ICI + Lep
AG AG + Lep AG AG + Lep
- Lep
ICI ICI + Lep - Lep - 10 100 1000 Lep (ng/ml) W T 1 K 303R1 0 20 40 60 80 100 120 S oft A ga r A ss ay (Col ony #) Lep - + - + - + - + - + - + K303R2 WT1 ICI AG * * *** ** ICI AG Lep (ng/ml) 0 - 10 100 - 10 100 - 10 100 50 100 150 200 250 M igra ti on A ss ay (Ce ll s #) WT1 K303R1 K303R2 n.s. ** * * * ** *** * 0 1 2 3 4 5 6 7 8 0 20 40 60 80 100 120 WT1 K303R1 weeks % T um ors not doubl ed in s iz e ove r Cont rol E F