Research Article
Headspace-Solid-Phase Microextraction-Gas
Chromatography as Analytical Methodology for the
Determination of Volatiles in Wild Mushrooms and Evaluation
of Modifications Occurring during Storage
Rosaria Costa, Selenia De Grazia, Elisa Grasso, and Alessandra Trozzi
Dipartimento di Scienze del Farmaco e dei Prodotti per la Salute (SCIFAR), University of Messina, Viale Annunziata, 98168 Messina, Italy
Correspondence should be addressed to Rosaria Costa; [email protected] Received 15 December 2014; Revised 18 March 2015; Accepted 18 March 2015 Academic Editor: Mengxia Xie
Copyright © 2015 Rosaria Costa et al. This is an open access article distributed under the Creative Commons Attribution License, which permits unrestricted use, distribution, and reproduction in any medium, provided the original work is properly cited. Mushrooms are sources of food, medicines, and agricultural means. Not much is reported in the literature about wild species of the Mediterranean flora, although many of them are traditionally collected for human consumption. The knowledge of their chemical constituents could represent a valid tool for both taxonomic and physiological characterizations. In this work, a headspace-solid-phase microextraction (HS-SPME) method coupled with GC-MS and GC-FID was developed to evaluate the volatile profiles of ten wild mushroom species collected in South Italy. In addition, in order to evaluate the potential of this analytical methodology for true quantitation of volatiles, samples of the cultivated species Agaricus bisporus were analyzed. The choice of this mushroom was dictated by its ease of availability in the food market, due to the consistent amounts required for SPME method development. For calibration of the main volatile compounds, the standard addition method was chosen. Finally, the assessed volatile composition of A. bisporus was monitored in order to evaluate compositional changes occurring during storage, which represents a relevant issue for such a wide consumption edible product.
1. Introduction
Mushrooms represent an individual kingdom in the life dom-ain. These extraordinary organisms take part in numerous aspects of human daily life: they are valuable foods, being a rich source of vitamins, proteins, and minerals, low in
calories and fats [1]; sources of medicines, that is, antibiotics,
and bioactive molecules, such as lectins, polysaccharides,
and lanostane-type triterpenoids [2–4]; and important means
in agricultural and food industries. Some edible species of mushrooms have been extensively reported in the literature concerning their chemical composition and/or their
biologi-cal activity, as in the case of Agaricus spp. or Tuber spp. [5–
7]. Other species, such as Ganoderma lucidum or Lentinus
edodes, are pivotal medicines in the chinese tradition, for
their immunomodulatory and radical scavenging actions
[8, 9]. However, there is no scientific evidence for many
other mushroom species which grow in the wild and are less commonly found in the groceries or vegetable markets. Nevertheless, either for a matter of taxonomic characteriza-tion or for toxicological purposes, it seems important as well to investigate the chemical composition of wild mushroom species. Although it cannot replace genetic studies, chemistry is a valid support to the morphological and physiological identification of mushroom species. For instance, some
Agar-icus species, including A. placomyces and A. pseudopratensis,
which are quite similar to the well-known edible A.
bis-porus, have been demonstrated to possess gastrointestinal
toxicity due to a high phenol content [10]. In this study,
freshly picked up samples of ten different species of wild mushrooms from South Italy were investigated by means of headspace-solid-phase microextraction-gas chromatography (HS-SPME-GC). In addition, in order to evaluate the poten-tial of this methodology for quantification of mushroom
Volume 2015, Article ID 951748, 10 pages http://dx.doi.org/10.1155/2015/951748
volatiles, samples of the cultivated species Agaricus bisporus were analyzed. The choice of this mushroom was dictated by its ease of availability in the food market, due to the consistent amounts required for SPME method development. Previous studies directed towards the shelf life modifications undergone by A. bisporus focused on (i) type of packaging
material under modified atmosphere [11]; (ii) use of biobased
(i.e., wheat gluten) packaging to preserve the mushroom
freshness [12]; (iii) hyperspectral imaging applied to
mush-rooms differently packed [13]; (iv) mushroom processing
through irradiation [14].
As it is well known, solid-phase microextraction (SPME) is a solvent-free sample preparation technique, introduced more than 20 years ago, which reflects the new trend toward
miniaturized techniques [15]. SPME can be undisputedly
considered as an environmentally friendly technique, offering a good compromise between selectivity and sensitivity, cost, and easiness of use. However, in SPME, the process of extraction is based on the achievement of equilibria between sample matrix and headspace and between headspace and fiber coating. SPME extraction is considered complete when the equilibria are established, although this phase does not correspond to the exhaustion of analytes from the sample matrix. This issue makes somehow challenging calibration procedures when SPME is chosen as a sample prepara-tion methodology. In order to make quantitaprepara-tion of SPME extracted analytes, a variety of calibration procedures are
available to the analyst [16]. In this context, the standard
addition method has been chosen as the most suitable to the quantification of volatiles in A. bisporus. Due to the complex-ity of the matrix, only predominant components have been calibrated. Once the ruggedness of the method developed is tested, a series of samples stored under different conditions have been evaluated, in order to monitor possible changes of the volatile fingerprint or formation of off-flavours.
2. Materials and Methods
2.1. Samples. Wild mushrooms were kindly donated by the
“Centro di Cultura Micologica” of Messina and belonged to the following species: Tricholomopsis rutilans (Schaeff.) Singer; Agrocybe aegerita (V. Brig.) Fayod; Clitocybe odora (Bull.) P. Kumm.; Agaricus xanthodermus Genev.;
Can-tharellus cibarius Fr.; Clathrus ruber Mich. ex Pers.: Pers.; Omphalotus olearius (DC.) Singer; Lactarius deliciosus (L.)
Gray; Lactarius chrysorrheus Fr.; and Ganoderma resinaceum Boud. All the mushrooms were collected in Sicily (South Italy), in the bush of the Peloritani and Nebrodi mountains, during the fall of 2013-2014. Upon collection, due to the high perishability of most mushrooms, samples were immediately brought to the laboratory and analyzed. Prior to extraction, samples were chopped and approximately 3 g was placed in 20 mL crimped vials for SPME extraction. Each sample was extracted by SPME in triplicate. Mushrooms of the species
Agaricus bisporus were purchased in local supermarkets and
immediately analyzed as well. Before analysis, they were ground in an electric grinder and approximately 3 g was placed in 20 mL crimped vials for compounds extraction.
Each sample was added with 10 mL of white mineral oil for SPME extraction. This is in order to have the same sample matrix conditions for both unspiked and spiked samples. For the evaluation of flavor modifications occurring during storage, some fresh samples were divided into two groups: the first group was analyzed immediately upon receipt; the
sec-ond group was stored in the refrigerator at +6–8∘C for 10 days.
2.2. SPME Extraction. SPME extraction was carried out in
the headspace mode by means of an AOC-5000 autosampler (Shimadzu) hyphenated with the GC-MS system. Two
dif-ferent fiber coatings were tested: a 65𝜇m
polydimethylsilox-ane/divinylbenzene (Supelco, Milan, Italy), 1 cm long, and a
50/30𝜇m DVB/Car/PDMS, 1 cm long. After SPME method
development, the PDMS/DVB fiber was chosen to extract the volatile components from the mushrooms. The fiber was conditioned following the manufacturer’s instructions before
its use. Samples were conditioned for 10 min at 50∘C and then
underwent the extraction step for 30 min at 50∘C. Analytes
were then desorbed for 1 min at 250∘C in the GC injector
in splitless mode. For calibration, the following standard compounds have been used: 3-octanone, 3-octanol, (2E)-octenol, benzyl alcohol, and benzaldehyde, all supplied by Sigma-Aldrich (Milan, Italy). Stock solutions of standard compounds (100,000 ppm) were prepared in white mineral oil. Serial dilutions from this stock solution were made and for each dilution 10 mL was drawn and added to the real sample. Calibration graphs were built up on 3 to 5 points, each corresponding to 3 replicates.
2.3. Gas Chromatography. GC-FID: a GC-2010 system
(Shi-madzu), with an SLB-5ms column (Supelco/Sigma-Aldrich,
Bellefonte, PA, USA), 30 m× 0.25 mm I.D. × 0.25 𝜇m df, was
used. For A. bisporus analysis, a different column stationary
phase was used: Supelcowax-10, 30 m × 0.25 mm I.D. ×
0.25𝜇m df. Oven temperature program was 40∘C at 5∘C/min
to 250∘C, held for 5 min and at 10∘C/min to 280∘C, held for
5 min. Injection mode was splitless, after 1 min split ratio:
1 : 20. Injector and FID temperatures were 250∘C and 280∘C.
Carrier gas was He, at 30.0 cm/s (97.4 kPa). Data is processed by GCsolution software (Shimadzu).
GC/MS: a GCMS-QP2010 system (Shimadzu) was used, equipped with the same columns used for GC-FID analyses. Oven program and injection parameters were the same as those for GC-FID. Carrier gas was He, at 30.0 cm/s. MS:
interface and source temperatures were 250∘C and 200∘C;
EI was 0.94 kV; mass range was 40–350 m/z; scan speed was 1,666 amu/s, and scan interval was 0.25 s. Data handling was by GCMSsolution, ver. 2.51 (Shimadzu). The system was equipped with commercial (Wiley, NIST08) and dedicated
mass spectral databases [17,18]. Identification of analytes was
based on three tools: (i) mass spectral matching with refer-ence spectra; (ii) coinjection with standard compounds, in consideration of the library used, FFNSC 2, which was created in the same laboratory and with the same instrumentation utilized for this study; (iii) comparison of experimental reten-tion indices with published values. For the measurement of
triacontane (Supelco/Sigma-Aldrich, PA, USA) was injected apart.
3. Results and Discussion
3.1. Wild Mushrooms. More than one hundred compounds
were determined in total in all the mushroom species
investi-gated, as can be seen in Table1. Some of them showed
charac-teristic profiles, sometimes compatible with their morpho-logical/physiological aspects. In general, the highest number of identified compounds was found in the species T. rutilans and A. xanthodermus. Characteristically, T. rutilans presented consistent amounts of the azulenes daucene (19%) and iso-daucene (38%), peculiar compounds of carrot seed essential oil. Among the other volatiles, the characteristic presence of alpha-selinene was detected. The amber note of this component could justify the slight wood notes of T. rutilans.
A. xanthodermus showed a volatile composition dominated
by C8 compounds, that is, 1-octen-3-ol (82%) and 3-octanone (10%), which are secondary metabolites of most mushrooms and give them their typical odour. Lactarius deliciosus and
Lactarius chrysorrheus have quite similar morphological
features, with a basic difference laying on the fact that L.
deliciosus is edible, whereas L. chrysorrheus is poisonous [21].
The SPME-GC analysis highlighted noticeable differences between the two species: L. deliciosus, which grows only under pine trees, presented, apart from an abundant fraction of 3-octanone, consistent amounts of terpenoids, such as limonene (5%), linalool (8%), and dihydrocitronellol (4%); on the other hand, in L. chrysorrheus, no terpenes were deter-mined, while the characteristic C8 compounds predominated at ratios different from the edible L. deliciosus: 1-octen-3-ol (10%), 3-octanone (2%), 3-octanol (53%), and (2E)-octenal (5%). Also, considerable amounts of 3-methylbutanal (11%) and hexanal (2%), which are typical volatiles of truffles, were found as well.
The mushroom A. aegerita, when chopped or injured, smells like wine and acidic. The analysis revealed consistent amounts of ethanol (34%) and isopropyl acetate (10%); fur-thermore, 30% of isopentanol was found, olfactively
described as having “whiskey” notes [22].
Some lethal accidents have been registered for ingestion of Omphalotus olearius, which can be disguised with the edible species Cantharellus cibarius. O. olearius is strong orange-coloured and contains luciferins which make it visible even in the dark, under enzymatic action of luciferase. Some azulenes have been found in the present study, although carotenoids are very likely the true responsible for the orange
colour [23]; of course, carotenoids have high molecular
masses and cannot be assessed by means of GC techniques. The accidental ingestion of O. olearius is made even worse by its appealing flavor, which recalls the floreal bouquet of wine, with mushroom notes, due to the presence of isobutanol (11%), linalool (29%), and 3-octanone (11%). On the contrary, C. cibarius is one of the most appreciated among edible mushrooms. Predominant volatiles of this mushroom resulted to be the C8 compounds; however, it possesses olfactive notes of peach peel and fruity candies, which are
1 2 3 4 5 6789 10 12 11 13 1415 1617 19 2022 23 24 25 26 27 28 29 30 32 34 35 36 3738 39 31 33 40 41 43 45 46 47 48 49 51 50 0.0 2.5 5.0 7.5 10.0 12.5 15.0 17.5 20.0 22.5 25.0 27.5 (min) 21 18 44 𝜇V (×10,000)
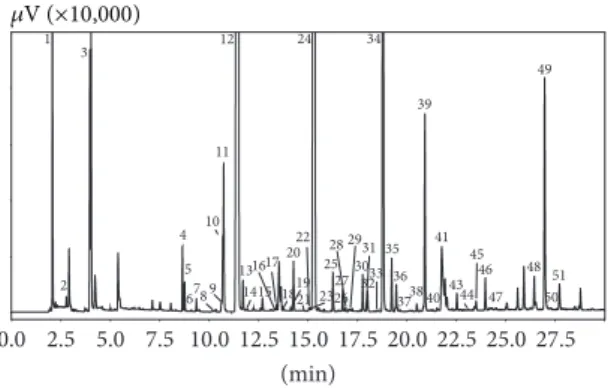
Figure 1: HS-SPME-GC-FID chromatogram of a fresh A. bisporus sample. Peak top numbers refer to Table2.
explained by the determination of hexanal, chemical utilized in food industry for the production of fruity flavors, and of (3Z)-hexen-1-ol, which smells like fruits. The mushroom
Clitocybe odora showed a predominant amount of
5-hexen-2-one, compound with ethereal/floral notes. Upon injury, the fresh individual releases an anise-like odour and, although in low quantity (0.5%), estragole was found among volatiles. Surprisingly, no relevant amounts of C8 compounds were detected in this species.
It is worthwhile discussing apart the last two species of wild mushrooms under investigation, which were Clathrus
ruber and Ganoderma resinaceum. C. ruber is a rare species,
endemic of the Mediterranean area, with an odd look. The fruiting body, originally included in an egg, has the shape of a round ball composed of interlaced branches; the branches are spongy, red, pink, or orange, with a slime on their inner surfaces. This mushroom emits a foul, corpse-like, and pungent smell, which acts as attractant for flies in order to spread the mushroom spores. In the analyses carried out here, characteristic compounds of C. ruber were furfuryl methyl sulfide (68%), which is olfactively described as being pungent, sulfuraceous, radish-mustard; pentanal (15%); and camphor (5%), which are pungent as well. About the corpse-like smell, this is normally attributed to biogenic amines, such as cadaverin and putrescine, which can be detected with different analytical methodologies rather than SPME-GC-MS. Finally, samples of Ganoderma resinaceum were analyzed, which is a wood-decaying mushroom, from the same family of Ganoderma lucidum, known as Reishi in traditional chinese medicine. As indicated by the name, this mushroom has a resinaceous texture; it is not as perishable as the other wild mushrooms, due to a very low content of water. Major compounds determined in this species were hexanal and terpenes, that is, limonene and alpha- and beta-pinene. The typical C8, mushroom smelling compounds, were detected only at trace or low level (3-octanone: 3%).
3.2. Quantification of A. bisporus Volatiles. Table2reports all
the compounds determined in the volatile fraction of A.
bis-porus. The correspondent chromatogram is shown in Figure1.
In total, 51 compounds were identified, with the main ones being aliphatic alcohols and ketones, typically characterized by 8 carbon atoms skeleton, such as: 3-octanone, 3-octanol,
T a ble 1: R ela ti ve p er cen ta ge s (% n o rma lized F ID p ea k ar ea s) an d line ar ret en ti o n indices o f vo la ti les d et er mined in wi ld m u shr o o m s by m ea n s o f HS-S P M E-GC-MS. Nu m b er LRI exp LRI lib T . ru ti la n s A . ae ge ri ta C . od or a A . xa n th od er m u s C . ci ba ri u s C . ru be r O . ol ea ri u s L . d el ic io su s L . ch ry so rr h eu s G . re si n ac eu m A rea % A re a% A rea % A re a% A rea % A re a% A rea % A re a% A rea % A re a% 1E th an al — 4 0 8 c — — — 0.26 0.1 — — 5.6 3 4.9 2 2.01 2E th an o l — 4 63 c — 33.88 0.1 7 — — — — — — — 3 5-H ex en-2-o ne — — — 0.4 4 63.4 6 0.22 1.4 9 — — 4 .4 4 2.5 4 — 42 -B u ta n o l — 6 03 a —— — — — 5. 4 2 — — — — 5 E th yl acet at e — 6 0 6 b 0.67 — — — — — — — — — 6 2-M et h yl p ro p an -1 -o l — 62 1 a —1 3. 01 — — — — — — — — 7M et h yl p ro p an o at e — 63 4 b 0.6 4 — — — — — — — — — 8 Is o p ro p yl acet at e — 65 0 a —9 .8 1 — — — — — — — — 9I so b u ta n o l — 65 0 b — — — — — — 15.4 9 2.4 8 — — 10 2-M eth yl b u ta n al — 65 4 b 4.79 — — 0.88 — — — 1.2 8 — — 11 2-M eth yl is o vale ralde h yde — 658 b 2.98 — — — — — — — — — 12 B u tyralde h yd e — 6 62 a — — 0.4 9 — 0.07 — — — — — 13 3-M eth yl b u ta n al — 66 4 a — — 2.6 3 0.2 3 1.3 2 — — — — — 14 3-M et h yl -2-b u ta n o l — 6 71 b 0.0 2 — 1.8 9 0.3 5 0.2 4 — — — — — 15 H ydr o x yacet o n e — 69 8 c — — — 0.79 0.67 — — — — — 16 P en tana l 70 0 70 4 b — — — 0.7 3 — 14.8 5 — — — — 17 3-M et h yl -1 -b u ta n o l 73 2 73 1 b — 29 .3 7 21.5 1 0.11 2.20 1.9 2 4.45 — — — 18 2-M et h yl -1 -b u ta n o l 73 3 73 1 a — — — — — — 0.6 3 — — — 19 2-M eth yl pe n ta n al 74 1 758 a — — — 0.0 2 0.47 — — — — — 20 P en ta n o l 76 6 76 2 b — — — 0.21 0.79 — 0.16 — — — 21 (3Z)-H ex enal 79 0 797 b 0.0 4 — — — — — — — — — 22 H exa n al 80 1 80 1 b — — 0.1 7 0.3 9 3.10 — 49 .5 6 — 2.3 1 37 .3 5 23 E th yl b u ta n oa te 81 3 80 2 b 0.07 — — — — — — — — — 24 (3Z)-H ex en-1 -o l 845 85 0 b — — 0.20 — 9. 78 — — 0.8 4 0.9 0 — 25 (2E)-H ex enal 85 2 84 6 b — — — 0.5 5 — — — — — — 26 H exa no l 87 0 867 a — 0.1 4 0.1 4 0.5 2 0.3 9 — 6.86 — — 4.8 2 27 3-H ep ta n o n e 88 3 88 5 a — — — — 0.5 0 — — — — — 28 2-H ep ta n o n e 88 9 88 9 b — — 4.6 3 — — — — 2.6 3 — 0.5 0 29 (2E,4E)-H exadienal 89 0 91 4 a — — — — 0.0 2 — — — — — 30 H ep ta n al 90 2 9 02 d — 0.0 2 — 0.0 9 0.8 4 — — 0 .1 9 0.5 5 31 B u ty lp rop an o at e 9 0 7 9 0 7 b — — — — — — — — — 0.6 5 32 P en ty lacet at e 915 91 2 a —— — — — — — — — 1. 65 33 𝛼 -Th u je n e 92 5 92 4 b — — 0.3 0 — — — — — — 0.1 9 34 𝛼 -P inene 93 2 93 2 b — — 0.20 — — 0.08 — — — 0.2 4 35 E th yl ti gl ate 93 7 939 b — — — — — — — — — 0.8 5 36 C am p hene 94 8 95 4 d — — — — — 0.1 4 — — — — 37 (2E)-H ep te nal 95 5 95 6 a — — — 0.0 3 — — — — — — 38 B enzaldeh yde 9 61 95 2 b — — 0.07 0.0 6 — — — — 0.0 9 — 39 H ept anol 97 0 970 a — — — 0.11 — — — — — — 40 𝛽 -P inene 97 6 97 4 b — — 0.1 4 — — 1.5 4 0.6 2 — — 2.7 5
Ta b le 1: C o n ti n u ed . Nu m b er LRI exp LRI lib T . ru ti la n s A . ae ge ri ta C . od or a A . xa n th od er m u s C . ci ba ri u s C . ru be r O . ol ea ri u s L . d el ic io su s L . ch ry so rr h eu s G . re si n ac eu m Ar ea % A re a% Ar ea % A re a% Ar ea % A re a% Ar ea % A re a% Ar ea % A re a% 41 1-O ct en-3-o n e 97 8 97 2 b 0.94 0.12 — 0.0 3 2.88 — — — 0 .26 — 42 en do -2-N o rb o rn eo l 980 98 2 b — — — — — 0.6 2 — — — — 43 1-O cte n -3 -ol 98 1 979 d 4.2 4 — — 82.5 6 — — 1.07 — 10.4 9 — 4 4 3-O ct ano ne 98 3 979 b 3.4 4 9. 51 0.6 9 10.6 3 21.8 1 — 16.0 6 59 .80 2.5 6 3.15 45 M yr cene 988 988 b 1.4 4 — — — — — — — — 3.6 9 46 2-P en th yl fu ra n 98 9 984 b — — — 0.11 — — — — — — 47 1,3,5-T rimet h yl b enzene 9 94 9 94 b — — — — — — — — — 0.6 1 4 8 F u rf ur yl met h yl sulfide 988 9 98 a — — — — — 6 8.5 2 — — — — 49 3-Octa n o l 999 999 a — 0.7 4 0.5 2 — 15.8 5 — 1.08 — 6 4.16 — 50 Octa n al 100 5 1006 a — 0.01 — 0.13 0.79 — — — 0.7 0 1.7 8 51 𝛼 -T er p inene 101 4 101 4 b — — — — — — — — — 0.16 52 1,4-Cine ole 1015 101 2 b — — — — — — — — — 0.0 9 53 p-C ymene 10 23 10 27 b 0.3 0 0.0 4 0.10 0.0 2 — — — — — 1.5 0 54 L imo nene 10 30 10 30 a 4.41 0.16 0.6 6 — 1.15 — 0.5 2 5.10 3.10 29 .08 55 (E)-𝛽 -O cimene 10 4 4 10 41 d 0.0 3 0.13 0.08 — — — 0.13 — — 0 .79 56 𝛾-T er p inene 1057 105 4 b 0.18 — 0.4 0 — — — 0.5 5 — — 2.3 3 57 tr an s-2-U ndeceno l 10 57 10 58 d — — — 0.07 — — — — — — 58 (2E)-O ct enal 10 59 10 59 a — — — 0.10 9.6 9 — — — 5.10 — 59 (2E)-O ct en-1 -o l 10 6 7 10 6 7 a — 0.0 3 — 0.11 25.8 5 — — — 1.9 1 — 60 tr an s-L inalo o lo xide 107 0 108 4 b — — — — — — 0.2 7 0.4 4 — — 61 cis -3-N o nen- 1-ol 107 1 10 63 b — — — 0.01 — — 0.13 — — — 62 cis-Sab inene h ydra te 107 2 10 69 a — — — — — — — 0.8 9 — — 63 O ct an o l 10 73 10 63 b — 2.5 3 — 0.3 3 — — — — — — 6 4 p-M en tha-2,4(8)diene 108 4 1088 d — — — — — — 0.05 — — — 65 T er p in o len e 1086 108 9 d 0.0 6 — 0.16 — — — — — — 0 .4 3 6 6 L ina lo ol 10 97 10 95 b 1.1 8 — — — — — 2.0 9 8.13 — — 67 N o na na l 110 6 1101 d 0.5 1 — — 0.0 3 — 1.4 8 — 3.7 6 0 .7 7 2.47 6 8 P h enet h yl alco h o l 111 6 1113 a — 0.05 — — — — — — — — 69 C amp h o r 114 6 114 9 a — — — — — 4.87 — — — — 70 P h eno l 11 6 6 11 71 a — — — — — 0.07 — — — — 71 (6Z)-N o n en-1 -o l 11 76 11 73 a — — — — — 0.13 — — — — 72 neo-V erba n o l 11 80 11 85 a — — — — — — — — — 0.67 73 m-C ymen-8-o l 118 5 11 76 b — — — — — — — — — 0.1 4 74 P ela rg o l 120 0 120 0 a —— — — — — — 3. 71 — — 75 Es tra go le 120 1 120 1 a — — 0.5 3 — — — — — — — 76 Deca n al 120 2 120 1 b — — — — — — — 0 .3 0 — 0.4 0 77 C ar von e 124 5 124 6 a — — — — — — — — — 0.0 9 78 L ina lo o lacet at e 12 49 12 54 b — — — — — — — — — 0.6 0 79 2-U n de ca no ne 13 02 12 93 b 0.10 — — 0.29 — — — — — — 80 1-H ep ten-3-o l 13 23 13 35 a —— — — — — — 0 .2 1 — —
Ta b le 1: C o n ti n u ed . Nu m b er LRI exp LRI lib T . ru ti la n s A . ae ge ri ta C . od or a A . xa n th od er m u s C . ci ba ri u s C . ru be r O . ol ea ri u s L . d el ic io su s L . ch ry so rr h eu s G . re si n ac eu m Ar ea % A re a% Ar ea % A re a% Ar ea % A re a% Ar ea % A re a% Ar ea % A re a% 81 Da u ce n e 138 2 138 0 b 18.7 4 — 0.4 4 — — — 0.0 9 — — — 82 T et radecene 13 91 13 88 b —— — — — — — 0 .0 9 — — 83 𝛽 -E lemene 13 92 13 89 b 0.5 5 — — — — — — — — — 84 𝛽 -L ong ipi n en e 14 0 0 14 0 0 b 0.4 8 — 0.05 — — — — — — — 85 L o n gif o lene 1412 14 0 7 b — — — — — — — 0.16 — — 86 𝛼 -S an ta le n e 14 19 14 16 b — — — — — 0.0 2 — — — 0.4 6 87 (E)-C ar yo p h yl lene 14 21 14 17 b — — — 0.0 3 — — — — — — 88 𝛽 -C op ae n e 143 2 143 0 b — — — — — — — 0.11 — — 89 C u b eb-11 -ene 14 50 14 45 d 0.3 2 — — — — — — — — — 9 0 (E)-𝛽 -F ar nes ene 14 52 14 54 b 0.4 8 — — — — — — — — — 91 𝜀-M uu ro le n e 14 65 14 55 d 0.3 1 — — — — — — — — — 92 9-ep i-C ar yo p h yl lene 14 6 8 14 6 4 b 0.5 0 — — — — — — — — — 93 𝛾-G ur ju nene 14 78 14 75 b 0.7 4 — — — — — — — — — 94 𝛾-C ur cu mene 14 83 14 79 b 0.1 4 — — — — — — — — — 95 𝛽 -B erga mo tene 14 84 14 83 a — — — — — 0.0 4 — — — — 96 𝛾-M uu ro le n e 14 87 14 83 d 0.13 — — — — — — — — — 97 𝛽 -S elinene 14 91 14 86 d 1.94 — — — — — — — — — 98 𝛼 -S el in en e 1500 150 1 a 6.8 5 — 0.2 4 — — — — — — — 9 9 G er m acr ene A 15 05 15 03 d 0.6 5 — — — — — — — — — 10 0 𝛽 -B is ab o lene 15 10 15 0 5 b 0.7 4 — — — — 0.11 — — — — 101 A la skene 151 5 151 5 a 1.5 0 — — — — — — — — — 10 2 (Z) -𝛾 -B is ab o lene 15 24 15 14 b 0.3 8 — — — — — — — — — 10 3 Is o da ucene 15 30 15 0 4 a 38.41 — 0.1 4 — — — 0.1 9 — — — 10 4 𝛼 -C adinene 15 4 6 15 37 b 0.15 — — — — — — — — — 10 5 H ed yc ar yol 155 2 15 4 6 b 0.12 — — — — — — — — — 10 6 (E )-N er o li d o l 156 2 156 1 a 0.8 2 — — — — — — — — — LRI exp = exp er imen ta ll ine ar ret en tio n index m ea sur ed o n SLB-5m s co lumn. LRI lit = line ar ret en tio n index, re tr ie ve d fr o m d at ab as e/li te ra tu re .S o u rc es: aFFNSC 2 [ 17 ]; bAd am s 4 th ed it io n [ 18 ]; cNi st W eb B o o k [ 19 ]; dJo u la in an d K ¨onig [ 20 ].
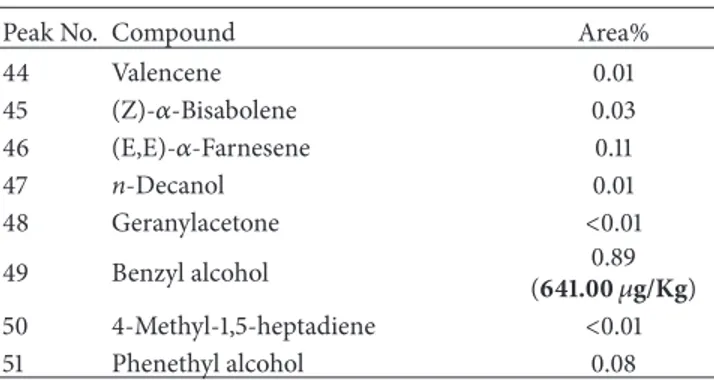
Table 2: Flavor volatiles in fresh samples of A. bisporus expressed as relative FID peak areas. In parentheses, quantitative values obtained by the standard addition method. Compounds are listed according to the elution order on Supelcowax-10 (PEG) column.
Peak No. Compound Area%
1 Ethanol 1.61 2 Butane 0.08 3 2-Methyl butanal 0.58 4 2-(1-Ethylpentyl-)-1,3-dioxolane 0.14 5 Ethylbutyl ketone 0.11 6 n-Undecane 0.06 7 Limonene 0.06 8 2-Butanol <0.01 9 Ethyl hexanoate 0.18 10 2-Methyl butanol 0.15 11 Isopentyl alcohol 0.28 12 3-Octanone 77.46 (5,587.00𝜇g/Kg) 13 n-Pentanol 0.08 14 n-Dodecane <0.01 15 1-Octen-3-one 0.03 16 3-Heptanol 0.01 17 (2E)-Heptenal 0.03 18 6-Methyl-5-hepten-2-one 0.01 19 3-Nonanone 0.03 20 n-Hexanol 0.10 21 n-Tridecane <0.01 22 Heptylmethyl ketone 0.02 23 n-Nonanal 0.02 24 3-Octanol 13.73 (2,850.00𝜇g/Kg) 25 (2E)-Octenal 0.09 26 3,6-Dimethyl-3-octanol <0.01 27 1-Octen-3-ol 0.08 28 n-Heptanol 0.01 29 Dihydromyrcenol 0.01 30 2-Ethyl hexanol 0.08 31 Hydroxymethyl 2-hydroxy-2-methylpropionate 0.01 32 (2E,4E)-Hexadienal 0.04 33 (2E)-Heptenol <0.01 34 Benzaldehyde 2.34 35 Linalool 0.11 36 n-Octanol 0.07 37 n-Tetradecane <0.01 38 2-Undecanone 0.03 39 (2E)-Octenol (654.000.42𝜇g/Kg) 40 1,5-Heptadiene-3,4-diol 0.03 41 Phenylacetaldehyde 0.46 42 n-Nonanol 0.05 43 (3Z)-Nonenol 0.05 Table 2: Continued.
Peak No. Compound Area%
44 Valencene 0.01 45 (Z)-𝛼-Bisabolene 0.03 46 (E,E)-𝛼-Farnesene 0.11 47 n-Decanol 0.01 48 Geranylacetone <0.01 49 Benzyl alcohol (641.000.89𝜇g/Kg) 50 4-Methyl-1,5-heptadiene <0.01 51 Phenethyl alcohol 0.08
and (2E)-octenol. Also, compounds with aromatic ring were determined at considerable amounts, such as benzaldehyde and benzyl alcohol. As reported above, during SPME method development, two different fiber coatings were tested, namely,
DVB/Car/PDMS (50/30𝜇m) and PDMS/DVB (65 𝜇m). The
latter was chosen in the final optimized conditions because it gave a better performance in terms of linearity and
repeatability. Table3reports, among other values, the linear
ranges observed for both of the two fibers. As can be seen, the triple phase showed scarce linearity compared to the PDMS/DVB phase. Although the recoveries were good also
for the triple phase (see Figure2), its analytical behaviour
was in general estimated as worse, basically due to carry-over and displacement effects. To solve carry-over, continuous clean-up (with hot temperature) was necessary in between of consecutive analyses, whereas the displacement effect caused dramatic reduction of repeatability and linearity. These undesired phenomena were sometimes reported as being dependent on the inner porous layer of Carboxen
present in the DVB/Car/PDMS fiber coating [24].
Addition-ally, the triple phase showed a shorter lifetime compared to the double phase; this is reasonable, when considering the complex nature of the matrix and the weakness acquired by the triple phase by the repetitive clean-up cycles. Prior to calibration, some considerations were made. When SPME is chosen as sample preparation technique, the decision of which approach is the most convenient depends on sample matrix (liquid or solid), its complexity, and extraction mode (headspace or immersion). As mushroom flavour is being a complex sample from a solid matrix, the standard addition approach has been chosen in this study for quantification
of analytes [16]. In fact, a different approach, such as
exter-nal standard calibration, would not take into account the so-called “matrix effect.” Previously, the external standard method was chosen for the calibration of SPME extracts
of another species of mushroom [25]. However, in that
calibration procedure, the target analyte was quantified sepa-rately, without considering the solid matrix effects that affect the SPME extraction process. In fact, when target analytes are embedded in a complex matrix, they establish several uncontrollable interactions with other constituents. Further-more, the linear regression equation obtained for 1-octen-3-ol was indiscriminately used for all the v1-octen-3-olatiles extracted, sulphur compounds included. On the other hand, the internal standard method is mostly advised for simpler matrices.
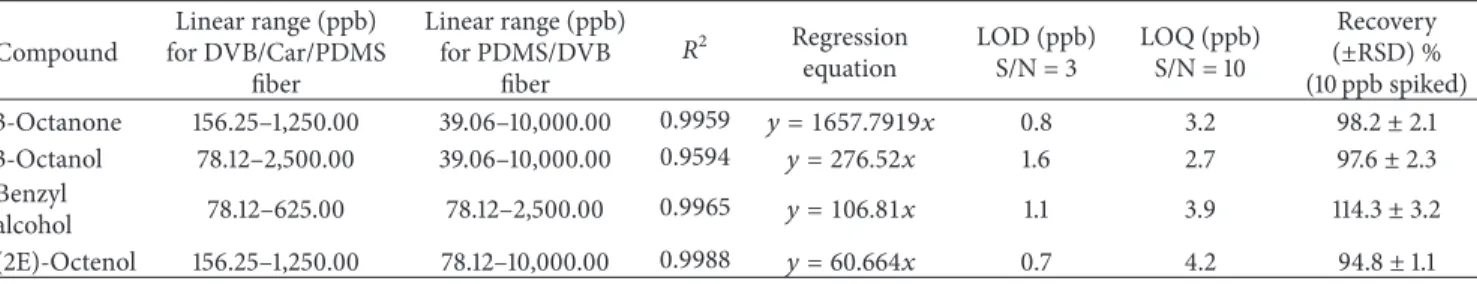
Table 3: Validation data for predominant volatiles of Agaricus bisporus: linear regression data, limit of detection (LOD), limit of quantification (LOQ), and recovery values (average of three analyses).
Compound Linear range (ppb) for DVB/Car/PDMS fiber Linear range (ppb) for PDMS/DVB fiber 𝑅2 Regression equation LOD (ppb) S/N = 3 LOQ (ppb) S/N = 10 Recovery (±RSD) % (10 ppb spiked) 3-Octanone 156.25–1,250.00 39.06–10,000.00 0.9959 𝑦 = 1657.7919𝑥 0.8 3.2 98.2± 2.1 3-Octanol 78.12–2,500.00 39.06–10,000.00 0.9594 𝑦 = 276.52𝑥 1.6 2.7 97.6± 2.3 Benzyl alcohol 78.12–625.00 78.12–2,500.00 0.9965 𝑦 = 106.81𝑥 1.1 3.9 114.3± 3.2 (2E)-Octenol 156.25–1,250.00 78.12–10,000.00 0.9988 𝑦 = 60.664𝑥 0.7 4.2 94.8± 1.1 0 20 40 60 80 100 120 140
3-Octanone 3-Octanol Benzyl
alcohol Reco ve ry (%) PDMS/DVB DVB/Car/PDMS (2E)-Octenol
Figure 2: Comparison of the recoveries obtained with the SPME fiber coatings DVB/Car/PDMS and PDMS/DVB.
The calibration procedure used in this application succeeded in the absolute quantification of mushroom key compounds.
As can be seen in Table 3, satisfactory coefficients of
regression were obtained, although, in some cases (e.g., 3-octanol), the procedure was time-consuming. The method was validated in terms of linearity, limits of detection, limits of quantification, recovery, and repeatability. Linearity was assessed through the construction of a multipoint calibration curve, at five different concentration levels. Three runs were carried out for each point of the curve. For the calculation of LODs and LOQs, five replicates of unspiked samples were
run. LOD was measured based on the formula LOD= 𝑡99∗ 𝑠,
where𝑡99 is the Student’s𝑡 value relative to a 99% level of
confidence and𝑛 − 1 degrees of freedom and 𝑠 is the standard
deviation. LOQ was measured as 10 times the standard deviation used for LOD. For recovery measurements, samples spiked with 10 ppb of standard compound were subjected to SPME extraction, each in triplicate. The detector signals corresponding to the analytes in unspiked samples were taken into account and subtracted in recovery analyses.
The GC method precision was rated as good, in terms of repeatability, through the measurement of RSD%, which was generally lower than 12%. However, the standard addi-tion method resulted was quite troubling for benzalde-hyde, compound that showed very high affinity for both of the fiber coatings tested. This means that the relation between analyte concentration and FID response, from a certain concentration downwards, was not linear any longer, mak-ing benzaldehyde quantification not reliable. Previously, an alternative methodology, namely, multiple headspace-solid-phase microextraction, was successfully applied to the
quan-tification of truffle’s volatiles [26]. As quantitative analysis in
SPME is being a challenging task, this work aimed to explore further the various possibilities available to the analyst.
3.3. Flavor Changes during Storage. Once the chemical
com-position of mushrooms flavor is assessed, the method was applied to the investigation of possible modifications occur-ring duoccur-ring storage. In Italy, such a type of mushrooms, when purchased in the supermarkets, is commonly found in refrigerated counters. Therefore, 10-day-old mushrooms, kept in the refrigerator, were analyzed and quali-quantitative differences have been evaluated, through comparison with
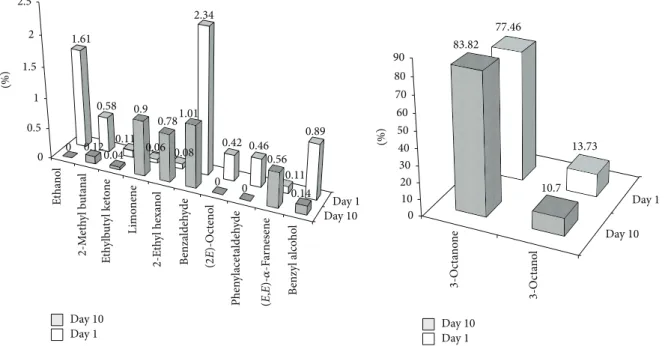
the profiles of fresh individuals (see Figure 3). Basically,
after a period of 10 days of storage, a reduction of the volatile fraction, consisting of about 3.5%, was observed. For instance, the peaks relative to ethanol, (2E)-octenol, and phenylacetaldehyde could not be detected any longer in the stored mushrooms. A drastic decrease of compounds with aromatic ring was also observed. More or less constant was the amount of terpenoids. Interestingly, concerning the typical mushroom-smelling C8 compounds, 3-octanol and (2E)-octenol underwent a reduction. In the latter case, the amount was completely zeroed, whereas a correspondent increase of 3-octanone was observed. It seems reasonable that the two alcohols oxidize to ketone during storage.
Other researchers have previously reported the biosyn-thetic pathways occurring in mushrooms responsible for
8-carbon volatiles formation [25–28]. It has been demonstrated
that linoleic acid, a constituent of mushrooms, is a common precursor of such molecules, utilized by certain enzymes
as starting substrate [29]. More specifically, Combet et al.
have shown that the formation of C8 compounds from mushroom tissues is proportional to the “damage level”
that takes place during sample preparation [27]. Various
0 0.5 1 1.5 2 2.5 0 0.12 0.04 0.9 0.781.01 0 0 0.56 0.14 1.61 0.58 0.11 0.06 0.08 2.34 0.42 0.46 0.11 0.89 (%) Day 1 Day 1 Day 10 Day 10 Et ha n ol 2-M et hy l b ut anal E th ylb ut yl keto ne L imo nene 2-E th yl hexa no l B enzaldeh yde Phen yl acet aldeh yde B enzy l alco ho l (%) Day 1 Day 10 0 10 20 30 40 50 60 70 80 90 83.82 10.7 77.46 13.73 3-O ct an ol 3-O ct an on e Day 1 Day 10 (2 E)-O ct eno l (E ,E )-𝛼-F ar nes ene
Figure 3: Comparison of the volatile fingerprints of Agaricus bisporus mushrooms. Day 1: fresh samples. Day 10: samples from a 10-day storage period in refrigerator (+6∘C). Data are expressed as FID peak area % and are relative to different batches of samples (𝑛 = 3), each analyzed in triplicate (𝑖 = 3).
depending on the extraction methodology used (e.g., cut versus homogenized). It seems very likely that linoleic acid and enzymes are “stored” in different cell compartments of the mushroom, and they come in contact after damaging the
tissues [26]. Also, the production of 1-octen-3-ol and related
compounds seems to be hindered by mushrooms processing
such as irradiation [14]. The latter is a technique used for
destroying microorganisms and insects present in food or for improving its functional properties. Although other sophis-ticated techniques are commonly used for determination of shelf life or evaluation of storage conditions, the findings shown in this study demonstrate that SPME-GC-MS is a valid
and feasible technique as well, to reach this aim [30].
4. Conclusions
Ten different varieties of mushrooms from the wild, which appear to be underinvestigated, have been analyzed for the determination of their volatile fingerprints by means of SPME-GC-MS. Considerations were given about the relationships of the chemical composition and organoleptic properties. Furthermore, a quantitative SPME method has been applied to the analysis of volatiles released by the cultivated mushroom A. bisporus. Once again, eight-carbon molecules have demonstrated to be key compounds in these organisms’ volatile fraction. Their formation seems to involve a unique fungal biochemical pathway, reported in literature as strictly connected to lipid and fatty acid metabolism. In this context, the present study aimed to give a contribution, from the chemical point of view, to understand the highly specific biological systems of mushrooms. Biochemical “traceability” becomes very relevant when considering the fact that A.
bisporus cultivated mushrooms are a highly perishable food;
therefore, knowledge of storage modifications can improve the technology for preserving their sensory and texture qualities over time.
It is worthwhile pointing out that A. bisporus is the most common mushroom that can be found in the vegetable counter of a supermarket. For this reason, it seems useful to exploit the potential of SPME to detect which kind of biochemical modifications occur in the mushrooms, after harvesting and until consumption.
Conflict of Interests
The authors declare that there is no conflict of interests regarding the publication of this paper.
References
[1] V. Loria-Kohen, T. Lourenc¸o-Nogueira, I. Espinosa-Salinas, F. R. Mar´ın, C. Soler-Rivas, and A. R. de Molina, “Nutritional and functional properties of edible mushrooms: a food with promis-ing health claims,” Journal of Pharmacy and Nutrition Sciences, vol. 4, no. 3, pp. 187–198, 2014.
[2] N. Yang, X. Tong, Y. Xiang, Y. Zhang, H. Sun, and D.-C. Wang, “Crystallization and preliminary crystallographic studies of the recombinant antitumour lectin from the edible mushroom Agrocybe aegerita,” Biochimica et Biophysica Acta, vol. 1751, no. 2, pp. 209–212, 2005.
[3] M. Zhang, S. W. Cui, P. C. K. Cheung, and Q. Wang, “Antitumor polysaccharides from mushrooms: a review on their isolation process, structural characteristics and antitumor activity,” Trends in Food Science & Technology, vol. 18, no. 1, pp. 4–19, 2007.
[4] S. Fatmawati, R. Kondo, and K. Shimizu, “Structure-activity relationships of lanostane-type triterpenoids from Ganoderma lingzhi as 𝛼-glucosidase inhibitors,” Bioorganic & Medicinal Chemistry Letters, vol. 23, no. 21, pp. 5900–5903, 2013. [5] R. B. Beelman, D. J. Royse, and N. Chikthimmah, “Bioactive
components in button mushroom Agaricus bisporus (J. Lge) Imbach (Agaricomycetideae) of nutritional, medicinal, and bio-logical importance,” International Journal of Medicinal Mush-rooms, vol. 5, no. 4, pp. 321–337, 2003.
[6] E. Combet, J. Henderson, D. C. Eastwood, and K. S. Burton, “Eight-carbon volatiles in mushrooms and fungi: properties, analysis, and biosynthesis,” Mycoscience, vol. 47, no. 6, pp. 317– 326, 2006.
[7] R. Splivallo, S. Ottonello, A. Mello, and P. Karlovsky, “Truffle volatiles: from chemical ecology to aroma biosynthesis,” New Phytologist, vol. 189, no. 3, pp. 688–699, 2011.
[8] R. Zheng, S. Jie, D. Hanchuan, and W. Moucheng, “Charac-terization and immunomodulating activities of polysaccharide from Lentinus edodes,” International Immunopharmacology, vol. 5, no. 5, pp. 811–820, 2005.
[9] P. Dinesh Babu and R. S. Subhasree, “The sacred mushroom ‘Reishi’—a review,” The American-Eurasian Journal of Botany, vol. 1, no. 3, pp. 107–110, 2008.
[10] A. Petrova, K. Alipieva, E. Kostadinova et al., “GC-MS studies of the chemical composition of two inedible mushrooms of the genus Agaricus,” Chemistry Central Journal, vol. 1, no. 1, article 33, 2007.
[11] K. M. Kim, J. A. Ko, J. S. Lee, H. J. Park, and M. A. Hanna, “Effect of modified atmosphere packaging on the shelf life of coated, whole and sliced mushrooms,” LWT—Food Science and Technology, vol. 39, no. 4, pp. 364–371, 2006.
[12] C. Guillaume, I. Schwab, E. Gastaldi, and N. Gontard, “Biobased packaging for improving preservation of fresh common mush-rooms (Agaricus bisporus L.),” Innovative Food Science and Emerging Technologies, vol. 11, no. 4, pp. 690–696, 2010. [13] M. Taghizadeh, A. Gowen, P. Ward, and C. P. O’Donnell, “Use
of hyperspectral imaging for evaluation of the shelf-life of fresh white button mushrooms (Agaricus bisporus) stored in different packaging films,” Innovative Food Science and Emerging Tech-nologies, vol. 11, no. 3, pp. 423–431, 2010.
[14] K. Akram and J.-H. Kwon, “Food irradiation for mushrooms: a review,” Journal of the Korean Society for Applied Biological Chemistry, vol. 53, no. 3, pp. 257–265, 2010.
[15] R. Costa, “Newly introduced sample preparation techniques: towards miniaturization,” Critical Reviews in Analytical Chem-istry, vol. 44, no. 4, pp. 299–310, 2014.
[16] Supelco Bulletin, A Practical Guide to Quantitation with Solid Phase Microextraction, vol. 929, 2011.
[17] FFNSC 2—Flavour and Fragrance Natural and Synthetic Com-pounds, Shimadzu Europe, 2012.
[18] R. P. Adams, Identification of Essential Oil Components by Gas Chromatography/Mass Spectrometry, Allured Publishing Corporation, Carol Stream, Ill, USA, 4th edition, 2007. [19] NIST Chemistry WebBook, 2014,
http://webbook.nist.gov/chem-istry.
[20] D. Joulain and W. A. K¨onig, The Atlas of Spectral Data of Ses-quiterpene Hydrocarbons, E.B. Verlag, Hamburg, Germany, 1998.
[21] L. La Chiusa, Il grande libro dei funghi d’Italia e d’Europa, De Vecchi Editore, Firenze, Italy, 2008.
[22] T. Acree and H. Arn, Flavornet and Human Odor Space—Gas Chromatography-Olfactometry (GCO) of Natural Products, 2014,
http://www.flavornet.org/.
[23] R. M. Cenci and F. Sena, Eds., Elementi chimici nei funghi superi-ori, European Commission Joint Research Centre Scientific and Technical Reports, European Union, 2010.
[24] L. Mondello, R. Costa, P. Q. Tranchida et al., “Determination of flavor components in Sicilian goat cheese by automated HS-SPME-GC,” Flavour and Fragrance Journal, vol. 20, no. 6, pp. 659–665, 2005.
[25] C.-M. Wu and Z. Wang, “Volatile compounds in fresh and processed shiitake mushrooms (Lentinus edodes Sing.),” Food Science and Technology Research, vol. 6, no. 3, pp. 166–170, 2000. [26] R. Costa, L. Tedone, S. de Grazia, P. Dugo, and L. Mondello, “Multiple headspace-solid-phase microextraction: an applica-tion to quantificaapplica-tion of mushroom volatiles,” Analytica Chim-ica Acta, vol. 770, pp. 1–6, 2013.
[27] E. Combet, J. Henderson, D. C. Eastwood, and K. S. Burton, “Influence of sporophore development, damage, storage, and tissue specificity on the enzymic formation of volatiles in mushrooms (Agaricus bisporus),” Journal of Agricultural and Food Chemistry, vol. 57, no. 9, pp. 3709–3717, 2009.
[28] T. Leguijt, D. Yuksel, R. van der Vuurst de Vries et al., “Flavor and texture of the common mushroom Agaricus bisporus,” in Mushroom Biology and Mushroom Products, D. J. Royse, Ed., pp. 515–523, Pennsylvania State University, State College, Pa, USA, 1996.
[29] M. Wurzenberger and W. Grosch, “The formation of 1-octen-3-ol from the 10-hydroperoxide isomer of linoleic acid by a hydroperoxide lyase in mushrooms (Psalliota bispora),” Biochimica et Biophysica Acta—Lipids and Lipid Metabolism, vol. 794, no. 1, pp. 25–30, 1984.
[30] G. Pennazza, C. Fanali, M. Santonico et al., “Electronic nose and GC-MS analysis of volatile compounds in Tuber magnatum Pico: evaluation of different storage conditions,” Food Chem-istry, vol. 136, no. 12, pp. 668–674, 2013.
Submit your manuscripts at
http://www.hindawi.com
Hindawi Publishing Corporation
http://www.hindawi.com Volume 2014 Inorganic Chemistry
International Journal of
Hindawi Publishing Corporation
http://www.hindawi.com Volume 2014
Photoenergy
Hindawi Publishing Corporation
http://www.hindawi.com Volume 2014
Carbohydrate
Chemistry
International Journal ofHindawi Publishing Corporation
http://www.hindawi.com Volume 2014
Journal of
Chemistry
Hindawi Publishing Corporation
http://www.hindawi.com Volume 2014
Physical Chemistry
Hindawi Publishing Corporation http://www.hindawi.com Analytical Methods in Chemistry Journal of Volume 2014 Bioinorganic Chemistry and Applications
Hindawi Publishing Corporation
http://www.hindawi.com Volume 2014
Spectroscopy
International Journal ofHindawi Publishing Corporation
http://www.hindawi.com Volume 2014
The Scientific
World Journal
Hindawi Publishing Corporation
http://www.hindawi.com Volume 2014
Medicinal Chemistry Hindawi Publishing Corporation
http://www.hindawi.com Volume 2014
Chromatography Research International
Hindawi Publishing Corporation
http://www.hindawi.com Volume 2014
Applied ChemistryJournal of
Hindawi Publishing Corporation
http://www.hindawi.com Volume 2014
Hindawi Publishing Corporation
http://www.hindawi.com Volume 2014
Theoretical Chemistry
Journal of Hindawi Publishing Corporation
http://www.hindawi.com Volume 2014 Journal of
Spectroscopy
Analytical Chemistry
Hindawi Publishing Corporation
http://www.hindawi.com Volume 2014
Journal of Hindawi Publishing Corporation
http://www.hindawi.com Volume 2014 Quantum Chemistry
Hindawi Publishing Corporation
http://www.hindawi.com Volume 2014 International
Electrochemistry
International Journal ofHindawi Publishing Corporation
http://www.hindawi.com Volume 2014
Hindawi Publishing Corporation
http://www.hindawi.com Volume 2014