UNIVERSITÀ DEGLI STUDI DI CATANIA
INTERNATIONAL PhD
IN MICROBIOLOGICAL AND BIOCHEMICAL
SCIENCES
XXVI CICLE
Dr. Roberta Bonfanti
In vitro studies on new therapeutic approaches for
human thyroid cancers
Coordinator:
Prof. Adriana Garozzo
Tutor:
…ai miei Genitori,
per il supporto e la collaborazione donatomi con dedizione
affetto e pazienza in tutti i miei anni di formazione
1
ABSTRACT
Thyroid cancer is the most prevalent endocrine malignancy, and its incidence has been increasing. It has been reported that Type I receptor for transferrin (TfR1/CD71) is expressed on malignant cells at levels several fold higher than those on normal cells and its expression can be correlated with tumor stage or cancer progression. In previous studies, an aberrant expression of this receptor in thyroid carcinomas was found [Magro et al., 2011].
The aim of the study was to assess the expression of TfR1 in two cancer cell lines, FTC-133 and 8305C, as representative of follicular and anaplastic thyroid human cancer, respectively. The effects of down-regulation of endogenous TfR1 following transfection with the siRNA oligonucleotide, the changes in cell growth and the activation of Erk1/Erk2 pathway were also evaluated. The correlation between
apoptosis and UVA induced ultra-weak photon emission (Delayed Luminescence, DL) from tumor thyroid cell lines was investigated. In particular, it has been studied the effects of Berberine, an alkaloid that has been reported to have anticancer activities, on FTC-133 and 8305C cancer cell lines.
Our results showed that TfR1 appeared expressed at high levels in both thyroid cancer cell lines, even if it was more evident in the anaplastic ones. TfR1 was prevalently localized in the cytosol and in the mitochondria in the thyroid follicular cell lines, whether in the anaplastic cancer cell lines it was also localized into the nuclear compartments. In parallel, an activation of Erk1/Erk2 pathway in the both
2
cell lines was observed. Our findings indicate that TfR1 plays a fundamental role in thyroid cancer progression promoting cell signaling probably thought Erk1/Erk2
pathway, suggesting also that it might represent an important target for thyroid cancer therapy. The results show that Berberine is able to arrest cell cycle and activate apoptotic pathway as shown in both cell lines by DNA fragmentation, Caspase-3 cleavage, p53 and p27 protein overexpression. In parallel, changes in DL spectral components after Berberine treatment support the hypothesis that DL from human cells originates mainly from mitochondria, since Berberine acts especially at the mitochondrial level. In addition the strong decrease of DL blue component for both cell lines may be a hallmark of induced apoptosis, while different response in the red spectral range may be ascribed to a different iron homeostasis in the cell lines.
In conclusion, the silencing of TfR1 and the Berberine may represent a novel anticancer treatment of poorly differentiated or anaplastic thyroid cancers.
3
General Section
4
ETIOPATHOLOGY OF THYROID
CANCERS
Thyroid cancer is a common endocrine malignancy that has rapidly increased in global incidence in recent decades [Jemal et al., 2011], and is classified into differentiated and undifferentiated thyroid cancer. The former consists of papillary thyroid cancer (PTC) and follicular thyroid cancer (FTC), which account for the vast majority of thyroid cancers [Xing, 2013]. Although the death rate of thyroid cancer is relatively low and the prognosis is good, the rate of disease recurrence or persistence is high and they are risky to develop into anaplastic thyroid cancer (ATC), which is the ultimate undifferentiated thyroid cancer with an inexorable fatal outcome [Xing, 2013; Yang et al., 2013].
Thyroid carcinomas can be sub-classified according to their histological and clinical features, such as cellular origins or prognosis [Kondo et al., 2006], by using TNM system [Shaha et al., 2007; Bischoff et al., 2013]. On the basis of these systems, 80 to 85 percent of patients are classified as being at low risk for death from thyroid carcinoma. Some patients have a higher risk of recurrence, even if their risk of death is low. This group includes younger patients (<16 years old) [Schlumberger et al., 1998] and older patients (>45 years old), those with certain histologic subtypes (among papillary carcinomas, the tall-cell, columnar-cell, and diffuse sclerosing variants, and among follicular carcinomas, the widely invasive and poorly
5
differentiated subtypes [Schlumberger et al., 1998] and Hürthle-cell carcinomas), and those with large tumors, which extend beyond the thyroid capsule, or lymph-node metastases. Most differentiated thyroid carcinomas present as asymptomatic thyroid nodules, but the first sign of the disease is occasionally lymph-node metastases or in rare cases lung or bone metastases. Hoarseness, dysphagia, cough, and dyspnea suggest advanced disease.
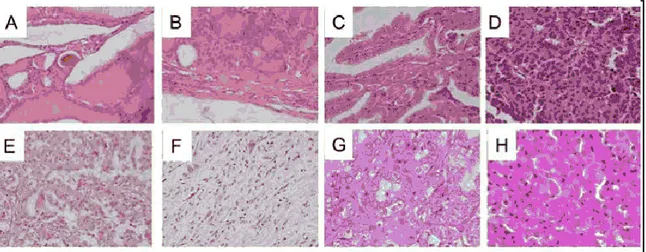
Thyroid adenomas represent benign epithelial tumours in which the cells are derived from the follicular epithelium and form recognizable follicular structures composed mostly of terminally differentiated thyrocytes (Fig. 1).
Figure 1: Istotypes of human thyroid cancer. A, Normal Thyroid. B, Adenoma. C, Classical Papillary Thyroid Carcinoma. D, Follicular Thyroid Carcinoma. E, Poorly Differentiated Thyroid Carcinoma. F, Anaplastic Thyroid Carcinoma; G, Typical PTC; H, Hurthle-cell [Viglietto et al., 2011].
The most common forms of thyroid carcinoma derive either from thyroid follicular epithelial cells or from C cells [Sherman, 2003]. The former include well differentiated carcinoma (WDTC), divided into (PTC) and follicular thyroid
6
carcinoma (FTC), poorly differentiated carcinoma (PDTC) and anaplastic thyroid carcinoma (ATC)[De Lellis et al., 2004].
PTC is the most frequent type of thyroid malignancy, and accounts for approximately 80-85% of all cases, FTC accounts for approximately 10-15% of all thyroid tumors whereas PDTC and ATC are rare aggressive malignancies (2% of all thyroid cancer) that can develop either directly or from pre-existing well-differentiated PTC and FTC.
Thyroid cancer derived from para-follicular C cells, denoted Medullary Thyroid Carcinoma (MTC), presents a relatively rare malignancy (<5%). Most neoplasms derived from thyroid follicular epithelial cells are indolent tumours that can be effectively treated by surgical resection and/or radioactive-iodine administration. PTC and FTC are well-differentiated tumours with a fairly good prognosis and are generally curable [Sherman, 2003]. In contrast, PDTC and ATC are partially or completely undifferentiated formof thyroid cancers, have not a good prognosis. The most representative between the well-differentiated thyroid carcinomas are PTC and FTC, which are composed of differentiated follicular epithelial cells. In particular, PTC is the most common and relative indolent disease with presents a good prognosis. It might occur in several histologic subtypes, including classical form with papillary architecture, follicular variant, oncocytic variant (or Hurthle-cell variant), tall-Hurthle-cell variant or solid and cribriform types, each showing distinct patterns of growth and clinical behaviours [DeLellis et al., 2004]. PTC is characterized by distinctive features, as well as the presence of papillae (consisting
7
of a well-defined fibrovascular core surrounded by one or two layers of tumor cells), crowded nuclei with grooves and "ground glass" appearance, cytoplasmic pseudoinclusions caused by a redundant nuclear membrane, and Psammoma body (scarred and calcified remnants of infarcted papillae) (Fig. 1C and Fig. 1G). Follicles and colloid are typically absent in this thyroid carcinoma, even if approximately 10% of all PTC exist. In contrast, FTC is composed of well-differentiated follicular epithelial cells which lack the nuclear features of PTC (Fig. 1D). These tumors are encapsulated, and present invasion along the capsule or across vascular endothelium [De Lellis et al., 2004]. Although cytologic features do not reliably allow discriminate between benign and malignant follicular lesions FTC may be distinguished from benign adenoma on the basis of the presence of invasive foci determined at the histological level. At difference with PTC, where the lack of a pre-malignant precursor has hindered the identification of the key steps in malignant transformation. There are several variants of FTC which include oncocytic (Hurthle-cell) and clear-cell types. Specifically, Hurthle cell tumours are formed by cells containing numerous altered mitochondria, which confer the typicalb granular, eosinophilic appearance to their cytoplasm [Stojadinovic et al., 2001] (Fig. 1H).
PDTC shows loss of structural and functional differentiation, which implies they are intermediate between well-differentiated and undifferentiated thyroid carcinomas [DeLellis et al., 2004; Cornett et al., 2007]. Characteristically, these lesions show widely infiltrative growth, necrosis, vascular invasion and numerous mitotic cells
8
(Fig. 1E). Insular carcinomas are placed in this category. Typically, insular carcinoma is composed of small cells arranged in nests with numerous mitotic cells, necrosis, vascular invasion and infiltrative growth. ATC is composed, wholly or partially, of undifferentiated cells without the typical features of follicular-cell differentiation (Fig. 1F). ATC develops from more differentiated tumors as a result of one or more dedifferentiating steps. Accordingly, half patients with ATC have either a prior or coexistent differentiated carcinoma [De Lellis et al., 2004]. ATC is one of the most lethal and highly aggressive thyroid tumour, with a disease-specific mortality approaching 100% [Cornett et al., 2007]. ATC displays three main morphological patterns: squamoid, pleomorphic giant cells and spindle cells. Patients with anaplastic carcinoma present with extensive local invasion, and distant metastases are found at disease presentation in 15 to 50% of patients. There is currently no effective treatment for ATC and death usually occurs within 1 year of diagnosis.
Papillary thyroid cancer
Papillary thyroid cancer, is characterized by overlapping cell nuclei that have a ground-glass appearance and longitudinal grooves, with invaginations of cytoplasm into the nuclei. It develops from the follicular cells and grows slowly and is found more in younger people, mostly women. It is the most common type of thyroid cancer which accounts for 70 to 80 per cent of cases. It is usually found in one lobe; only 10% to 20% of papillary thyroid cancers appear in both lobes. This cancer
9
affects the cells that produce that thyroid hormone and It grows slowly. Papillary thyroid cancer is a differentiated thyroid cancer, meaning that the tumor looks similar to normal thyroid tissue under a microscope. Papillary microcarcinoma is a subset of papillary thyroid cancer defined as measuring less than or equal to 1 centimeters [Shaha et et al., 2007].
Follicular thyroid cancer
Follicular thyroid cancer is characterized by follicular differentiation but without the nuclear changes characteristic of papillary carcinoma. It develops from the follicular cells but usually grows quickly and found in young or middle-aged people. Follicular carcinomas are encapsulated, and invasion of the capsule and vessels is the key feature distinguishing follicular carcinomas from follicular adenomas. Two forms are recognized according to the pattern of invasion: minimally invasive and widely invasive carcinomas. Follicular thyroid carcinoma should be considered as a differential diagnosis for mandibular mass lesions [Kim et al., 2013]. This carcinoma is extremely rare and metastasizes most commonly to the lung and bone. Clinicians should consider thyroid carcinoma as an appropriate differential diagnosis for bilateral mandibular masses [Kim et al., 2013].
Papillary and follicular thyroid cancers make up about 90% of thyroid cancers [Cancer.Net Editorial Board, 10/2011]. The follicular and papillary types together can be classified as "differentiated thyroid cancer" [Nix et al., 2006]. [DTC], as they are often treated in the same way. Most differentiated thyroid cancers are cured
10
These types have a more favorable prognosis than the medullary and undifferentiated types [Shaha et al., 2007].
WDTCs are either papillary [PTC] or follicular [FTC]. These two types are characterized by specific histological features, and by the maintenance of some differentiating features [Kondo et al., 2006]. WDTCs have a favorable prognosis thanks to the efficacy of combined surgical and radioiodine-based therapy [Guarino et al., 2010].
Anaplastic thyroid cancer
Anaplastic thyroid carcinoma (ATC), a highly aggressive malignancy, has a poor prognosis, and the consensus on the most effective treatment is needed. Anaplastic lesions constitute fewer than 5% of thyroid cancers, they represent over half of thyroid cancer-related deaths [Sun et al., 2013].
Anaplastic thyroid carcinoma (ATC) accounts for 1.6%–5% of all thyroid cancers and is one of the most aggressive malignant tumors in humans. Only 20% of affected patients survive for 1 year after diagnosis, and the median survival duration is 3–9 months. Additionally, ATC is responsible for 14%–40% of thyroid carcinoma-related deaths [Derbel et al., 2011; Sugitani et al. 2012; Ito et al., 2012; Lim et al., 2012]. ATC patients are typically elderly, with most older than 60 years, and manifests as a rapidly enlarging anterior neck mass that is accompanied by dyspnea, dysphagia, and vocal cord paralysis. Furthermore, 20%–50% of patients
11
present with distant metastases, most often pulmonary [Segerhammar et al., 2012; Sherman et al., 2011; Sun et al., 2013].
12
INCIDENCE, EPIDEMIOLOGY, RISK
FACTORS AND TREATMENT OF
THYROID CANCERS
Thyroid cancer is the most common endocrine cancer (approximately 1.0%–1.5% of all new cancers diagnosed each year in the USA) [Curado et al., 2007], and its incidence has continuously increased in the last three decades all over the world. This trend is present on every continent except Africa [Pellegriti et al., 2013], where detection is possibly insufficient. The increasing incidence is indicated by the annual percent change (APC) that in the USA was 2.4% from 1980 to 1997 and 6.6% from 1997 to 2009 [Pellegriti et al., 2013]. Based on recent data, thyroid cancer is the fifth most common cancer in women [Jemal et al., 2010], and in Italy, it is the second most frequent cancer in women below 45 years of age [Dal Maso et al., 2011]. Only in few countries (Norvay, Sweden) thyroid cancer incidence is decreased [Kilfoy et al., 2009].
Genetic factors, environmental influences, and access to medical care can easily explain the high variability (up to nearly tenfold) in the thyroid cancer incidence by geographic area and ethnicity.
Recent reports indicated a similar age-specific trends by racial/ethnic groups. Although the lowest rates of thyroid cancer are observed in blacks, the greatest rate of papillary thyroid cancer acceleration occurs in black females [Aschebrook et al., 2013]. Male and female annual percent change was 6.3% and 7.1% for white
13
patients, 4.3% and 8.4% for black, 4.2% and 6.7% for Hispanic and 3.4% and 6.4% for Asian/PI (Pacific Islander) patients respectively [Aschebrook et al., 2013]. The continuously increasing rate of thyroid cancer is independent of the underlying incidence rates [Kilfoy et al., 2009].
The increase is nearly exclusively due to increases in the incidence of the papillary histotype, with no significant change for the follicular, medullary, or anaplastic histotypes (Fig. 2A) [Pellegriti et al., 2013].
The increase mainly regards small tumors, although large tumors have also increased [Enewold et al., 2009; Kent, et al., 2007]. In spite of the steadily increased incidence, thyroid cancer mortality is reported stable at approximately 0.5 cases per 100,000 persons [Davies et al., 2006].
Figure 2: Thyroid cancer Epidemiology. The trend in thyroid cancer incidence subdivided by histotype in the United States (A) and by gender in the North American population (B) [Aschebrook et al.2013; Pellegriti et al., 2013].
At variance with most tumors (including breast, colon-rectum, lung, and prostate cancer) whose mortality has decreased in the last two decades, thyroid cancer mortality rate is not decreased, but rather slightly increased. Indeed, the joint point
14
trend reported by SEER for the period 1988–2009 indicates a significant increase of thyroid cancer mortality (+0.8% annual percent change, APC), primarily in males (Fig. 2B). This increase in mortality rate occurred in spite of early diagnosis and better treatment of high risk thyroid cancers. The divergence between the sharp increase in incidence and mortality, therefore, is probably less relevant than first recognized also considering that the indolent behavior of most thyroid cancers would affect mortality only many years after the increase in incidence.
Several findings [Malandrino et al., 2013; Pellegriti et al., 2013] shown a high incidence of TC in volcanic areas in different parts of the world, suggesting also that the factors present in the volcanic environment may act as endocrine disruptors and carcinogens.
Figure 3: Thyroid cancer incidence in Sicily by sex (A-B) and age (B) [Pellegriti et., 2009].
In particular, it has been found in the Mt. Etna area and in the Catania province a higher incidence rate of thyroid cancers, than in other Sicilian provinces (Fig. 3A
15
and Fig.3B) and in other parts of Italy [Pellegriti et al., 2009; Malandrino et al., 2013].
Furthermore, it is also been suggested that demographic and orographic factors and the levels of some elements present in the water of Catania’s province might contribute to increase of incidence of thyroid tumors in this area.
Although specific risk factors for thyroid cancer in this volcanic environment are still unknown, identification of these factors could help to better understand the causes of the increasing thyroid cancer incidence in this area (Fig.4).
Figure 4: Contaminants measured in ground water sources and tap water in the provinces of Catania, Palermo, and Ragusa [Pellegriti et al.,2009; Dal Maso et al., 2010].
Well-differentiated thyroid carcinoma has a favorable prognosis with surgical and radioactive iodine therapy. Other thyroid malignancies such as poorly differentiated thyroid carcinomas and anaplastic thyroid carcinomas frequently metastasize, precluding patients from a curative resection. Therapeutic options for these patients include additional surgery for resectable lesions, external radiotherapy and chemotherapy. The result of this approach is usually disappointing and the use of
16
novel therapeutic approaches is needed. Poorly-differentiated thyroid carcinoma and anaplastic thyroid carcinoma, which are thought to be dedifferentiated forms of pre-existing differentiated tumors, do not respond well to medical and surgical treatment. There are several therapeutic methods, including surgery, radioactive iodine therapy, and thyroid stimulating hormone suppression by thyroid hormone replacement, for treating thyroid cancer. Most thyroid cancers are well differentiated types and can be cured with ease through surgery and radioactive iodine therapy. However, poorly differentiated or anaplastic thyroid cancer shows rapid progression and is difficult to cure.
17
MAPK PATHWAY AND THYROID
CANCER
The recent progression in understanding the molecular pathogenesis of thyroid cancer has shown great promise for developing more effective strategies for thyroid cancer treatment [Xing, 2012]. This has mainly resulted from expanded knowledge of genetic events occurring in thyroid cancer. Most of these events are closely bound up with aberrant signaling of Ras/Raf/MEK/Erk (MAPK) and phosphatidylinositol-3-kinase (PI3K)/Akt pathways, which play central roles in cell transformation, energy supply, cell cycle progression, survival, and metastasis, and therefore become essential pharmacological and therapeutic targets [Nikiforov et al., 2010]. In addition to targeted therapies, natural product drugs play a dominant role in pharmaceutical care in recent years.
MAPK pathways are evolutionarily conserved kinase modules that link extracellular signals to the machinery that controls fundamental cellular processes such as growth, proliferation, differentiation, migration and apoptosis. To date six distinct groups of MAPKs have been characterized in mammals; extracellular signal-regulated kinase Erk1/2, Erk3/4, Erk5, Erk7/8, Jun N-terminal kinase (JNK)1/2/3 and the
p38 isoforms a/b/g(Erk6)/d [Dhillon et al., 2007; Krens et al., 2006]. Abnormalities
in MAPK signalling impinge on most, if not all these processes, and play a critical role in the development and progression of cancer, including thyroid tumorigenesis
18
[Kondo et al., 2006; Xing 2013]; in fact, the activation of this pathway involves a wide range of secondary molecular alterations that synergize and amplify the oncogenic activity, as well as genome-wide hypermethylation and hypomethylation. Additionally, upregulation of various well-established oncogenic proteins can occur, including chemokines [Melillo et al., 2005; Oler et al., 2008], vascular endothelial growth factor A (VEGFA) [Jo et al., 2006], MET [Giordano et al., 2005; Kumagai et al., 2006], nuclear factor kappa B (NF-κB) [Palona et al., 2006 ], matrix metalloproteinases (MMPs) [Palona et al., 2006; Mesa et al., 2006; Xing, 2013], prohibitin [Franzoni et al.,2009], vimentin [ Watanabe et al., 2009], hypoxia-inducible factor 1α (HIF1α) [Zerilli et al., 2010], prokineticin 1 (PROK1; also
known as EG-VEGF) [Pasquali et al., 2011], transforming growth factor-β1
(TGFβ1) [Riesco et al., 2009; Nucera et al., 2010; Knauf et al., 2011]. These
proteins are all established players in human tumorigenesis through a variety of mechanisms that drive cancer cell proliferation, growth, migration and survival, as well as tumor angiogenesis, invasion and metastasis. Furthermore, many of these proteins are key constituents of the unique extracellular matrix (ECM) microenvironments that have been proposed to be important in the pathogenesis of thyroid cancer driven by oncoproteins [Nucera et al., 2011]. It is now clear that the ECM micro-environment does not only function as a structural support for the cellular elements of cancer, but it also has a profound impact on the behaviours of cancer cells, including their viability, proliferation, adhesion and motility. Thyroid cancer cells and stromal cells, such as fibroblasts and macrophages, produce
19
proteins that form paracrine and autocrine signalling loops, including integrins and non-integrin cell-membrane receptors, matrix proteins, cytokines, VEGFA and MMPs, which in turn activate signalling in thyroid cancer cells and promote tumour progression and metastasis[Nucera et al., 2010; Nucera et al., 2011]. Cytokines can create an inflammatory microenvironment that may produce reactive oxygen species and oxidative stress, which may in turn stimulate the MAPK pathway and augment thyroid tumorigenesis [Xing, 2012]. Thus, secondary molecular alterations in the tumor ECM microenvironment, triggered by the aberrant signalling of the MAPK pathway, have an important role in the pathogenesis of thyroid cancer. In particular, the Erk pathway is deregulated in approximately, one-third of all human cancers. In the Erk MAPK module, Erk (Erk1 and Erk2) is activated upon
phosphorylation byMEK (MEK1 and MEK2), which is itself activated when
phosphorylated by Raf (Raf-1, B-Raf and A-Raf).
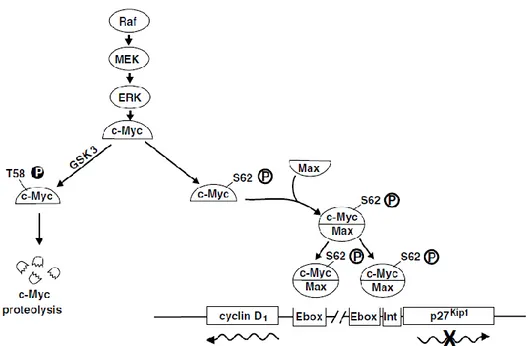
Erk signalling is activated by numerous extracellular signals. The pathway whereby growth factors and mitogens activate Erk signalling is of particular relevance to cancer. Most cancer-associated lesions that lead to constitutive activation of Erk signalling occur at these early steps of the pathway (Fig. 5). However, there is also amplification or deregulation of its nuclear transcription factor targets, most notably c-Myc and AP-1, which induce the expression of multiple genes required for survival and proliferation [Wang et al., 2012]. Activation of these pathways, often in close connection and cooperation, constitute the primary oncogenic mechanism that promotes the development and progression of thyroid cancer [Neuzillet C et al.,
20
2013] In particular, the proto-oncogene c-Myc is an important nuclear factor, which regulates the expression of several genes required for iron-dependent cellular processes, such as energy metabolism and mitochondrial homeostasis [O'Donnell et al., 2006], and a distint set of target genes associated with cell proliferation or apoptosis, [Nasi et al., 2001; Amati, 2001] c-Myc also participates directly in the transcriptional induction of the Cyclin D1 gene [O'Donnell et al., 2006]. Therefore
sustained Erk signalling not only promotes to accumulation of genes required for cell cycle entry, such as Cyclin D1, it can also repress the expression of genes which
inhibit proliferation [Yamamoto et al., 2006]. In addition, high levels of Erk signalling can lead to cell-cycle arrest by inducing the expression of CDK-inhibitor protein as well as p21 and p27 [Dhillon et al., 2007; Mirza et al., 2004].
Figure 5: Raf/MEK/Erk pathway and regulation of the transcription of c-Myc responsive genes [Chang F. et al., 2003]
21
INVOLMENT OF TRANSFERRIN-1
RECEPTOR IN CANCERS
Transferrin receptor (TfR1), CD71 or Transferrin Receptor 1, is the major mediator of iron uptake by cells [Daniels et al., 2006]. It is a transmembrane, disulfide-linked dimer of two identical subunits that binds and internalizes diferric transferrin, thereby delivering iron to the cell cytosol [Héadi et al., 2004]. When a cell needs iron, TfR1 expression is increased to facilitate iron uptake [Aisen, 2004].
Figure 6: Crystal structure of of the TfR exocytic recombinant human TfR at 3.2Å resolution [Aisen, 2004]
22
It is ubiquitously expressed on cells that require large amounts of iron, such as placental trophoblasts, and maturing erythroid cells that require iron for heme synthesis.
TfR1 expression has also been observed on non-proliferating cells, including those of the vascular endothelium of brain capillaries, endocrine pancreas, seminiferous tubules of the testes, cells of the pituitary, luminal membranes of the breast, hepatocytes, Kupffer cells of the liver, and tubules of the kidney. Since the major use of iron is for hemoglobin synthesis, about 80% of total TfR1/CD71 is on erythroid progenitor cells. The molecular mechanism underlying the regulation of TfR1 gene expression by iron has been generally accepted. The regulation is largely post-transcriptional and is mediated by specific mRNA protein interactions in the cytoplasm [Kwok et al., 2002]. The 3'-untranslated region of receptor mRNA contains a series of five hairpin stem-loop structures required for iron-dependent regulation. The stem-loop structures called iron-responsive elements (IREs) are recognized by trans-acting proteins, known as iron-regulatory proteins (IRPs), that control the rate of mRNA translation or stability [Kwok et al., 2002]. The sequences responsible for the destabilization of TfR1 mRNA are located in the 3’ region that contains five IREs [Guo et al., 1994]. In the setting of low cellular and cytosolic iron, the iron responsive element-binding protein (IRE-BP) binds to a 3′ regulatory untranslated region in TfR1 mRNA, increasing mRNA stability, and leading to increase transcription and greater receptor numbers Conversely, when intracellular
23
iron is elevated, iron interacts with the IRE-BP, markedly reducing the affinity of IRE-IRP for TfR1 mRNA [Koeller et al., 1991].
Figure 7: Schematic illustration of the IRP1 RNA-binding activity [Kwok et al., 2002]
The net result in iron replete conditions is the inhibition of further iron uptake and promotion of iron storage by the cell. Without bound IRE-BP, the stability of TfR1 mRNA is greatly decreased, leading to a reduction in receptor numbers [Eisenstein et al., 2003].
The signals other than iron levels, such as nitric oxide and oxidative stress, can also regulate IRPs and modulate cellular iron metabolism [Chen et al., 2001].
The expression of TfR1s is also regulated through the status of cellular proliferation [Kwok et al., 2002; Wang et al., 2011; Wang et al., 2013]. Generally, cells undergoing multiplication markedly increase their receptor numbers, while
non-24
replicating cells have a stable iron balance. Cell proliferation-associated induction of TfR1 express could be mediated by mitogens, which modulate various protein kinase activities, through either the activation of gene transcription or the stabilization of mRNA [Daniels et al., 2006].
TfR1 is also expressed on several types of non dividing cells, such as reticulocytes, trophoblasts, hepatocytes, and tissue macrophages, suggesting that the relationship between TfR1 expression and cell activation is not a generalized phenomenon. It has been demonstrated that TfR1 expression is increased in dividing cells (Jones et al., 2006), and its overexpression has been reported in different types of cancers, such as glioma, pancreatic, colon cancers and thyroid cancer [Szekeres et al., 2002; Ryschich et al. 2004; Prutki et al., 2006; Magro et al., 2011]. CD71 can be released into the circulation as a proteolytic fragment of its extracellular domain, and the direct measurement of CD71 serum levels may be of diagnostic value in a variety of hematologic malignant neoplasms [Boult et al., 2008]. However, although elevated serum levels of CD71 have been demonstrated in patients with chronic lymphocytic leukemia and non-Hodgkin lymphoma, levels seem to correlate more closely with clinical stage and disease burden than with histologic grade of tumor [Wu et al., 2006]. These tumors typically show a high membrane density of the TfR1, which is essential for the transport of iron into actively dividing cells [O'Donnell et al., 2006] and suggest that TfR1 expression is increased on circulating tumor cells, tumor precursor cells, or cells that have been activated during tumorigenesis.
25
Experimental Section
26
AIM
OF
THE
WORK
Early diagnosis of cancer is of fundamental importance in determining appropriate therapeutic treatments.
Thyrocyte-derived tumors are very interesting for cancer biology studies because from one cell type, at least five histologically characterized different benign and malignant tumor types can arise [Balboni et al., 1989]. They allow analysis of tumor properties and behavior provided that they have maintained properties of in vivo tumors and also in model tumors of the thyroid.
Several studies provided experimental support for anticancer therapies using as target TfR1 [van Staveren et al., 2007; Anabousi et al., 2006; Magro et al., 2011]. It has been reported that TfR1 is ia direct transcriptional target of the c-Myc proto-oncogene, one of the most frequently dysregulated proteins in human malignancies, both in vitro and in vivo models of B-cell lymphoma [O'Donnell et al., 2006]. In addition, TfR1 is a critical downstream target of c-Myc that is necessary for cellular proliferation and promotes tumorigenesis. TfR1 represents an important downstream effector of its transcription factors that promotes glioma proliferation and increases glioma-evoked neuronal death, activating MAP kinase pathway and Akt, and by inactivating p21/cdkn1a and retinoblastoma protein (pRB) [Thomson et al 2001; Chirasani et al., 2009]. Inactivation of these cell cycle regulators facilitated S-phase entry.
27
However, the role played by TfR1 overexpression in the different types of thyroid tumor is not well clarified. The accessibility of TfR1 as a membrane receptor has made it an attractive target for cancer therapy. Past therapeutic studies with anti-TfR1 antibodies have met with limited clinical success, perhaps due to the lack of appropriate phenotyping for TfR1. Furthermore, a monoclonal TfR1 antibody, A24, was shown to induce apoptosis in T lymphocytes from patients with CD71-positive T-cell leukemias [Dela Cruz et al., 2002; Chaston et al., 2003]. These studies are consistent with microarray data where it was identified apoptotic genes upregulated in response to TfR1 inhibition in P493-6 B lymphocytes.
Future efforts to delineate the molecular mechanisms underlying the cell cycle arrest, which occurs following TfR1 depletion may allow the development of other therapies that complement the interruption of iron uptake in the treatment of cancers [Debinski et al., 2002]. Other findings demonstrated that small interfering RNA (siRNA) is able to modulate cell growth, apoptosis, chemoresistance, and chemosensitivity [Kasibhatla et al., 2005], and may represents powerful genetic tool for sequence-specific inhibition of the target proteins or pathways involved in tumor growth eliminating problems of toxicity [Xing et al., 2003; Stenner et al., 2005]. Now a day growing interest has been shown in the possibility of using non-invasive diagnostic tool in clinical survey. In this respect detection of the ultraweak biophoton emission makes it possible to acquire immediate information on biological activities non –invasively [Takeda et al., 1998; Lanzanò et al., 2007]. DL, that is the prolonged (usually in a microsecond to second time scale) ultra-weak
28
emission of optical photons from a biological sample after the illumination source is switched off, has been investigated in order to discriminate between tumor and normal fibroblasts [Niggli et al., 2005; Musumeci et al., 2005a; Musumeci et al., 2005b; Kim et al., 2005], or to assess the pro-apoptotic capacity of combined cancer treatments [Baran et al., 2010].
Biomolecules inside cells can act as endogenous fluophores (autofluorescence) when excited by UV/Vis radiation of suitable wavelength. The majority of cell auto-fluorescence originates from mitochondria and lysosomes and changes occurring in the cell state during physiological and/or pathological processes result in modifications of the amount and distribution of endogenous fluorophores and chemical-physical properties of their microenvironment. Among the major molecules that have been identified to contribute in autofluorescence signal from biological tissue, nicotinamide adenine dinucleotide (NADH, free and bound form) emits in the blue region (444-460 nm), flavins and lipopigments emit in the yellow region (520-570 nm) and protoporphyrin emits in red region (610-740nm) of the spectrum.
The role of several natural biomarkers in cancer research has been widely studied [Yu et Heikal, 2009; A. Walsh et al., 2012; Kala et al., 2011; Croce et al., 2011; Zawacka-Pancau et al., 2007], also by demonstrating the mitochondrial origin of the signal [Mik et al., 2006; Mik et al., 2008; Harms et al., 2011]. As a matter of fact progress over the past few years has led to the recognition that, in addition to their established role in generating energy for the cell, mitochondria play a key role
29
into controlling life and death by releasing cytochrome c into the cytosol, thereby activating Caspases. With a few exceptions, mitochondria represent an essential component of many apoptotic pathways [Desagher et Martinou, 2000].
It has been reported that Berberine, an alkaloid extracted from rhizomes and roots of plants such as the Berberis, Coptis, and Hydrastis species extensively used in Chinese traditional medicine [Musumeci et al., 2007; Campisi et al., 2010], was able to block the cell cycle of a large variety of tumor cells activating also the apoptotic pathway. Several mechanisms involved in Berberine's antitumor activity have been identified, including cytochrome c release [Hwang et al., 2006; Lin et al., 2006], Caspase-3 cleavage, cell cycle arrest, DNA fragmentation [Hwang et al., 2006; Lin et al., 2006]. Furthermore, reported data in mouse melanoma cells showed that Berberine is selectively accumulated by mitochondria [Pereira et al., 2007].
Recently, the relationship between apoptosis and DL of leukemia Jurkat T-cells was investigated [Baran et al., 2010; Baran et al., 2012] under a variety of treatments, among them flavonoids that preferentially target malignant cells by inhibiting cell proliferation and inducing apoptosis. The role of mitochondrial respiratory Complex I was also pointed out.
In view of all these considerations, the aim of this research was to assess the localization and the expression of TfR1 in two cell lines, the human follicular (FTC-133) and the anaplastic (8305C) human thyroid cancer cell lines, as representatives of two aggressive types of thyroid cancer, poorly differentiated and
30
dedifferentiated, respectively. Since aberrant expression of TfR1/CD71 in thyroid carcinomas was identified as a novel potential diagnostic marker and therapeutic target (Magro et al., 2011), we also studied the effects of down-regulation of endogenous TfR1 following transfection with the siRNA oligonucleotide. Its effect on the activation of apoptotic pathway by testing Caspase-3 cleavage and DNA fragmentation, and on cell cycle progression, evaluating p53 and p27 expression, was also tested. Cell survival analysis was also determined by using MTT assay (Campisi et al., 2004). Furthermore, to verify if TfR1 is directly regulated by the Myc oncoprotein in thyroid-derived cell lines, we assessed the Erk pathway and c-Myc expression.
The correlation between apoptosis and UVA induced ultra-weak photon emission (DL) from tumor thyroid cell lines was also investigated. In particular, it has been studied the effects of Berberine on FTC-133 and 8305C cancer cell lines, in order to correlate biological observation with physical parameters. The effect of the alkaloid on the activation of apoptotic pathway by testing Caspase-3 cleavage and DNA fragmentation, and on cell cycle progression, evaluating p53 and p27, was also evaluated. In parallel, DL spectroscopy changes before and after the treatment were evaluated and compared.
31
MATERIALS
AND
METHODS
MATERIALS
Follicolar (FTC-133) and Anaplastic (8305C) human thyroid cancer cell lines were purchased from Cell Bank Interlab Cell Line Collection (Genova, Italy). Dulbecco’s Modified Eagle medium (DMEM) and Minimum Essential Medium (MEM) containing 2 mM GlutaMAX (GIBCO), Ham’s F12 (GIBCO), Non-essential amino acids, heat inactivated-Foetal Bovine Serum (FBS, GIBCO), Normal Goat Serum (NGS, GIBCO), Streptomycin and penicillin antibiotics, 0.05% Trypsin-EDTA solution, mouse monoclonal antibody against TfR1, BLOCK-iTTM Transfection Kit, OptiMEM solution, Taq DNA polymerase were from Invitrogen (Milano, Italia). Chemically synthesized human transferrin receptor siRNA oligos and negative control scrambled siRNAs were from Ambion (Austin, TX). Qiagen kit, Aprotinin, leupeptin, pepstatin, Lab-Tek™ Chamber Slides II, 3(4,5-dimethyl-thiazol-2-yl)2,5-diphenyl-tetrazolium bromide salts (MTT), Berberine hydrochloride, Syber Green II, and other analytical chemicals were obtained from Sigma-Aldrich (Milano, Italy). Mouse monoclonal antibody against Caspase-3 was from Becton-Dickinson (Milan, Italy). Mouse monoclonal antibodies against p27, against c-Myc and β-tubulin were from Chemicon (Prodotti Gianni, Milan). Mouse monoclonal antibodies against p53, against Erk1/2 and against Cyclin D1 were from Santa
32
antibody, fluorescein isothiocyanate (FITC)-conjugated anti-mouse IgG polyclonal antibody, tetrarhodamine isothiocyanate (TRITC)-conjugated anti-mouse IgG polyclonal antibody were from Chemicon (Prodotti Gianni, Milan, Italy). ApoAlert DNA fragmentation assay kit was from Clontech (Milan, Italy). Horseradish peroxidase (HRP)-conjugated anti-mouse IgG, and Taq DNA polymerase were from Amersham Pharmacia Biotech (Milan, Italy). Mouse monoclonal antibodies against nestin and β-tubulin III, and SantaCruz ECL (Enhanced ChemiLuminescence) developing system for immunoblots were from Santa Cruz Biotechnology Inc. (Santa Cruz, CA, USA).
METHODS
Cell cultures
FTC-133 and 8305C cell lines were suspended in appropriate culture medium and plated in flasks at a final density of 2x10⁶ cells or in Lab-Tek™ Chamber Slides II at a final density 0.5x10⁵ cells/well. In particular, FTC-133 cell lines was suspended in DMEM containing 2 mM Gluta-MAX, 10% FBS, streptomycin (50 μg/mL), penicillin (50 U/mL). 8305C cell lines was suspended in MEM containing 2 mM Gluta-MAX, 10% FBS, streptomycin (50 μg/mL), penicillin (50 U/mL), and 1% non-essential amino acids. Cells were incubated at 37°C in a humidified 5% CO2–
95% air mixture. The medium was replaced every 2 or 3 days. When the cultures were about 85-90% confluent, cells were suspended by using 0.05% trypsin and 0.53 mM EDTA solution for 5 min at 37°C in humidified 5% CO2–95% air mixture.
33
Trypsinization was stopped by adding to the cell cultures 20% FBS. Cells were then centrifuged at 200 x g for 10 min and the obtained pellets were suspended in the appropriate culture medium, plated in flasks or in Lab-Tek™ Chamber Slides II at 1:4 density ratio. Finally, cell culture were incubated at 37°C in humidified 5% CO2–95% air mixture.
Cell Transfection
Chemically synthesized human transferrin receptor siRNA oligos and negative control scrambled siRNAs were used. The target sequence for TfR1 siRNA was 5’AAC TTC AAG GTT TCT GCC AGC ‘3. FTC-133 and 8305C cell lines were set up 20x 104 cells/well of a 24 multiwell flat-bottomed 200-µl microplates without antibiotics. Transfections were performed at 35-50% of confluence by using Block-it transfection kBlock-it as directed by the manufacturer’instruction. Different concentrations (2, 4, 6; 8, 10 nM) of scrambled and siRNA-TfR1 for 24, 48, and 72 h, were used. After transfection the culture medium was replaced with OPTI-MEM (Invitrogen) supplemented with 1% (vol/vol) FBS. Cells were then incubated at 37°C in a humidified 5% CO2–95% air mixture for 10-12 h. At the end of treatment
time, the media was replaced with the medium culture used.
Semiquantitative RT-PCR
Total RNA was isolated from scrambled and siRNA-TfR1 transfected FTC-133 and 8305C cell lines using Qiagen kit. Five micrograms of RNA were
reverse-34
transcribed at 50°C for 1 h in a 20 ml reaction mixture using the one-stem Thermoscript RT-PCR kit according to the manufacturer's instructions. PCR mixtures (100 µl) contained 5 ml of cDNA, 1× PCR buffer, 1.5 mM MgCl2, 0.2
mM dNTPs, 1.25 units of Taq DNA polymerase, and 0.2 mM of specific primers for TfR1. Glyceraldehyde-3-phosphate dehydrogenase-1 (GAPDH-1) used for internal reaction control, was reverse-transcribed with the following primers: sense primer ACTCCCATTCCTCCACCTTT-3’, and antisense primer 5’-TTACTCCTTGGAGGCCATGT-3’. For each RT-PCR, a sample without reverse transcriptase was processed and used as a negative control. PCR reactions were carried out with conditions of one cycle at 95 °C (3 min), 25 or 35 cycles each of 95 °C for 1 min, appropriate annealing temperature for 1 min, 72 °C for 1 min, and finally one extension cycle of 72°C for 7 min with an AmpliTaq PCR (Perkin-Elmer Cetus Instruments, Norwalk, CT). RT-PCR products were separated on 2% agarose gel, stained with Sybr Green II, and quantified by densitometric analysis with an AlphaImager 1200 System (Alpha Innotech, San Leandro, CA) [Campisi et al., 2004].
Berberine hydrochloride treatment
FTC-133 and 8305C cell lines is plated on at a final density of 1x10⁴ cells/well, and fed in fresh complete medium. In preliminary experiments, we exposed the both cultures both in absence or in presence of different concentrations of berberine hydrochloride (5, 10, 25, 50, 100 μg/mL) for 12, 24, 48 h, in order to establish the
35
optimal concentrations and their exposure times to the alkaloid. For this purpose, MTT test and morphological characterization were utilized [Campisi et al., 2003].
MTT Bioassay
To monitor cell viability, scrambled and siRNA-TfR1 transfected or untreated and Berberine hydrochloride treated FTC-133 and 8305C cell culture were set up 60x 104 cells/well of a 96-multiwell flat-bottomed 200-µL microplates (Campisi et al., 2003). Cells were incubated at 37°C in a humidified 5% CO2–95% air mixture. At the end of
treatment time, 20 µl 3(4,5-dimethyl-thiazol-2-yl)2,5-diphenyl-tetrazolium bromide (MTT, Sigma- Aldrich, Milan, Italy), 0.5%, in phosphate buffer saline were added to each multiwell. After 1 h of incubation with the reagent, the supernatant was removed and replaced with 200 µL dimethyl sulfoxide. The optical density of each well sample was measured with a microplate spectrophotometer reader (Titertek Multiskan; Flow Laboratories, Helsinki, Finland) at 570 nm.
Immunocytochemistry
Expression of TfR1, scrambled and siRNA-TfR1 transfected FTC-133 and 8305C thyroid cancer cell lines was identified by immunocytochemical procedures [Campisi et al., 2003; Campisi et al 2012]. The cells were fixed by exposing to 4% paraformaldehyde in 0.1 M PBS for 30 minutes. The cells were successively incubated overnight in the primary antibody against TfR1 monoclonal antibody (1:1,000). Then, coverslips were incubated in secondary antibody, goat anti-mouse
36
antibody IgG Fluorescein Isothiocyanate (FITC, 1:100) to visualize TfR1. Coverslips were washed, mounted in PBS/glycerol (50:50), placed on glass microscope slides and analyzed on a Leica fluorescent microscopy (Germany). No non-specific staining of FTC-133 and 8305C cell lines cultures was observed in control incubations in which the primary antibody was omitted.
Confocal Laser Scanning Microscopy analysis
To assess the localization and the expression of TfR1 on single cell some cultures after immunocytochemical procedures were used for Confocal Laser Scanning Microscopy (CLSM) analysis. The fluorescence emitted from the specimens was sent through a Leica AOTF mechanism (acoustic optical turnable filter) and pinhole to two different photomultiplier tubes (PMTs). Image outputs electronically generated by the same parameter settings (frame scanning, pinhole aperture, gain voltage, pixel and spatial resolution) were measured and compared for intensity (treated vs control) after nonspecific fluorescence subtraction. Sequential optical sections, obtained using the CLSM z-axis stepping capability, were combined to form an extended depth of focus image, and standard image processing was performed to enhance brightness and contrast, using Leica Confocal Software (version 2.0, build 0585).
37
Western Blot analysis
FTC-133 and 8305C thyroid cancer cell lines scrambled or siRNA-Tfr1 transfected or untreated or treated with 50 µg/mL for 24 h with Berberine hydrochloride were harvested in cold PBS, collected by centrifugation, and resuspended in a homogenizing buffer with 50 mM Tris-HCl (pH 6.8), 150 mM NaCl, 1 mM EDTA, 0.1 mM phenylmethylsulfonyl fluoride (PMSF; Sigma, Milan, Italy), and 10 µg/mL of aprotinin, leupeptin, and pepstatin and sonicated on ice [Campisi et al 2004; Campisi et al 2008; Campisi et al 2012]. Briefly, the protein concentration of the homogenates was then diluted to 1 mg/mL with reducing stop buffer (0.25M Tris-HCl, 5 mM EGTA, 25 mM dithiothreitol, 2% SDS, and 10% glycerol with bromophenol blue as the tracking dye) (Campisi et al., 2003; Campisi et al., 2004). Proteins were separated on 10% SDS–polyacrylamide gels and transferred to nitrocellulose membranes. Blots were blocked overnight at 4°C with 5% non-fat dry milk dissolved in 20 mM Tris–HCl, pH 7.4, 150 mM NaCl, 0.5% Tween 20. TfR1, Caspase-3, p53, p27, cyclin D1, Erk1/2, c-Myc and β-tubulin antigens were detected
by incubation for 1 h with mouse monoclonal antibody against TfR1(1:1,000 in PBS), or mouse monoclonal antibody against Caspase-3 (1:1,000 in PBS), or with mouse monoclonal antibody against p53 (1:1,000 in PBS), or mouse monoclonal antibody against p27, or mouse monoclonal antibody against cyclin D1 (1:1,000 in PBS), or mouse monoclonal antibody against c-Myc (1:500 in PBS),, or mouse monoclonal antibodies against Erk1 and Erk2 (1:1,000 in PBS), and monoclonal
38
visualized by chemiluminescence (ECL) kit after autoradiography film exposure. Blots were then scanned and quantified with an AlphaImager 1200 System (Alpha Innotech, San Leandro, CA). The expression of each protein was visualized by chemiluminescence (ECL) kit after autoradiography film exposure. Blots were then scanned and quantified with an AlphaImager 1200 System (Alpha Innotech, San Leandro, CA). Densitometric analysis was performed after normalization with anti-rabbit β-tubulin.
Terminal DeoxyNucleotidylTransferase DUTP nick End-Labeling (TUNEL
TEST)
The ApoAlert DNA fragmentation assay kit detecting nuclear DNA fragmentation, a hallmark of apoptosis, was used. The ApoAlert DNA fragmentation assay incorporates fluorescein-dUTP at the free 3’-hydroxyl ends of the fragmented DNA using TUNEL and was performed according to the user’s manual. FTC-133 and 8305C cell cultures, scrambled and siRNA-TfR1 transfected or untreated and 50 µg/mL Berberine hydrochloride for 24 h treated FTC-133 and 8305C cell cultures were made up according to the user’s manual. Cells were mounted and visualized directly by fluorescence microscopy (Leika, Germany) with either a propidium iodide (PI) filter alone or a FITC filter alone. According to the user’s manual, apoptotic cells appear green with the FITC filter alone while nonapoptotic cells appear red under the dual-pass FITC/PI filter set. We focused on 10 random microscopic fields for each dish. In each microscopic field, the number of apoptotic
39
cells is counted and this number is compared with the number of all non-apoptotic cells visualized in the same microscopic field. The ratio is expressed as a percentage.
Delayed luminescence spectroscopy
The DL measurement was performed on a drop from each cell sample (drop volume 20 l) at room temperature (20 ± 1ºC). After the Berberine hydrochloride treatment, cells were washed thoroughly with PBS and re-suspended in PBS at room temperature (20C) (cell concentration about 106 cells/ml) and immediately analyzed by DL spectroscopy. At the same time an identical aliquot of cells suffered the same procedure, without the addition of Berberine, in order to be considered as “control” sample. DL measurements were performed with the highly sensitive equipment, whose scheme is reported in Figure 8, able to detect single photons developed at the Laboratori Nazionali del Sud of the Istituto Nazionale di Fisica Nucleare [Tudisco et al. 2003, Tudisco et al. 2004], where cell samples were illuminated by a Nitrogen Laser beam (Laser Photonics LN 230C; wavelength 337 nm, pulse-width 5 ns, energy 100 ± 5 µJ/pulse). The detector for photoemission signals was a multi-alkali photomultiplier tube (Hamamatsu R-7602-1/Q) operating in single photon counting mode, with spectral range 400-800 nm. To reduce dark current, the photomultiplier was cooled down to -20 °C. The detected signals were acquired by a Multi-channel Scaler (Ortec MCS PCI) with a minimum dwell-time of 200 ns. An electronic control of the photomultiplier gate prevented the dimpling
40
of the PMT during sample irradiation, letting the photon counting start only a few microseconds after the switching off of the excitation pulse.
Figure 8: Scheme of the experimental equipment for Delayed Luminescence measurements
Photoemission was recorded between 10 s and 10 ms after laser-excitation. Spectra determinations were performed filtering the light emitted by the sample by using, due to the low level of the signal, two broad band (about 80 nm FWHM) Lot-Oriel interferential filters. More precisely, the Thermo–Lot-Oriel 57530, whose maximum transmittance is at wavelength 460 nm (Blue component), and the Thermo–Oriel 57610, whose maximum transmittance is at wavelength 650 nm (Red component), were used. So, on each drop of a cell sample three measurements were performed, corresponding to the total (VIS, 400-800 nm), blue (460 nm) and red
41
(650 nm) emission. DL measurements were repeated on at least 5 different drops from the same cell sample.
Raw data of each measurement were accumulated in the 50000 acquisition channels of the multi-channel scaler with a dwell time of 2 μs, since at the end of this interval the intensity of the emitted luminescence was comparable with the background value. The counts of 100 repetitions of the same run were added, with a laser repetition rate of 1 Hz. To reduce random noise, a standard smoothing procedure [Scordino et al., 1996] was used, by sampling the experimental points (channel values) in such a way that final data resulted equally spaced in a logarithmic time axis. The kinetics of DL intensity I(t), both for the spectral components (Blue and Red) and the total emission (VIS) showed a multimodal behavior and DL photoemission curves could be accorded to a suitable sum of exponential time decays. Such analysis lead to determine three regions for the time decay constants, namely the time intervals 10-100 s, 100 s - 1 ms and 1-10 ms), respectively. To facilitate comparison between different spectral DL components, which exhibited some significant differences in emission kinetics, the DL yield, that is the total number of photon emitted in the recording time interval, was calculated in this three time domains of the DL emission, corresponding to three main classes of light emitting states, DL1 (10-100 s), DL2 (100 s - 1 ms) and DL3 (1-10 ms) states, as
the integral of the data over the respective time domains. In order to make the comparison of the data from different samples independent of experimental parameters that can change from a run to the other, as for instance cell density,
42
dimensionless function were defined as the ratio of each spectral component (Blue or Red) to the total emission (VIS). Final data are reported as average value ± standard deviation of at least 15 different runs.
Statistical analysis
Data were statistically analysed using one-way analysis of variance (one-way ANOVA) followed by post hoc Holm–Sidak test to estimate significant differences among groups. Data were reported as mean ± S.D. of four experiments in duplicate, and differences between groups were considered to be significant at *p< 0.05.
43
RESULTS
TfR1 localization and expression in FTC-133 and 8305C human
thyroid cancer cell lines
The localization and expression of TfR1 in FTC-133 and 8305C human thyroid cancer cell lines were assessed by immunocytochemistry on single cells by using CLSM analysis and Western Blot analysis on total cellular lysate.
Figure 9 reports TfR1 localization and expression in both FTC-133 and 8305C cell lines observed on single cells by CLSM. In particular, TfR1 appeared localized in both cell lines in plasmatic membranes and cytosol, mitochondria, and nucleoli.
Figure 9: Immunocytochemistry of TfR1 localization and expression in FTC-133 and 8305C human cancer thyroid cell lines by CLSM analysis. Data were collected from 4 fields/coverslip of four experiments separated. Magnification is equal in all pictures. Scale bars = 50 µm.
44
It was expressed in 8305C at higher levels, than FTC-133 ones. The receptor appeared localized in nuclear compartment and cytosolic prolungaments of the both cell lines types (Fig. 9). No non-specific staining of FTC-133 and 8305C cells was observed in control incubations in which the primary antibody was omitted.
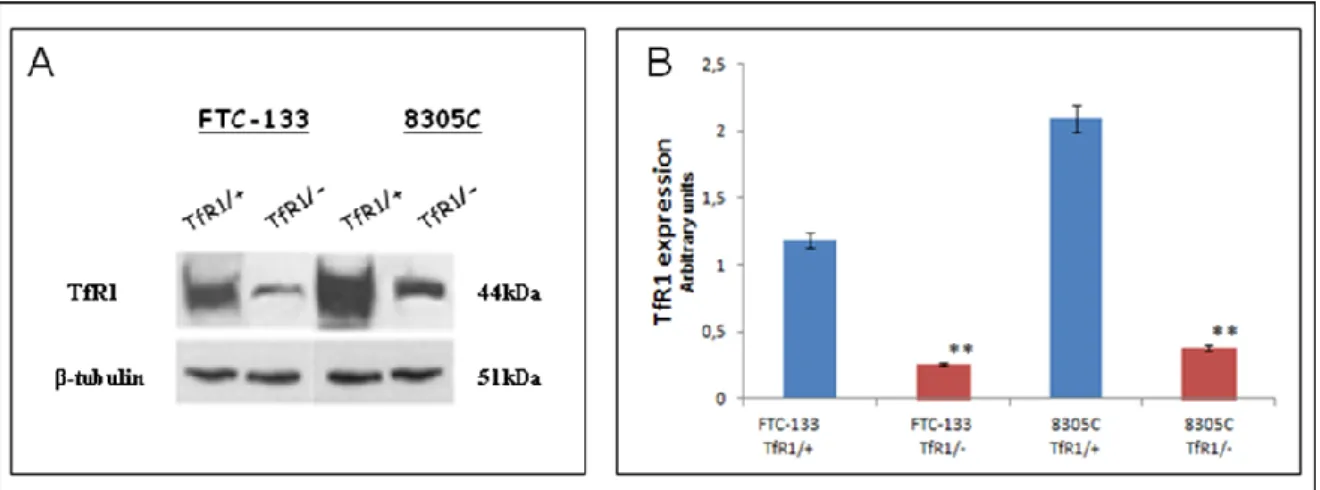
A representative immunoblot and densitometric analysis for the expression TfR1 in the total cellular lysates of the both cell lines were reported in Figure 10. These data confirm that TfR1 was expressed in both cell types at high levels, even if in 8305C cell lines it appeared at higher levels, than those observed in FTC-133 (Fig.10A; Fig. 10B).
Figure 10: A) Representative immunoblot of TfR1 expression in FTC-133 and 8305C human cancer thyroid cell lines. B) Densitometric analysis of TfR1 expression (performed after normalization with β-Tubulin) in the both cell lines. Blots shown are representative of Western blot analysis of four experiments in duplicate. β-Tubulin was used as loading control to normalize TfR1 values. Results are expressed as the mean ± S.D. of the values of four experiments in duplicate. *p< 0.05, significant differences vs controls.
45
Down-Regulation of TfR1 in human thyroid cancer cell lines
To further validate that TfR is the target for a possible thyroid cancer therapy, we used siRNA assay with siRNA duplexes to inhibit the expression of TfR protein. siRNA oligo 5’ AAC TTC AAG GTT TCT GCC AGC 3’ and negative control (scrambled siRNA) were used [Kasibhatla et al.,2005]. In preliminary experiments the both cell line cultures, at about 30-50% confluence and in absence of antibiotics, were treated with different concentrations of TfR1 siRNA (2-10 nM) or negative control (scrambled) and for different times (24, 48 and 72 h), in order to target gene knock-down levels. TfR1-specific siRNA transfections with 10 nM showed 70-80% inhibition of the receptor expression after 48 h, in the FTC-133 and 8305C cancer cell lines, respectively (Fig. 11A).
Down-regulation of endogenous TfR1 after transfection with the siRNA oligonucleotide was confirmed by mRNA analysis (Fig. 11B and 11C). RT-PCR shows the down-regulation of the TfR1 at the mRNA levels in FTC-133 and 8305C cells were transfected for 48h with siRNA-TfR1, or negative control siRNA (NC).
46
Figure 11: A) Fluorescein signal in FTC-133 or 8305C human thyroid cancer cell lines for at least 48 hours of transfection with 10 nM of siRNA-TfR1. Scale bars = 20 µm. B) RT-PCR analysis of TfR1 expression in scrambled-treated FTC-133 or 8305C cell lines (TfR1/+) and siRNA-TfR1 FTC-133 or 8305C human thyroid cancer cells lines. C) Densitometric analysis of RT-PCR products performed after normalization with GAPDH. Results are expressed as the mean ± S.D. of the values of four experiments in duplicate. *p< 0.05, significant differences vs controls
47
Furthermore, to verify the toxic effect of siRNA-TfR1 treatment of the cultures, MTT assay was performed [Campisi et al., 2004 ]. No significant changes in cell viability were found in FTC-133 and 8305C cell cultures transfected with 2 or 4 nM siRNA for 24, 48 and 72 h, when compared with the respective control ones (Tab. 1 and Tab. 2). In contrast, the concentrations of 6, 8, 10 nM progressively reduced cellular viability for all exposure times, even if the effect appeared more significant at the concentration of 10 nM (Tab. 1 and Tab. 2 ).
48 % of cell viability Treatment 24h 48h 72h Scrambled 2nM 96 ± 3 97 ± 1 96 ± 3 Scrambled 4nM 98 ± 1 97 ± 2 98 ± 2 Scrambled 6nM 98 ± 2 97 ± 3 96 ± 2 Scrambled 8nM 96 ± 3 98 ± 2 99 ± 1 Scrambled 10nM 97 ± 2 91 ± 2 97 ± 2 siRNA 2nM 93 ± 1 91 ± 1 89 ± 3 siRNA 4nM 86 ± 1* 83 ± 3* 80 ± 1* siRNA 6nM 78 ± 3* 66 ± 2* 74 ± 2* siRNA 8nM 70 ± 2* 66 ± 1* 63 ± 1* siRNA 10nM 64 ± 2* 59 ± 3* 55 ± 2*
Table 1: Cell viability in FTC-133 human thyroid cancer cell line cultures transfected with different concentrations (2, 4, 6, 8, 10 nM) of scrambled (control) or siRNA-TfR1 for 24, 48, and 72 h. Results are expressed as the mean ± S.D. of the values of four experiments in duplicate. *p< 0.05, significant differences vs controls.
49 % of cell viability Treatment 24h 48h 72h Scrambled 2nM 98 ± 2 97 ± 1 96 ± 1 Scrambled 4nM 96 ± 1 96 ± 2 97 ± 2 Scrambled 6nM 96 ± 3 96 ± 3 98 ± 1 Scrambled 8nM 97 ± 1 98 ± 2 97 ± 3 Scrambled 10nM 97 ± 3 97 ± 2 96 ± 2 siRNA 2nM 95 ± 2 93 ± 1 80 ± 3 siRNA 4nM 88 ± 2 85 ± 1* 82 ± 1* siRNA 6nM 80 ± 1* 78 ± 1* 76 ± 1* siRNA 8nM 76 ± 2* 71 ± 3* 68 ± 3* siRNA 10nM 73 ± 3* 69 ± 2* 63 ± 2*
Table 2: Cell viability in 8305C human thyroid cancer cell line cultures transfected with different concentrations (2, 4, 6, 8, 10 nM) of scrambled (control) or siRNA-TfR1 for 24, 48, and 72 h. Results are expressed as the mean ± S.D. of the values of four experiments in duplicate. *p< 0.05, significant differences vs controls.
These sets of experiments showed that the optimal concentration of siRNA-TfR1 for the both cell cultures was 10 nM and the optimal exposure time was 48 h.
50
Figure 12 shows the inhibition of TfR1 expression by siRNA performed by immunocytochemistry on single cells. The pictures show a significant down-regulation of the receptor in the FTC-133 (Fig. 12B) and 8305C (Fig. 12C) cell lines, when compared with the scrambled-transfected ones, respectively (Fig. 12A and Fig. 12D). The effect appeared more evident in FTC-133 cell lines. No non-specific staining of FTC-133 and 8305C cells was observed in control incubations in which the primary antibody was omitted.
Figure 12- Fluorescent microscopic analysis for TfR1 in scrambled FTC-133 (A) or in 8305C (C) and after 48h of TtfR1 down-regulation in FTC-133 (B) or in 8305C (D) human thyroid cancer cell lines. Magnification is equal in all pictures. Scale bars= 40 µm.
51
From the results of Western blot assay (Fig. 13 A) performed on total cellular lysates of FTC-133 and 8305C cell lines and densitometric analysis are reported in figure 13 A significant reduction of TfR expression levels in siRNA-TfR1 transfected FTC-133 (about 85% of the TfR1 levels) and in 8305C (about 85% of the TfR1 levels) cell lines was found, in comparison with the siRNA-scrambled used as control (Fig. 13A and Fig. 13B).
Figure 13: (A) Representative immunoblots of TfR1 expression in scrambled FTC-133 or in 8305C human thyroid cancer cell lines or after 48h of TtfR1 down-regulation. (B) Densitometric analysis of TfR1 (performed after normalization with β-Tubulin) in response to siRNA-TfR1 transfection, when compared with ones untreated with scrambled used as control. Blots shown are representative of Western blot analysis of four experiments in duplicate. Results are expressed as the mean ± SD of the values of four experiments in duplicate. *p< 0.05, significant differences vs controls.
Inibition of TfR1 expression by siRNA : Immunoblot of TfR1 in FTC-133 and 8305C cells line. β-Tubulin was used as loading control to normalize TfR1 values.
52
Results are expressed as the mean ± SD of the values of four experiments in duplicate. *p< 0.05, significant differences vs controls.
Effect of TfR1 down-regulation on the apoptotic pathway
To understand the correlation between TfR1 silencing and the susceptibility the thyroid cancer cell lines to apoptosis and to determine its possible therapeutic advantage, Caspase-3 cleavage and DNA fragmentation were tested.
We observed that the both tumor cells silenced for only 48 h with 10 nM si-RNA underwent significant apoptosis, when compared with that observed for scrambled-treated ones. In particular, down-regulation of the receptor in FTC-133 and 8305C cell lines displayed a significant increase in Caspase-3 cleavage tested on total cellular lysates by Western Blot assay (Fig. 14A) and densitometric analysis (Fig. 14B).
53
Figure 14: (A) Representative immunoblots of Caspase-3 expression in scrambled FTC-133 or in 8305C human thyroid cancer cell lines or after 48h of TtfR1 down-regulation. (B) Densitometric analysis of Caspase-3 (performed after normalization with β-Tubulin) in response to siRNA-TfR1 transfection, when compared with ones untreated with scrambled used as control. Blots shown are representative of Western blot analysis of four experiments in duplicate. Results are expressed as the mean ± SD of the values of four experiments in duplicate. *p< 0.05, significant differences vs controls.
A significant increase in DNA fragmentation evaluated by TUNEL test in the both cell lines (Fig. 15C and Fig. 15D), when compared with the respespective control ones, was also found (Fig. 15A and Fig 15B). The effect appeared more evident in FTC-133 cell lines, when compared with 8305C ones (Fig. 15).
54
Figure 15: Representative pictures of TUNEL assay performed in scrambled FTC-133 (A) or in 8305C (C) human thyroid cancer cell lines or after 48h of TtfR1 down-regulation in FTC-133 (B) or 8305C (D) . Immunostaining of nonapoptotic (red) and apoptotic (green) cells is shown. Scale bars = 20 µm.
This set of experiments indicates that TfR1 down-regulated cells are not resistant to all apoptotic stimuli in human thyroid cancer, even if the anaplastic thyroid cancer appeared more resistent to apoptosis. Thus, a good correlation between inhibitory effect in siRNA-TfR1 transfected cells and apoptotic pathway activation was observed.
![Figure 2: Thyroid cancer Epidemiology. The trend in thyroid cancer incidence subdivided by histotype in the United States (A) and by gender in the North American population (B) [Aschebrook et al.2013; Pellegriti et al., 2013]](https://thumb-eu.123doks.com/thumbv2/123dokorg/4510790.34493/15.892.161.799.624.866/epidemiology-incidence-subdivided-histotype-american-population-aschebrook-pellegriti.webp)
![Figure 3: Thyroid cancer incidence in Sicily by sex (A-B) and age (B) [Pellegriti et., 2009]](https://thumb-eu.123doks.com/thumbv2/123dokorg/4510790.34493/16.892.160.788.630.934/figure-thyroid-cancer-incidence-sicily-sex-age-pellegriti.webp)
![Figure 4: Contaminants measured in ground water sources and tap water in the provinces of Catania, Palermo, and Ragusa [Pellegriti et al.,2009; Dal Maso et al., 2010]](https://thumb-eu.123doks.com/thumbv2/123dokorg/4510790.34493/17.892.153.786.477.733/figure-contaminants-measured-provinces-catania-palermo-ragusa-pellegriti.webp)
![Figure 6: Crystal structure of of the TfR exocytic recombinant human TfR at 3.2Å resolution [Aisen, 2004]](https://thumb-eu.123doks.com/thumbv2/123dokorg/4510790.34493/23.892.204.764.585.917/figure-crystal-structure-exocytic-recombinant-human-resolution-aisen.webp)
![Figure 7: Schematic illustration of the IRP1 RNA-binding activity [Kwok et al., 2002]](https://thumb-eu.123doks.com/thumbv2/123dokorg/4510790.34493/25.892.183.786.264.605/figure-schematic-illustration-irp-rna-binding-activity-kwok.webp)