1
A voltammetric electronic tongue based on commercial screen-printed
electrodes for the analysis of aminothiols by differential pulse
voltammetry
Clara Pérez-Ràfols, Ana Gómez, Núria Serrano, José Manuel Díaz-Cruz
*, Cristina Ariño,
Miquel Esteban
Department of Chemical Engineering and Analytical Chemistry, Faculty of Chemistry, University of Barcelona.
Martí i Franquès 1-11, E–08028 Barcelona (Spain).
Phone: 0034934039116, fax: 0034934021233, e-mail: [email protected]
ABSTRACT
A voltammetric electronic tongue has been designed as a proof of concept for the analysis of aminothiols by differential pulse voltammetry and has been tested in ternary mixtures of cysteine (Cys), homocysteine (hCys) and glutathione (GSH). It consists of three screen-printed electrodes of carbon, carbon nanofibers and gold cured at low temperature. A preliminary calibration study carried out separately for each aminothiol confirmed that, working at an optimal pH value of 7.4, every electrode produces differentiated responses for every analyte (cross-response). As for the tongue, it was applied to calibration and validation mixtures of Cys, hCys and GSH and provided voltammograms that, baseline-corrected, normalized and combined in different ways were submitted to partial least squares (PLS) calibration. The calibration models produced good predictions of the concentrations of all three analytes, which suggest that the proposed voltammetric tongue improves the performance of a previous design based on linear sweep voltammetric measurements under acidic conditions.
Keywords: screen-printed electrodes, aminothiols, voltammetric electronic tongue, differential pulse voltammetry, partial least squares.
2
1 Introduction
Thiol compounds play a crucial role in biological systems. Cysteine (Cys), homocysteine (hCys) and glutathione (GSH) are aminothiols very relevant in the processes of metabolism and homeostasis [1]. Thus, it is of great interest to know their concentration levels in biological fluids. Several methods have been used for the analysis of aminothiols, including UV-vis spectrophotometry, fluorescence, liquid chromatography and capillary electrophoresis [2-5]. Among these methods, the use of voltammetry and amperometry has received increasing attention in the last years due to their simplicity, sensitivity, versatility and low cost [6-8], enhanced in the last years by the popularization of screen-printed electrodes (SPE) [9-11]. Nevertheless, most of these methods require a preliminary separation of aminothiols (typically by chromatography or electrophoresis) due to their similar optical or electrochemical behaviour. According to this strategy, SPE have been successfully applied to the amperometric detection of aminothiols by liquid chromatography [12].
A totally different approach is the use of voltammetric electronic tongues (or voltammetric sensor arrays) to avoid the preliminary separation of analytes with similar responses. Electronic tongues are constituted by non-specific sensors with different selectivity towards the analytes, so that the chemometric analysis of their combined signals can resolve mixtures producing strongly overlapped voltammograms. Although electronic tongues are mainly used in food analysis as tasting devices, they are also applied to other research fields such as environmental analysis or bioanalysis [13-17].
Recently, a voltammetric electronic tongue was designed by our research group as a proof of concept for the analysis of Cys, hCys and GSH [18]. It consisted of two commercial SPE made of gold cured at high and low temperature and a third one home-made modified with carbon nanotubes. The work was carried out under experimental conditions similar to those providing a satisfactory amperometric detection of thiols in liquid chromatography [12]. This means an acidic medium of 0.05% trifluoroacetic acid. As for voltammetric measurements, they were made by the relatively simple technique of linear sweep voltammetry (LSV), which produced quite noisy signals. The results of the study showed that the proposed tongue could distinguish mixtures of aminothiols of different composition if the voltammograms were analyzed by principal component analysis (PCA). It was also shown that calibration by partial least squares (PLS) allows one to predict the concentration of all three aminothiols in unknown samples if an appropriate variable selection method is used. It was clear, however, that the concentrations determined in this way were not very accurate, especially in the case of GSH, and that an improvement of the tongue was required. Moreover, not all the electrodes used were commercially available, which decreases reproducibility and can hinder the electrode exchange.
3
Thus, in this work we revisit the problem of thiol quantification by designing an improved voltammetric electronic tongue as a new proof of concept. For this purpose, we have selected a new set of unmodified commercial SPE electrodes, have optimized the working pH and have analyzed the individual response of every electrode at increasing concentrations of every aminothiol. Moreover, differential pulse voltammetry (DPV) has been used as an electrochemical technique producing better defined and less noisy signals than LSV. As for the data treatment, PLS-1 was used again. Once the experimental conditions were established, the tongue was tested with a set of calibration and validation samples containing Cys, hCys and GSH.2 Experimental
2.1. Chemicals
L-Cysteine (Cys, 99%), and DL- homocysteine (hCys, 95%) were provided by Sigma-Aldrich (St. Louis, USA). Reduced glutathione (GSH, 98%) was purchased from Merck (Darmstadt, Germany). Hydrochloric acid, sodium hydroxide, acetic acid, sodium acetate, boric acid and tris(hydroxymethyl)aminomethane (also known as tris), used in the preparation of different buffered media, were also from Merck. For the preparation of solutions, purified water was used (from Milli-Q plus 185 system).
2.2. Apparatus
Differential pulse voltammetric (DPV) experiments with separated electrodes were performed using a µAutolab System Type III (EcoChemie, Netherlands) attached to a Metrohm 663 VA Stand (Metrohm, Switterland) and a personal computer with GPES 4.9 Software (EcoChemie, Netherlands). For multichannel experiments, an Autolab System PGSTAT12 (EcoChemie) and the GPES Multichannel 4.7 software package (EcoChemie) were employed.
In all cases, a conventional cell was used with Ag|AgCl|KCl (3 mol L-1) as reference electrode,
platinum wire as auxiliary electrode and one or more screen-printed devices manufactured by Dropsens (Oviedo, Spain) as working electrodes, attached to the system by means of flexible cables DRP-CAC also from Dropsens. References of the screen-printed electrodes used were as follows: carbon 110, high temperature gold 220AT, low temperature gold DRP-C220BT and carbon modified with nanofibers DRP-110CNF.
The pH of the solutions was adjusted using a Crison MicropH 2000 pH-meter (Crison, Barcelona, Spain).
4
2.3. Data analysis
For the processing of electronic tongue measurements, DP voltammograms registered with all three electrodes were baseline-corrected by means of the program backcor by V. Mazet [19], implemented in Matlab® [20], and further normalized. Different row-wise combinations of the pretreated matrices were submitted to PLS-1 calibration by means of the PLS_Toolbox package [21] also implemented in Matlab®. Kennard-Stone algorithm [22] was applied inside Matlab® environment for the selection of a validation set from the full experimental data set.
3 Results and discussion
3.1. Voltammetric behaviour of several aminothiols at different screen-printed electrodes
A preliminary study was made to stablish a convenient working pH for several commercially available screen-printed electrodes that, according to previous results, could be good candidates to constitute an improved voltammetric electronic tongue. These are the low-temperature and high-temperature cured gold electrodes (AuBT and AuAT, respectively) successfully used in [18], the carbon nanofibers electrode (CNF), a device with similar or even better features than carbon nanotubes [23], and the simple, cheap and versatile carbon electrode.
[Figure 1] Figure 1
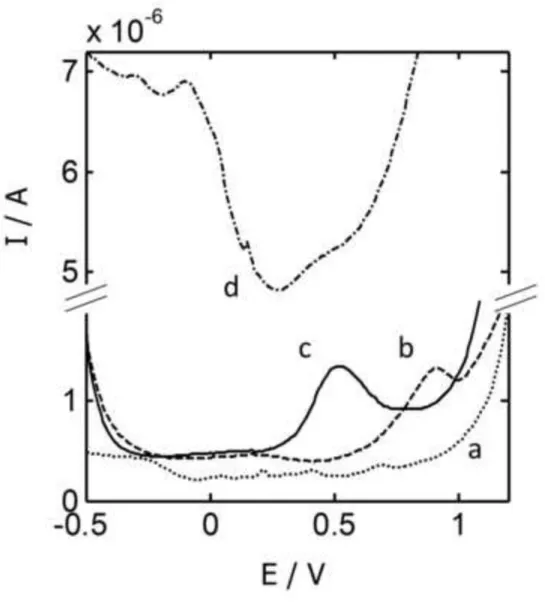
DP voltammograms measured with a carbon screen-printed electrode in a solution containing 100 μmol L-1 of hCys at pH values of 2.0 (a), 4.5 (b), 7.4 (c) and 9.0 (d).
Figure 1 shows, for instance, the differential pulse voltammograms obtained with a carbon SPE for a solution of hCys at different pH values. As it can be seen, the most acidic pH produces too low currents (a) while the most basic pH (d) generates higher currents but poorly-defined peaks. Intermediate pH values produce a well-defined oxidation peak which, in the experiment at pH 7.4 (c), is placed at less oxidative potentials than in the case at pH 4.5 (b) and, hence, is less overlapped to the baseline corresponding to the medium oxidation. In a similar way, the tests made with different electrodes and analytes suggested that a pH value of 7.4 (obtained with tris buffer) would be a good compromise to obtain an optimal performance of the electrodes when they work together in the same solution. It should be pointed out that, in contrast to the acidic medium used in the previous tongue [18] or the chromatographic method [12], this optimal pH of 7.4 is really close to biological conditions.
5
[Figure 2]Figure 2
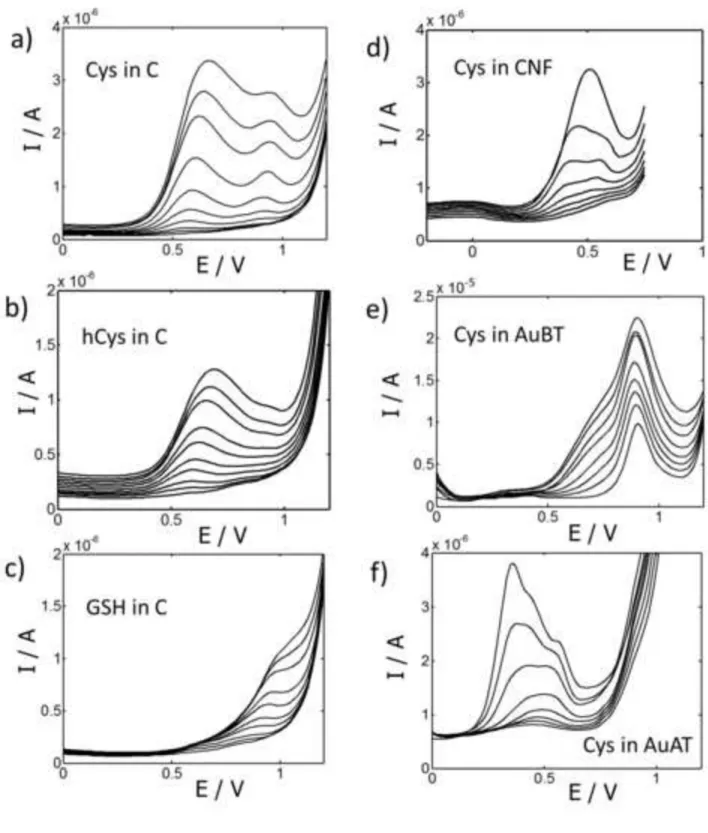
DP voltammograms measured with a carbon screen-printed electrode at increasing concentrations of Cys in the range 0-600 μmol L-1 at pH 7.4 (a). Comparison with the signals obtained for other
aminothiols under the same conditions and in the concentration range 0-100 μmol L-1 hCys (b)
and GSH (c). Comparison with the signals obtained for Cys under the same conditions but using other screen-printed electrodes: carbon nanofiber (d), gold cured at low temperature (e) and gold cured at high temperature (f).
In order to ensure the cross-response of the electronic tongue, the next step of the study was devoted to obtain the calibration plots of all the considered aminothiols alone with every screen printed device at pH 7.4. As an example, Figure 2 shows the DP voltammograms obtained at a carbon electrode for increasing concentrations of the different analytes (a, b, c) and also the signals measured for Cys by using different electrodes (a, d, e, f). From these plots (and from other not shown) one can deduce some qualitative information. On the one hand, the signals of the different aminothiols appear at similar but not identical potentials, which means that in a mixture they will be overlapped with each other, but also that multivariate analysis will be able to take advantage of these small differences in potentials to resolve them. On the other hand, different electrodes produce quite different signals when applied to the same substance, which makes these electrodes great candidates to be included in a voltammetric electronic tongue for the analysis of aminothiol mixtures. It is notorious the much higher sensitivity of AuBT electrode as compared to the others, since it produces currents more than five times higher (Figure 2e). In contrast, AuAT, produces voltammograms with small and poorly reproducible variations at increasing concentrations of the aminothiols considered at pH 7.4. Thus, although it had been suitable in studies carried out at acidic pH [12,18], AuAT electrode was discarded in the present work, developed at slightly basic pH.
Table 1 summarizes the figures of merit obtained in the calibration study for all analytes and electrodes by using the area under the main signal (a peak or a group of overlapping peaks) as the instrumental response.
6
Table 1Calibration parameters of the aminothiols considered in the study when measured individually by DPV at different screen-printed electrodes at pH 7.4. The detection limit (LOD) is computed from the intercept of the calibration plot plus three times its standard deviation.
Electrode Figures of merit
Analyte Cys hCys GSH CNF R2 0.996 0.998 0.966 slope (x1010 a.u./μmolL-1) 5.7 4.6 6.0 LOD (μmol L-1) 9 3 13 Carbon R2 0.997 0.988 0.995 slope (x1010 a.u./μmol L-1) 14 17 2.0 LOD (μmol L-1) 8 6 3 AuBT R2 0.978 0.940 0.913 slope (x1010 a.u./μmolL-1) 530 140 350 LOD (μmol L-1) 6 8 5
These data confirm that CNF and carbon electrodes are less sensitive than AuBT (the slopes of the calibration lines are lower). As for detection limits, they are all of the same order of magnitude (from 3 to 13 μmol L-1). The comparison of the slopes also shows that CNF electrode has similar
sensitivities for all aminothiols, that carbon electrode is especially sensitive for Cys and hCys and that AuBT electrode is very sensitive for all substances. This differential behaviour of the three electrodes (cross-response) suggests that their combination in an electronic tongue should produce an improved resolution in the analysis of aminothiol mixtures.
3.2. Design of a voltammetric electronic tongue and application to the analysis of ternary mixtures of Cys, hCys and GSH
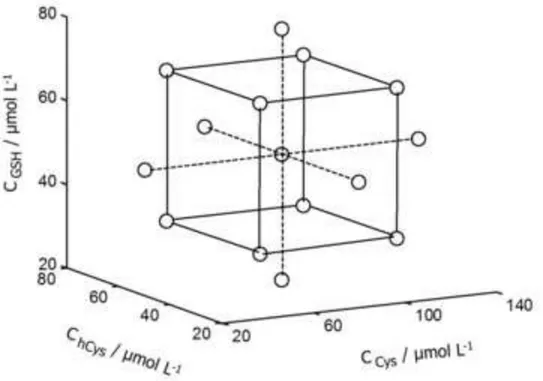
From the results previously discussed, a voltammetric electronic tongue was constructed integrating in the voltammetric cell the three screen-printed electrodes successfully tested, i.e., CNF, carbon and AuBT, in order to carry out simultaneous DPV measurements on the same solution by means of a multichannel potentiostat. Figure 3 shows the experimental design used to obtain both calibration and validation sets. It is a 3 factors, 5 levels central composite design involving 15 samples with different concentrations of Cys, hCys and GSH, prepared in tris buffer at pH 7.4. For every sample two replicates were analyzed, which yields a total of 30 voltammograms measured at every electrode.
7
[Figure 3]Figure 3
Experimental design for the calibration and validation of the electronic tongue proposed. Small circles (O) indicate the concentration of Cys, hCys and GSH of 15 different samples. For every sample, two replicate were measured. The selection of validation samples was used according to Kennard-Stone algorithm.
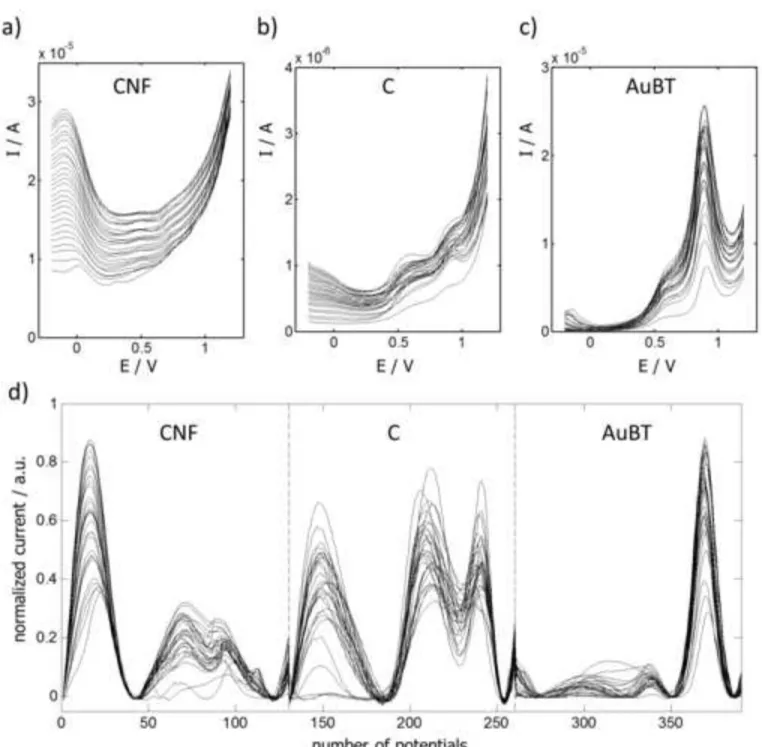
The voltammograms obtained according to this experimental design were baseline-corrected with backcor program [19] and normalized. The application of PCA to these pre-treated data allowed the detection and elimination of one outlier. Figure 4 shows the 29 remaining voltammograms in both their original (a, b, c) and pre-treated forms (d), evidencing, as expected, a strong overlapping of signals. From these data, a set of 9 representative measurements was selected according to the algorithm by Kennard-Stone [22] for a further validation of the models. The 20 voltammograms left constituted the calibration set. For every possible combination of one to three electrodes of the tongue, individual PLS-1 models were tested for all three analytes, discarding a maximum of 2 points out of 20 in every calibration. The best results were provided by CNF+C, CNF+C+AuBT and AuBT electrodes for Cys, hCys and GSH, respectively, and are summarized in Table 2 and Figure 5.
[Figure 4] Figure 4
DP voltammograms measured at pH 7.4 for all the samples prepared according to the design of Figure 4 by using screen-printed electrodes of carbon nanofibers (a), carbon (b) and low-temperature cured gold (c). The original voltammograms are baseline-corrected, normalized and combined into a row-wise augmented matrix for PLS analysis. Several combination of matrices/electrodes are possible. In (d) the matrix resulting from the combination of all three electrodes is shown.
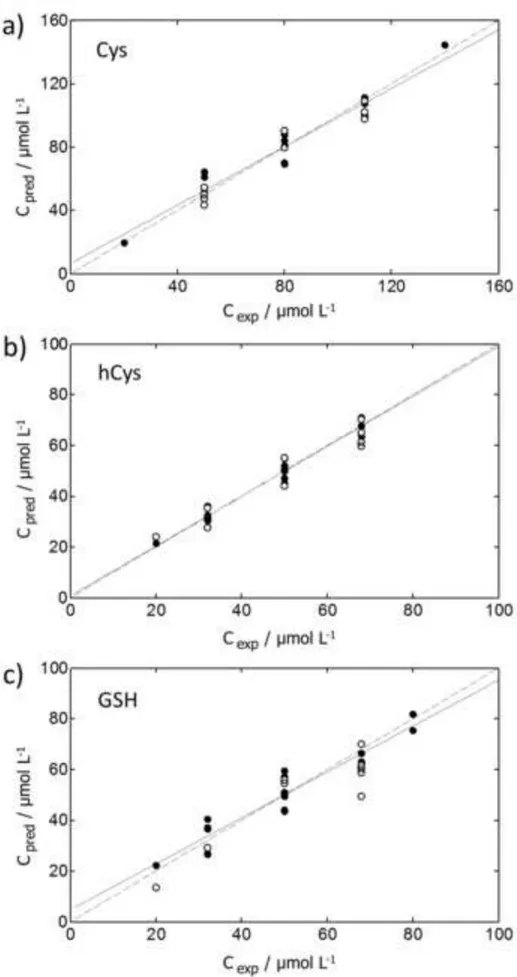
[Figure 5] Figure 5
Predicted versus experimental concentration plots corresponding to the application of individual PLS-1 models to the quantification of Cys (a), hCys (b) and GSH (c). Calibration samples (●), validation samples (○), regression line from calibration samples (-), ideal calibration line with slope 1 and intercept 0 (….).
8
Table 2Main characteristics of the PLS-1 models applied to 29 samples measured with different combinations of a carbon nanofiber (CNF) a carbon (C) and a gold (AuBT) screen-printed electrode. From the original set, 9 samples were separated for validation according to Kennard-Stone algorithm and the remaining samples were used for calibration. A maximum of 2 outliers were removed in each calibration set (but not in validation sets). The table shows the electrodes considered in the model, the number of calibration and validation samples, the number of latent variables (LV) and the correlation coefficients of the predicted vs. experimental values plot for the calibration (Rcal) and validation (Rval) sets. Relative mean squared errors were also given for
calibration (RMSEC) and validation (RMSEP).
As compared to the previous design [18], predictions are equally good for Cys and GSH and much better for hCys (the most problematic substance in [18]) and they do not require any sophisticated variable selection algorithm to be obtained. It is remarkable that, according to Figure 5, deviations in the prediction of validation samples are only slightly higher than deviations in calibration samples. This assures that PLS models are not overfitting the calibration data (otherwise, validation errors would be much higher than calibration ones).
4 Conclusions
As compared to the preliminary design of a voltammetric electronic tongue for the analysis of aminothiols [18], this work introduces some improvements: i) a working pH of 7.4, much closer to biological and usual environmental conditions; ii) a measuring technique (DPV instead of LSV) producing better defined, less noisy signals; iii) the use of a powerful algorithm of background subtraction; iv) PLS is applied directly on full voltammograms, without the need of any variable selection algorithm that could introduce artifacts in the analysis and v) all electrodes in the tongue are commercially available with no need of home-made modification, which increases reproducibility and makes electrode exchange easier. As a result, the overall prediction ability of the tongue has improved.
Analyte Electrodes
Samples
LV Rcal Rval RMSEC RMSEP
Calibration Validation
Cys CNF+C 19 9 8 0.964 0.971 7.56 6.49
hCys CNF+C+AuBT 18 9 7 0.983 0.964 2.67 5.10
9
Just to conclude, the good behavior shown by the proposed electronic tongue in synthetic solutions encourages further studies in more involved samples.Acknowledgements
This work is supported by the Spanish Ministry of Science and Innovation (Project CTQ2012– 32863 and a pre-doctoral grant for C. Pérez-Ràfols) and by the Generalitat de Catalunya (Project 2014SGR269).
10
References
[1] P. C. Jocelyn, Biochemistry of the SH Group, Academic Press, London, 1972. [2] J. R. Winther, C. Thorpe, Biochem. Biophys. Acta 2014, 1840, 838-846. [3] X. Chen, Y. Zhou, X.Peng, J. Yoon, Chem. Soc. Rev. 2010, 39, 2120-2135.
[4] K. Kúsmierek, G. Chwatko, R. Głowacki, P. Kubalczyk, E. Bald, J. Chromatogr. B 2011, 879, 1290–1307.
[5] C. Bayle, E. Caussé, F. Couderc, Electrophoresis 2004, 25, 1457–1472.
[6] P. C. White, N. S. Lawrence, J. Davis, R. G. Compton, Electroanalysis, 2002, 14, 89–98. [7] J. Kruusma, A. M. Benham, J. A. G. Williams, R. Kataky, Analyst 2006, 131, 459–473. [8] J. C. Harfield, C. Batchelor-McAuley, R. G. Compton, Analyst 2012, 137, 2285–2296. [9] M. Li, Y.T. Li, D.W. Li, Y.T. Long, Anal. Chim. Acta 2012, 734, 31–44.
[10] Z. Taleat, A. Khoshroo, M. Mazloum-Ardakani, Microchim. Acta 2014, 181, 865–891. [11] G. Hughes, K. Westmacott, K. C. Honeychurch, A. Crew, R.M. Pemberton, J. P. Hart,
Biosensors 2016, 6, 50-88.
[12] S. Cavanillas, N. Serrano, J. M. Díaz-Cruz, C. Ariño, M. Esteban, Electroanalysis 2014, 26, 581–587.
[13] P. Ciosek, W. Wrýblewskia, Analyst 2007, 132, 963–978.
[14] A. Gutés, F. Céspedes, M. del Valle, Anal. Chim. Acta 2007, 600, 90–96. [15] F. Winquist, Microchim. Acta 2008, 163, 3–10.
[16] M. del Valle, Electroanalysis 2010, 22,1539–1555. [17] Y. Tahara, IEEE Sensors Journal 2013, 13, 3001–3011.
[18] R. H. P. Pedroza, N. Serrano, J. M. Díaz-Cruz, C. Ariño, M. Esteban, Electroanalysis 2016, 28, 1570-1577.
[19] V. Mazet, C. Carteret, D. Brie, J. Idier, B. Humbert, Chemom. Intell. Lab. Syst. 2005, 76, 121-133.
[20] Matlab, version R2009b ed., Mathworks Inc.: Natick, MA, USA, 2009.
[21] PLS_Toolbox version 7.8.2, Eigenvector Research Inc., Wenatchee, USA, 2014. [22] R. W. Kennard, L. A. Stone, Technometrics 1969, 11, 137 –148.
[23] C. Pérez-Ràfols, N. Serrano, J.M. Díaz-Cruz, C. Ariño, M. Esteban, Anal. Chim. Acta