arXiv:astro-ph/0401514v1 23 Jan 2004
Astronomy & Astrophysicsmanuscript no. art July 11, 2011
(DOI: will be inserted by hand later)
A search for microquasar candidates at low galactic latitudes
J. M. Paredes
1, M. Rib´o
1, and J. Mart´ı
21 Departament d’Astronomia i Meteorologia, Universitat de Barcelona, Av. Diagonal 647, 08028 Barcelona, Spain 2 Departamento de F´ısica, Escuela Polit´ecnica Superior, Universidad de Ja´en, Virgen de la Cabeza 2, 23071 Ja´en, Spain
Received 21 May 2002 / Accepted 24 July 2002
Abstract. Recent studies of relativistic jet sources in the Galaxy, also known as microquasars, have been very useful in trying to understand the accretion/ejection processes that take place near compact objects. However, the number of sources involved in such studies is still small. In an attempt to increase the number of known microquasars we have carried out a search for new Radio Emitting X-ray Binaries (REXBs). These sources are the ones to be observed later with VLBI techniques to unveil their possible microquasar nature. To this end, we have performed a cross-identification between the X-ray ROSAT all sky survey Bright Source Catalog (RBSC) and the radio NRAO VLA Sky Survey (NVSS) catalogs under very restrictive selection criteria for sources with |b| < 5◦. We have also conducted a deep observational radio and optical study for six of the selected candidates. At the end of this process two of the candidates appear to be promising, and deserve additional observations aimed to confirm their proposed microquasar nature.
Key words. X-rays: binaries – radio continuum: stars
1. Introduction
Microquasars are X-ray binary systems with the ability to gen-erate relativistic jets. The presence of such collimated features is considered to be the unmistakable fingerprint of their mi-croquasar nature. The jets are seen thanks to their synchrotron emission at radio wavelengths, that can be resolved with mod-ern interferometers. Hence, all microquasars belong to the class of Radio Emitting X-ray Binaries (REXBs), which contains about ∼ 50 sources among the ∼ 280 known X-ray binaries (Liu et al. 2000; Liu et al. 2001).
The discovery of microquasars, so far only in our Galaxy, illustrates how sometimes nature mimics itself at scales or-ders of magnitude different. The interesting analogy between quasars and microquasars, both from the morphological and physical point of view, has been pointed out by several au-thors. In addition, microquasars are considered to be good lab-oratories for understanding the physics of accretion/ejection processes and strong gravitational fields (see, e.g., Mirabel & Rodr´ıguez 1999). The key parameter that distinguishes the quasar/microquasar properties is believed to be the mass of the compact object in the central engine, varying over nine orders of magnitude from supermassive to stellar-mass black holes. The most recent findings of microquasars have been summa-rized in Castro-Tirado et al. (2001).
The current census of microquasar sources in the Galaxy amounts to 14 systems (Mirabel & Rodr´ıguez 1999, Rodr´ıguez & Mirabel 2001), with LS 5039 (Paredes et al. 2000), Cyg X-1
Send offprint requests to: J. M. Paredes,
e-mail: [email protected]
(Stirling et al. 2001) and XTE J1550−564 (Hannikainen et al. 2001) as the most recent additions. This number could increase dramatically if, as it has been proposed by Fender & Hendry (2000), radio emission from X-ray binaries always arises from relativistic jets. This would imply that all REXBs are micro-quasars. However, the situation is not so clear yet and REXBs appear as a rather heterogeneous group including both high-mass (e.g., Cyg X-3, LS I +61 303) and low-high-mass companions (e.g., Aql X-1, GX 339−4). Moreover, in the latter group, radio emission has been detected in both atoll and Z-type sources. In addition, the detection of radio emission does not seem to be limited to a particular type of compact object, since there are REXBs harboring black holes (e.g., GRO J1655−40, Cyg X-1) and neutron stars (e.g., Aql X-1, Sco X-1). Moreover, when one begins to further divide the group of REXBs according to their optical or compact companion or whether radio jets are present or not, the number of systems is no longer enough to perform a meaningful statistical study.
For example, the systems whose compact companion is be-lieved to be a black hole appear to have jet velocities above 0.9c, while those with neutron stars appear to exhibit slower jet flows with speeds below 0.5c (Mirabel & Rodr´ıguez 1999). However, Fomalont et al. (2001) have measured speeds up to 0.57c in the neutron star system Sco X-1, and a lower limit of
only 0.6c has been derived for the black hole system Cyg X-1
by Stirling et al. (2001), while systems like Cyg X-3, where the nature of the compact object is unknown, exhibit flows with in-termediate speeds of 0.5c (Mart´ı et al. 2001). Therefore, some questions arise: is there a true correlation? what is the speed limit of the jets in neutron star systems, if any?
Another interesting issue is the possibility of microquasars being sources of high energy γ-rays. Up to now, the most promising candidate is LS 5039, which appears to be asso-ciated with the third EGRET catalog (Hartman et al. 1999) source 3EG J1824−1514 (Paredes et al. 2000). On the other hand, the 26.5 d periodic REXB LS I +61 303 could be associ-ated with the source 3EG J0241+6103 (Kniffen et al. 1997). Although these associations will only be confirmed, or dis-carded, by future missions such as GLAST, clearly a sample of two sources is a very poor one, and any attempt to discover new REXBs/microquasars, and look for possible high energy
γ-ray emission, is warranted.
Hence, the reduced population known gave us a strong mo-tivation to start a long-term project focused on searching for new microquasars in the Galaxy. In this context, X-ray, optical and radio catalogs provide a fundamental tool for the search of new sources with known multiwavelength behavior. Therefore, we have used the best available X-ray and radio catalogs to search for new REXB candidates on the basis of positional co-incidence, together with very restrictive selection criteria. As a result we have obtained a sample of 13 radio emitting X-ray sources, which is expected to contain at least some galactic X-ray binaries. For 6 of the selected candidates, a deep study involving optical and VLA high resolution observations was carried out in order to better determine their positions and na-ture. After these observations, all but one of the sources have appeared unresolved, even at the highest VLA resolution, and the positions are known to better than 0.01 arcsecond accuracy. Optical spectroscopy is also currently in progress to confirm the stellar nature of our candidates, while already carried out VLBI observations will be reported in a future paper.
In this paper we present the results of the cross-identification together with radio and optical astrometry and photometry of these sources. We explain the developed cross-identification method in Sect. 2. We present the follow-up radio observations in Sect. 3, while the optical ones are described in Sect. 4. An analysis of the obtained data and the corresponding discussion are presented in Sect. 5. We finally state our conclu-sions in Sect. 6.
2. Cross-identification between RBSC and NVSS catalogs
In order to find new microquasar candidates we have to search for new REXBs. The first step, hence, has consisted of a posi-tional cross-identification of X-ray and radio sources using the most complete available catalogs at both wavelengths, namely the ROSAT all sky Bright Source Catalog (RBSC) and the NRAO VLA Sky Survey (NVSS), which are briefly introduced now.
In the X-ray domain, the RBSC (Voges et al. 1999) con-tains in its current version a total of 18 806 sources in the en-ergy band 0.1–2.4 keV, and is derived from the ROSAT All Sky Survey (Voges et al. 1996). Four energy bands in the fol-lowing ranges of keV are provided: A=0.1–0.4, B=0.5–2.0,
C=0.5–0.9, D=0.9–2.0. From these bands, two hardness ratios
are computed: HR1 = (B − A)/(B + A), HR2 = (D −C)/(D +C).
The 1σ positional uncertainties are typically in the range 10– 20′′.
In the radio domain, the NVSS (Condon et al. 1998)
cat-alog covers the sky north of δ = −40◦ (82% of the celestial
sphere) at a frequency of 1.4 GHz (20 cm wavelength) using
the VLA configurations D and DnC. It contains over 1.8 × 10⁶
sources stronger than its 2.5 mJy completeness limit. The rms
positional uncertainties are less than 1′′ for sources stronger
than 15 mJy and 7′′for the faintest detectable sources.
Since our aim is to maximize the probability of retaining only galactic REXB systems by cross-identifying the RBSC and the NVSS catalogs, we have adopted the following selec-tion criteria:
1. Sources with absolute galactic latitude < 5◦have been
se-lected from the RBSC catalog. Since the NVSS has a limit
of δ > −40◦, only the RBSC sources above this
declina-tion have been allowed to continue in the selecdeclina-tion process.
Therefore, approximately 75% of the whole |b| < 5◦area is
covered (l ≃ 347–259◦and α ≃ 17.2–8.6h).
2. Among the remaining RBSC sources, those containing screening flags about nearby sources contaminating mea-surements or problems with position determinations (Voges et al. 1999) have been rejected.
3. From statistical RBSC identification studies, Motch et al. (1998) concluded that X-ray binaries are essentially rec-ognizable from their hard X-ray spectra. Therefore, in an attempt to avoid AGNs and cataclysmic variables, we have only selected the sources with HR1 + σ(HR1) higher than 0.9. Although this criterion would exclude microquasars in an outburst, we note that this situation only lasts a short time of their life, and the probability of discarding one of them is very low. A total of 241 RBSC sources remain in our sample at this stage.
4. The X-ray and radio positions must agree within errors. For this purpose, we have selected NVSS sources within the 2σ (95% probability) error boxes of the RBSC sources. We have also used the constraint of a maximum offset of
40′′ between the RBSC and the NVSS positions, since,
for higher distances, no reliable identification is expected (Voges et al. 1999).
5. No extended radio source has been allowed to continue in the selection process, since any REXB is expected to appear
compact at the NVSS resolution1.
The sources selected with the RBSC/NVSS
cross-identification, a total of 35, were then filtered with com-plementary optical information using the following criteria:
1. We have inspected the SIMBAD database and the NASA/IPAC Extragalactic Database (NED) for each source, and if it is listed as an extragalactic object, we have obviously rejected it from the sample.
2. We have also inspected the Digitized Sky Survey, DSS1 and
DSS2-red images2, and looked for possible optical
coun-terparts with position agreement with the NVSS sources. If 1 The sources resolved only in one axis and with an angular size
smaller than the other axis were allowed to continue on the process.
an optical object is present and displays extended emission, i.e., with a galaxy-like appearance, it has also been removed from the sample.
At the end of this process the resulting sample contained 16 sources. Among them, we found the well known REXB LS I +61 303, which displays a one-sided jet at milliarcsecond scales (Massi et al. 2001). We also recovered the well known microquasars LS 5039, SS 433 and Cyg X-3. It is interesting to note that all these sources are HMXB, and none of the known microquasars with low mass companions were found by this technique. This can be easily explained by the fact that most of LMXB are transients, and the remaining persistent ones are too faint to be present in the NVSS. Moreover, all but one HMXB persistent microquasars in our explored range of galac-tic latitudes, namely LS 5039, SS 433 and Cyg X-3, have been recovered by our cross-identification method. The remaining one, namely Cyg X-1, although marginally present in the cor-responding NVSS image, does not appear in the NVSS catalog. This was probably due to the source low flux density and dif-fuse background around it, which prevented its automatic de-tection by the source search software.
After removing the previously known sources of our sam-ple, we ended with a total of 12 new unidentified REXB candi-dates. Among them, 7 had offsets between the X-ray and radio positions within the 1σ RBSC position error, and belong to the hereafter Group 1 sample. The other 5 sources had offsets be-tween 1–2σ and form the Group 2 sample.
When we started this project in 1998 another source full-filed all the selection criteria. Now we have performed the cross-identification process again, in order to present here an updated version of it, and we have found that this source, namely 1RXS J072418.3−071508, was identified by Perlman et al. (1998) as a quasar (WGA J0724.3−0715 in their pa-per and listed as PMN J0724−0715 in the NED database). Although it is clear that it is not any more a REXB candidate, we have preferred to include it in the list and present the ob-servational results obtained up to now. Since the corresponding offset in position for this object is less than 1σ, it is included in Group 1.
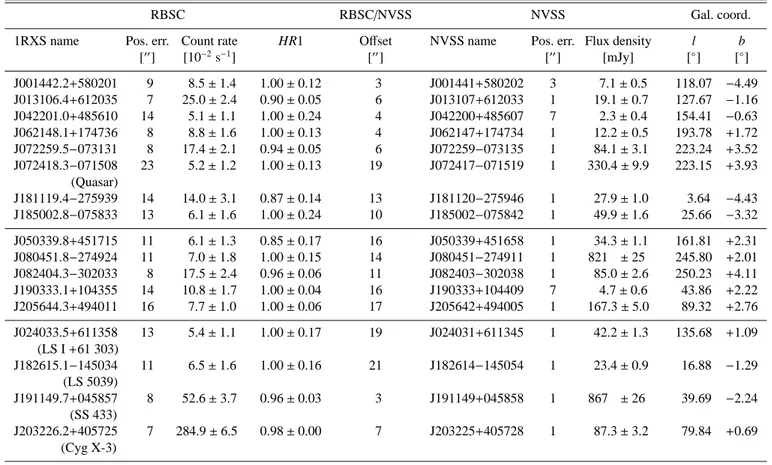
All the sources belonging to Group 1 (a total of 8), Group 2 (a total of 5) and the already known REXBs are listed in Table 1, where Cols. 1 to 4 contain the RBSC names (which also provide the positions), the 1σ errors in position, the count rates, and HR1. In Col. 5 we show the offsets between the RBSC and the NVSS positions. In Cols. 6 to 8 we list the NVSS names (which provide a limited position information), the 1σ errors in position and the NVSS flux densities (at 20 cm wave-length). Finally, galactic coordinates for all sources are listed in Cols. 9 and 10. The horizontal line divides the two groups of sources and the already known REXBs.
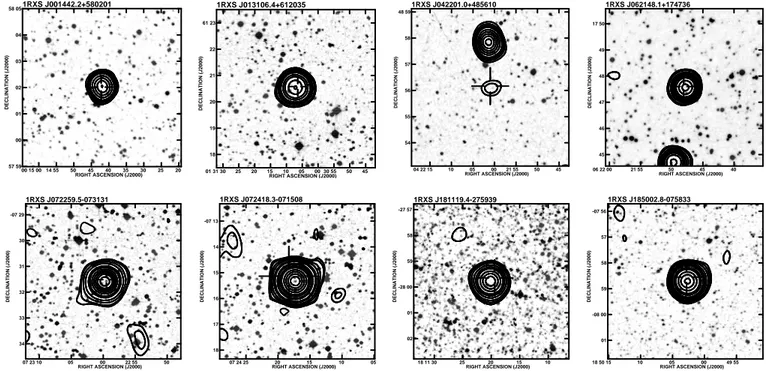
In this paper we will focus on the Group 1 sources, while Group 2 sources will be eventually studied in the future. In order to have a look at the targets, we show in Fig. 1, for each
source of Group 1, the NVSS radio contours overlaid on 6′×6′
optical DSS1 images. To mark the RBSC positions we have plotted as open crosses the 3σ errors in position, allowing a better display than if we had plotted the 1σ errors.
As can be seen in Table 1, the NVSS errors are much smaller than the RBSC ones. Hence, the radio positions are more accurate than the X-ray ones to look for optical counter-parts. An inspection of the DSS1 images in Fig. 1 reveals that some candidates have an optical counterpart approximately in the middle of the radio contours, while others do not. This is understandable because of the low galactic latitude of these ob-jects, which implies a high degree of extinction along the line of sight. On the other hand, crowded fields near the galactic plane also prevent us to be sure about the counterparts detected. Therefore, the next step of the process is to obtain accurate ra-dio positions and then search for possible optical counterparts.
3. Radio observations
The main goal of the radio observations was to obtain accu-rate sub-arcsecond positions, but we also wished to monitor the variability of radio flux and spectrum of our targets. On the other hand, it was also important to investigate the source structure beyond the NVSS resolution. For REXBs, most of the source flux density is expected to be concentrated in a com-pact core plus possible arcsecond or sub-arcsecond extended features. By observing each target with the VLA in A configu-ration, we were able to verify to what extend our sources were indeed compact, and to look for possible elongations or jets.
To this end, multi-frequency and multi-epoch observa-tions of the Group 1 sources were carried out with the
NRAO3 VLA in A configuration. We did not observe
1RXS J181119.4−275939 and 1RXS J185002.8−075833, the last two sources of Group 1 in Table 1, because they had very different right ascensions, compared to the other sources, and were not visible during the scheduled VLA observing time.
Three VLA A configuration observing sessions were car-ried out on 1999 July 9, 22 and 30 at 3.6 cm (8.4 GHz) and 6 cm (5 GHz) wavelengths (frequencies). A typical observa-tion consisted of 14 minutes at 3.6 cm and 4 minutes at 6 cm on each target, preceded and followed by a 2 minute observation of a phase calibrator. During the last observing session, July 30, we included two additional 20 cm (1.4 GHz) measurements of 1RXS J072259.5−073131 and 1RXS J072418.3−071508. The amplitude calibrator used in all cases was 3C 48, while we used the phase calibrator J0102+584 for the first two sources, J0359+509 and J0603+177 for the third and fourth sources, re-spectively, and finally J0730−116 for the last two sources. The data were edited and calibrated using the AIPS software pack-age of NRAO.
3.1. Results
All sources were detected at all frequencies, allowing us to obtain accurate positions and flux density measurements. To achieve the first goal, we made use of the phase-reference tech-nique to calibrate the data at 3.6 cm wavelength, the ones with the highest angular resolution. Then we concatenated all 3 The National Radio Astronomy Observatory is a facility of the
National Science Foundation operated under cooperative agreement by Associated Universities, Inc.
Table 1. Selected sources from the RBSC/NVSS cross-identification. Cols. 1 to 4 contain the RBSC name (which also provides
the position), the 1σ error in position, the count rate, and the hardness ratio 1 for each source. In Col. 5 we show the offset between the RBSC and the NVSS positions, while in Cols. 6 to 8 we list the NVSS name (constructed with truncated coordinates), the 1σ error in position and the NVSS flux density for each source. Galactic coordinates for all sources are listed in Cols. 9 and 10. The horizontal lines divide Group 1 (top), Group 2 (middle), and the already known REXB sources (bottom). The source 1RXS J072418.3−071508 is a quasar (see text).
RBSC RBSC/NVSS NVSS Gal. coord.
1RXS name Pos. err. Count rate HR1 Offset NVSS name Pos. err. Flux density l b
[′′] [10−2s−1] [′′] [′′] [mJy] [◦] [◦] J001442.2+580201 9 8.5 ± 1.4 1.00 ± 0.12 3 J001441+580202 3 7.1 ± 0.5 118.07 −4.49 J013106.4+612035 7 25.0 ± 2.4 0.90 ± 0.05 6 J013107+612033 1 19.1 ± 0.7 127.67 −1.16 J042201.0+485610 14 5.1 ± 1.1 1.00 ± 0.24 4 J042200+485607 7 2.3 ± 0.4 154.41 −0.63 J062148.1+174736 8 8.8 ± 1.6 1.00 ± 0.13 4 J062147+174734 1 12.2 ± 0.5 193.78 +1.72 J072259.5−073131 8 17.4 ± 2.1 0.94 ± 0.05 6 J072259−073135 1 84.1 ± 3.1 223.24 +3.52 J072418.3−071508 23 5.2 ± 1.2 1.00 ± 0.13 19 J072417−071519 1 330.4 ± 9.9 223.15 +3.93 (Quasar) J181119.4−275939 14 14.0 ± 3.1 0.87 ± 0.14 13 J181120−275946 1 27.9 ± 1.0 3.64 −4.43 J185002.8−075833 13 6.1 ± 1.6 1.00 ± 0.24 10 J185002−075842 1 49.9 ± 1.6 25.66 −3.32 J050339.8+451715 11 6.1 ± 1.3 0.85 ± 0.17 16 J050339+451658 1 34.3 ± 1.1 161.81 +2.31 J080451.8−274924 11 7.0 ± 1.8 1.00 ± 0.15 14 J080451−274911 1 821 ±25 245.80 +2.01 J082404.3−302033 8 17.5 ± 2.4 0.96 ± 0.06 11 J082403−302038 1 85.0 ± 2.6 250.23 +4.11 J190333.1+104355 14 10.8 ± 1.7 1.00 ± 0.04 16 J190333+104409 7 4.7 ± 0.6 43.86 +2.22 J205644.3+494011 16 7.7 ± 1.0 1.00 ± 0.06 17 J205642+494005 1 167.3 ± 5.0 89.32 +2.76 J024033.5+611358 13 5.4 ± 1.1 1.00 ± 0.17 19 J024031+611345 1 42.2 ± 1.3 135.68 +1.09 (LS I +61 303) J182615.1−145034 11 6.5 ± 1.6 1.00 ± 0.16 21 J182614−145054 1 23.4 ± 0.9 16.88 −1.29 (LS 5039) J191149.7+045857 8 52.6 ± 3.7 0.96 ± 0.03 3 J191149+045858 1 867 ±26 39.69 −2.24 (SS 433) J203226.2+405725 7 284.9 ± 6.5 0.98 ± 0.00 7 J203225+405728 1 87.3 ± 3.2 79.84 +0.69 (Cyg X-3)
these data for each source, with the task DBCON within AIPS. Finally, we performed uniform weighted maps from which po-sitions were obtained after fitting elliptical Gaussians using JMFIT within AIPS. A realistic estimate of the position error is about 0.01′′.
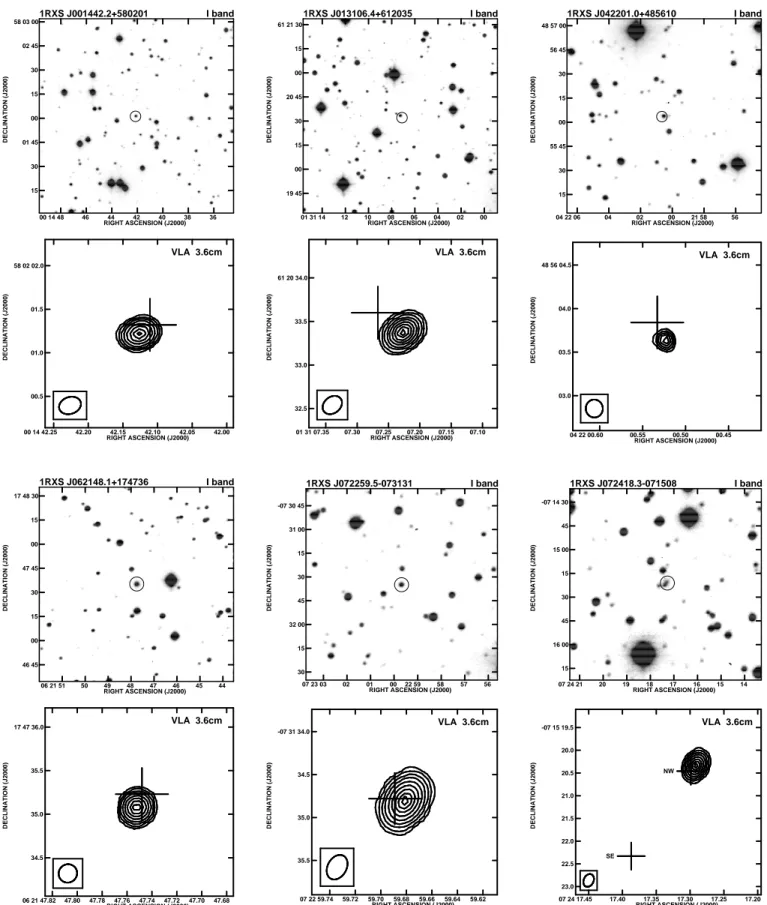
In order to obtain good quality maps, once accurate posi-tions were known, we carried out a similar process, but us-ing phase self-calibration with the previously obtained posi-tions for each individual snapshot at 3.6 cm wavelength. This was not possible for 1RXS J042201.0+485610 because the flux density was too low and prevented self-calibration. The result-ing uniform weighted maps, together with the optical images that will be presented in the following section, are shown in Fig. 2.
The flux densities of all sources were measured as follows. First of all we self-calibrated all snapshots at all wavelengths (again with the exception of 1RXS J042201.0+485610). Then we performed natural weighted maps with improved dynamic range, from which flux densities were measured using again elliptical Gaussian fits.
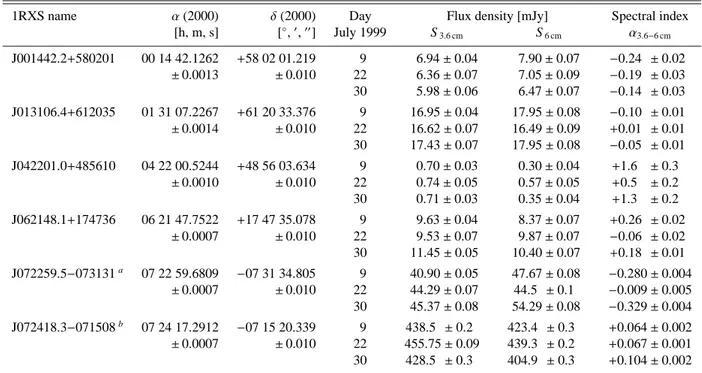
The obtained results for all observed sources are summa-rized in Table 2. In Col. 1 we list the RBSC object names,
while in Cols. 2 and 3 we show the radio positions derived from our phase-referenced uniform weighted maps of all con-catenated 3.6 cm wavelength observations. In Col. 4 we list the observing dates and, in Cols. 5 and 6, the corresponding flux densities at both observing wavelengths, measured on the self-calibrated natural weighted maps. The flux density errors
quoted are the rms noise of the maps in mJy beam−1. In Col. 7
we show the computed spectral index α (defined in such a way
that Sν∝ν+α, where Sνis the flux density at a given frequency
ν) of each source for all epochs. The radio spectra
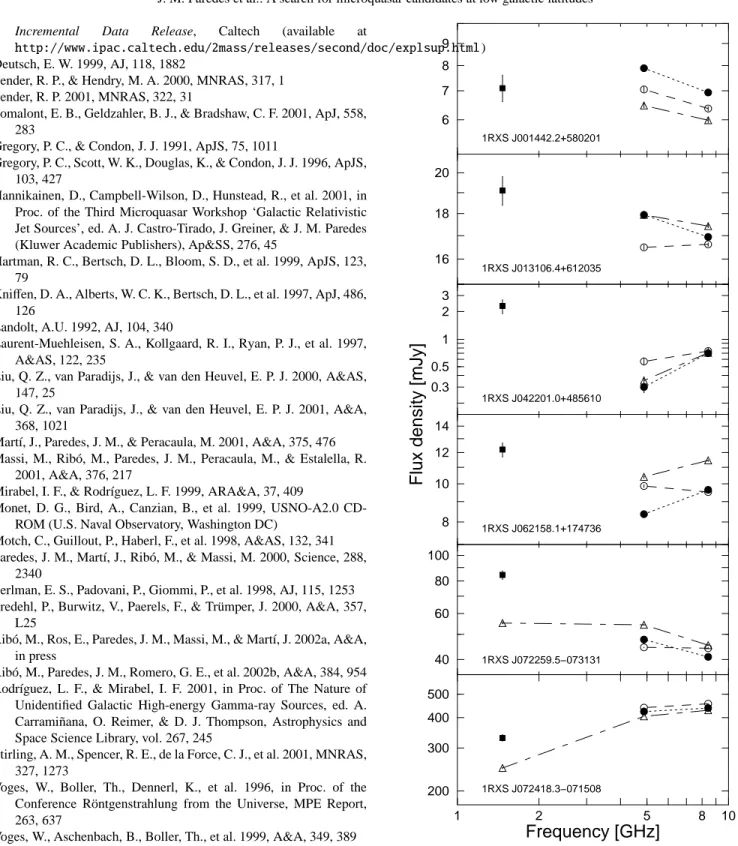
correspond-ing to the values listed in Table 2 are plotted in Fig. 3 for all sources, including the 20 cm wavelength flux densities mea-sured on July 30 for the last two sources. We have also plot-ted, for all sources, the non-simultaneous 20 cm measurements from the NVSS survey obtained in VLA D configuration.
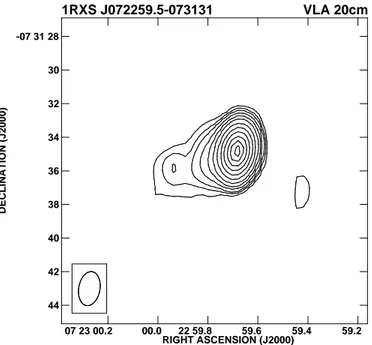
Inspection of all obtained maps (with phase-reference or self-calibration techniques, with uniform or natural weights, of individual snapshots or after concatenating all of them, and at all frequencies), reveals that all sources are point-like except 1RXS J072259.5−073131, which presents extended structure towards the east, marginally present in the 3.6 and 6 cm maps,
1RXS J001442.2+580201 DECLINATION (J2000) RIGHT ASCENSION (J2000) 00 15 00 14 55 50 45 40 35 30 25 20 58 05 04 03 02 01 00 57 59 1RXS J013106.4+612035 DECLINATION (J2000) RIGHT ASCENSION (J2000) 01 31 30 25 20 15 10 05 00 30 55 50 45 61 23 22 21 20 19 18 1RXS J042201.0+485610 DECLINATION (J2000) RIGHT ASCENSION (J2000) 04 22 15 10 05 00 21 55 50 45 48 59 58 57 56 55 54 1RXS J062148.1+174736 DECLINATION (J2000) RIGHT ASCENSION (J2000) 06 22 00 21 55 50 45 40 17 50 49 48 47 46 45 1RXS J072259.5-073131 DECLINATION (J2000) RIGHT ASCENSION (J2000) 07 23 10 05 00 22 55 50 -07 29 30 31 32 33 34 1RXS J072418.3-071508 DECLINATION (J2000) RIGHT ASCENSION (J2000) 07 24 25 20 15 10 05 -07 13 14 15 16 17 18 1RXS J181119.4-275939 DECLINATION (J2000) RIGHT ASCENSION (J2000) 18 11 30 25 20 15 10 -27 57 58 59 -28 00 01 02 1RXS J185002.8-075833 DECLINATION (J2000) RIGHT ASCENSION (J2000) 18 50 15 10 05 00 49 55 -07 56 57 58 59 -08 00 01
Fig. 1. Optical, radio and X-ray composition of Group 1 sources. The NVSS radio contours are overlaid on the 6′×6′optical DSS1 images, whereas the open crosses denote the 3σ RBSC astrometric errors.
and visible as a one-sided jet in the 30 July snapshot observa-tion at 20 cm wavelength (see Fig. 4).
4. Optical observations
Having in mind the goal of identifying the optical counterparts, CCD observations were made at Calar Alto (Almer´ıa, Spain) with the 1.5 m telescope of the Observatorio Astron ´omico Nacional (OAN), between 24 and 30 November 1998. We used the Ritchey-Chr´etien focus and a Tektronics TK1024AB chip
that provides a scale factor of 0.4′′per pixel and a 6.9′×6.9′
field of view. Deep CCD images were obtained for all our can-didates, with the exception of 1RXS J181119.4−275939 and 1RXS J185002.8−075833 that were not visible at the epoch of our observations. The images were taken with the V, R and I Johnson filters, and the exposure times were typically of 600– 1200 seconds. Although the images were useful for photomet-ric measurements, their quality did not allow us to obtain accu-rate positions.
Complementary CCD observations were conducted on 1999 December 11 also at Calar Alto, but using the 2.2 m tele-scope of the Centro Astron ´omico Hispano-Alem´an (CAHA). Images were obtained using the Ritchey-Chr´etien focus and
CAFOS, leading a scale factor of 0.53′′per pixel and a 8.8′×
8.8′field of view, through the I Johnson filter and with
expo-sure times between 180 and 600 seconds. The good quality of these images allowed us to perform accurate astrometric mea-surements, although no precise photometric information could be obtained since the images could not be photometrically cal-ibrated.
The observations were reduced using standard procedures (bias and dark subtraction and flat-field correction) within the IRAF software package.
4.1. Results
Promising optical counterparts for all observed sources, i.e., the first six ones in Table 1, were found in both observing runs. Thanks to the CAHA 2.2 m observations we were able to obtain accurate positions. For this purpose, we performed a detailed astrometric reduction of each image using field stars present in the USNO-A2.0 catalog (Monet et al. 1999). First of all we selected point-like objects in the image, not elliptical or binary objects due to crowded fields, and determined their positions (X, Y). We also rejected very faint objects to allow a significant signal-to-noise ratio. On the other hand, very bright objects were also rejected, because the positions given in the USNO-A2.0 catalog are from plates obtained around 1950, and nearby (bright) stars could have experienced a shift in position since then due to relatively high proper motions. Then we fit-ted an astrometric solution to our image using the USNO-A2.0 (α, δ) and image (X, Y) positions for the common stars in both the catalog and the image, and rejected spurious points above 3σ. We proceeded iteratively until convergence was achieved. This process allowed us to obtain plate solutions with an rms
of ∼ 0.2′′ in each coordinate. This relatively high error
prob-ably arises from the non-zero proper motions of the field stars finally used in the fit, between 36 and 155 depending on each image. We have to quadratically add to this error the 1σ empir-ical uncertainty estimate of the USNO-A2.0 catalog relative to
the ICRF, which is also ∼ 0.2′′in each coordinate (see Table 1
of Deutsch 1999). Therefore, the final 1σ error of our obtained
coordinates is estimated to be 0.3′′.
We show the central 2′×2′ of the CAHA 2.2 m images
in Fig. 2, with the optical counterparts marked with a cir-cle (which is not any X-ray or radio error box). All sources appeared basically as point-like objects, except the quasar
1RXS J001442.2+580201 I band DECLINATION (J2000) RIGHT ASCENSION (J2000) 00 14 48 46 44 42 40 38 36 58 03 00 02 45 30 15 00 01 45 30 15 1RXS J013106.4+612035 I band DECLINATION (J2000) RIGHT ASCENSION (J2000) 01 31 14 12 10 08 06 04 02 00 61 21 30 15 00 20 45 30 15 00 19 45 1RXS J042201.0+485610 I band DECLINATION (J2000) RIGHT ASCENSION (J2000) 04 22 06 04 02 00 21 58 56 48 57 00 56 45 30 15 00 55 45 30 15 VLA 3.6cm DECLINATION (J2000) RIGHT ASCENSION (J2000) 00 14 42.25 42.20 42.15 42.10 42.05 42.00 58 02 02.0 01.5 01.0 00.5 VLA 3.6cm DECLINATION (J2000) RIGHT ASCENSION (J2000) 01 31 07.35 07.30 07.25 07.20 07.15 07.10 61 20 34.0 33.5 33.0 32.5 VLA 3.6cm DECLINATION (J2000) RIGHT ASCENSION (J2000) 04 22 00.60 00.55 00.50 00.45 48 56 04.5 04.0 03.5 03.0 1RXS J062148.1+174736 I band DECLINATION (J2000) RIGHT ASCENSION (J2000) 06 21 51 50 49 48 47 46 45 44 17 48 30 15 00 47 45 30 15 00 46 45 1RXS J072259.5-073131 I band DECLINATION (J2000) RIGHT ASCENSION (J2000) 07 23 03 02 01 00 22 59 58 57 56 -07 30 45 31 00 15 30 45 32 00 15 30 1RXS J072418.3-071508 I band DECLINATION (J2000) RIGHT ASCENSION (J2000) 07 24 21 20 19 18 17 16 15 14 -07 14 30 45 15 00 15 30 45 16 00 15 VLA 3.6cm DECLINATION (J2000) RIGHT ASCENSION (J2000) 06 21 47.82 47.80 47.78 47.76 47.74 47.72 47.70 47.68 17 47 36.0 35.5 35.0 34.5 VLA 3.6cm DECLINATION (J2000) RIGHT ASCENSION (J2000) 07 22 59.74 59.72 59.70 59.68 59.66 59.64 59.62 -07 31 34.0 34.5 35.0 35.5 VLA 3.6cm DECLINATION (J2000) RIGHT ASCENSION (J2000) 07 24 17.45 17.40 17.35 17.30 17.25 17.20 -07 15 19.5 20.0 20.5 21.0 21.5 22.0 22.5 23.0 SE NW
Fig. 2. Optical images and radio maps, grouped in pairs, of the six sources listed in Table 2. The 2′×2′optical images were obtained through the I Johnson filter with the CAHA 2.2 m telescope on 1999 December 11, and circles have been used to clearly mark the optical counterparts. The radio maps, computed using uniform weights, are the result of concatenating, for each
source, all VLA 1999 July observations at 3.6 cm wavelength, while the crosses indicate the optical positions with the 1σ 0.3′′
astrometric errors. The radio maps are 2′′×2′′wide for all sources except for the last one, where a 4′′×4′′map has been plotted
to allow the inclusion of the close SE optical object. The synthesized beam is plotted in the bottom left corner of each map. The radio contours start at a signal-to-noise ratio of 6 for all sources except for the last one, where a value of 15 has been used, in order to avoid reproducing cleaning effects at low signal-to-noise ratios in all cases.
Table 2. Radio positions, flux densities and spectral indices obtained after the VLA A configuration observations for all sources
belonging to Group 1 except 1RXS J181119.4−275939 and 1RXS J185002.8−075833. The coordinates are those obtained from the uniform weighted maps of all concatenated 3.6 cm wavelength observations. The flux densities at 3.6 and 6 cm have been obtained from natural weighted self-calibrated maps for each source, with the exception of 1RXS J042201.0+485610, where self-calibration was not possible.
1RXS name α(2000) δ(2000) Day Flux density [mJy] Spectral index
[h, m, s] [◦,′,′′] July 1999 S 3.6 cm S6 cm α3.6−6 cm J001442.2+580201 00 14 42.1262 +58 02 01.219 9 6.94 ± 0.04 7.90 ± 0.07 −0.24 ± 0.02 ±0.0013 ±0.010 22 6.36 ± 0.07 7.05 ± 0.09 −0.19 ± 0.03 30 5.98 ± 0.06 6.47 ± 0.07 −0.14 ± 0.03 J013106.4+612035 01 31 07.2267 +61 20 33.376 9 16.95 ± 0.04 17.95 ± 0.08 −0.10 ± 0.01 ±0.0014 ±0.010 22 16.62 ± 0.07 16.49 ± 0.09 +0.01 ± 0.01 30 17.43 ± 0.07 17.95 ± 0.08 −0.05 ± 0.01 J042201.0+485610 04 22 00.5244 +48 56 03.634 9 0.70 ± 0.03 0.30 ± 0.04 +1.6 ±0.3 ±0.0010 ±0.010 22 0.74 ± 0.05 0.57 ± 0.05 +0.5 ±0.2 30 0.71 ± 0.03 0.35 ± 0.04 +1.3 ±0.2 J062148.1+174736 06 21 47.7522 +17 47 35.078 9 9.63 ± 0.04 8.37 ± 0.07 +0.26 ± 0.02 ±0.0007 ±0.010 22 9.53 ± 0.07 9.87 ± 0.07 −0.06 ± 0.02 30 11.45 ± 0.05 10.40 ± 0.07 +0.18 ± 0.01 J072259.5−073131a 07 22 59.6809 −07 31 34.805 9 40.90 ± 0.05 47.67 ± 0.08 −0.280 ± 0.004 ±0.0007 ±0.010 22 44.29 ± 0.07 44.5 ± 0.1 −0.009 ± 0.005 30 45.37 ± 0.08 54.29 ± 0.08 −0.329 ± 0.004 J072418.3−071508b 07 24 17.2912 −07 15 20.339 9 438.5 ± 0.2 423.4 ± 0.3 +0.064 ± 0.002 ±0.0007 ±0.010 22 455.75 ± 0.09 439.3 ± 0.2 +0.067 ± 0.001 30 428.5 ± 0.3 404.9 ± 0.3 +0.104 ± 0.002 aAlso observed at 20 cm on 1999 July 30, with a flux density of 55.1 ± 0.4 mJy, and showing a one-sided radio jet.
bAlso observed at 20 cm on 1999 July 30, with a flux density of 248.3 ± 0.9 mJy.
1RXS J072418.3−071508, which had a complex structure with two separate optical components, hereafter NW (northwest) and SE (southeast). The NW position falls well within the NVSS error box and close to our obtained radio position. On the contrary, the SE position is clearly out the NVSS error box, and cannot be considered as a reliable counterpart to the radio source.
Photometry was obtained thanks to the OAN 1.5 m obser-vations. The absolute photometry is believed to be accurate only to ±0.1 magnitude in the best cases, because we could only determine the approximate photometric zero point by ob-serving a few standard stars from Landolt (1992).
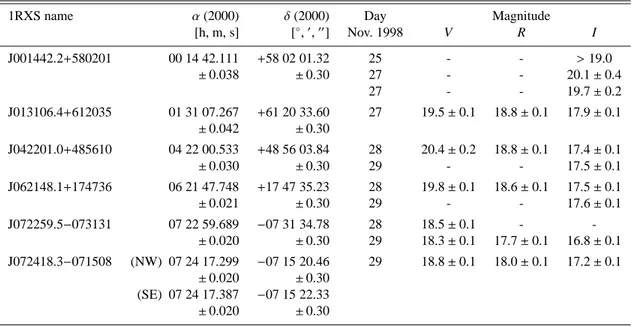
The obtained results are presented in Table 3, where Col. 1 gives the RBSC object name, Cols. 2 and 3 give the J2000.0 ICRS coordinates of the optical position with the 1σ error of
0.3′′ below each coordinate, Col. 4 gives the observing dates
and Cols. 5 to 7 give the Johnson V, R and I magnitudes. Magnitudes for 1RXS J072418.3−071508 correspond to the sum of both the NW and SE components.
5. Discussion
The observations reported here provide accurate positions in
the optical (0.3′′) and specially in the radio (0.01′′) domains.
The astrometric agreement for each source can be seen in the radio maps of Fig. 2, and is numerically expressed in Table 4,
where we list the offsets in right ascension, in declination and the total offset between the optical and radio positions. As can be seen, the offsets in each coordinate are always smaller than the 1σ optical errors in position.
Although the agreements in position are certainly very promising, we have estimated the probability of a random coin-cidence. For this purpose, we have obtained the limiting I mag-nitude of our CAHA 2.2 m images and counted the number of objects until this threshold. Then we have estimated the object-density of our images by assigning to each object the area of the
1σ error box in position, i.e., (2 × 1σ)2 = (0.6′′)2. Finally, we
have divided the area occupied by the stars by the area of the image, and obtained a naive estimate of the probability to find an optical object, up to a given limiting I magnitude, close to
the radio position by less than 1σ, or 0.3′′, in each coordinate.
The limiting I magnitudes and obtained probabilities of ran-dom coincidence are listed in the last two columns of Table 4. Since these probabilities are always smaller than 1%, and even much smaller if we consider the particular offsets instead of the 1σ optical errors, we conclude that probably all optical objects are the counterparts of the radio sources, and none of them is a field star not related to the radio source.
On the other hand, an analysis of observed radio spectra of X-ray binaries can be found in Fender (2001). It seems clear that negative spectral indices (−1 ≤ α ≤ −0.2) are detected when observing synchrotron emission from
expand-ing plasmons, which are the result of discrete ejections af-ter an outburst. On the contrary, flat or inverted radio spectra (0.0 ≤ α ≤ 0.6) are typical of the low/hard X-ray state of black hole candidates, and are believed to arise in synchrotron emission from a partially self-absorbed jet. Hence, a variety of spectral indices can be found in the objects we are looking for. However, inverted spectra with α > 1 at high radio frequencies (above 5 GHz) would probably rule out a REXB nature.
REXBs often display a variable flux, although extragalac-tic sources may vary as well. Our observations, performed at one/two week interval, allow us to estimate the degree of
variability given by (Smax −Smin)/(Smax+ Smin), being Smax
and Smin the maximum and the minimum flux density,
re-spectively. As it is clear from Table 2 and Fig. 3, all sources in the sample show some degree of flux density variabil-ity at centimeter wavelengths during the three runs of our monitoring. This variability is always within 10%, except for 1RXS J042201.0+485610 at 6 cm, where a variability up to
∼30% is detected, although it should be considered with
cau-tion due to the low emission level.
The optical emission seen in microquasars arises from the non-degenerated star of the system, i.e., the companion of the compact object. Hence, in microquasars containing a high mass companion spectral types O or B are found, while in those con-taining a low mass companion the spectral type is later than A (White et al. 1995). Therefore, as optical counterpart of a given candidate, we expect to find a non-degenerated star with any spectral type, and with a luminosity class ranging from the main sequence to supergiant. In fact, once photometric magni-tudes of an object through different filters and its distance are known, one can easily deduce its spectral type assuming it is a star. However, we have no information about the distance to our sources, and no correction for extinction can be applied to our data. This is particularly important in our case, since our search has been carried out at low galactic latitudes, where a high degree of extinction is expected, preventing any spectral type classification from the photometric data alone.
5.1. Discussion on individual sources
1RXS J001442.2+580201. The radio counterpart, see Table 2, shows a moderate degree of variability but always displaying a negative spectral index of ∼ −0.2, suggesting an optically thin or partially self-absorbed synchrotron emitter. As can be seen in Fig. 3, the non-simultaneous NVSS flux density measurement at 20 cm wavelength is compatible with this behavior or even with a flattening of the spectrum at longer wavelengths, although this could be due to intrinsic variability. Non-thermal synchrotron radiation remains therefore as the most plausible interpretation for the radio emission of this source. The optical counterpart to the radio source (Fig. 2) appears as a point-like source with I ∼ 20, which makes it the weakest optical object of our sample. No R or V magnitudes could be obtained, although a typical behavior for low latitude highly absorbed sources is an increase of ∼ 1 magnitude when changing from I to R and from R to V, as can be seen in the
other sources of Table 3. All the available information points towards a good REXB candidate.
1RXS J013106.4+612035. In the radio domain it shows a slightly negative or close to zero spectral index, reminiscent of optically thin or partially self-absorbed jets in REXBs, in which the non-simultaneous NVSS flux measurement fits well, and it displays a very low degree of variability of 2% at 3.6 cm and 4% at 6 cm. This object has also been observed within the Green Bank 5 GHz radio survey (Gregory & Condon 1991; Gregory et al. 1996) with a measured flux density of 24 mJy. This value is a little bit higher than the ones reported here, although this discrepancy could be due to intrinsic variability and/or to the different angular scales sampled by the interfer-ometric VLA observations. In fact, VLA A configuration ob-servations carried out by Laurent-Muehleisen et al. (1997) on October 19, 1992, indicate a flux density of 16 mJy at 5 GHz, in good agreement with our data. In the optical domain, the counterpart to the radio source appears as a point-like object
with a nearby field object at ∼ 3′′ to the northeast, visible in
Fig. 2, which is ∼ 1 magnitude fainter in the I band. The op-tical magnitudes in Table 3 correspond to the sum of both ob-jects (unresolved in the OAN 1.5 m images), and are typical of low latitude highly absorbed sources. Overall it seems a good REXB candidate.
1RXS J042201.0+485610. In the RBSC this source appears
catalogued with an X-ray extension of 17′′, which could
sug-gest an extragalactic origin of the source. However, X-ray halos produced by the scattering of the original X-ray photons by in-terstellar dust grains are seen in some galactic microquasars, like for example in a Chandra observation of Cyg X-3 (Predehl
et al. 2000). In fact, Cyg X-3 has an X-ray extension of 63′′
within the RBSC, while SS 433 has one of 25′′. Hence, the
presence of an X-ray extension does not rule out a REXB na-ture for this source. The radio counterpart shows the lowest radio emission level of all sources in our sample, and displays an inverted spectrum up to α ∼ +1.6 (see Table 2), difficult to account for self-absorbed synchrotron radiation at such high frequencies. Nevertheless, as it happens in some AGN, a highly inverted spectrum would be expected if the jet is stopped in a dense medium on a compact scale. On the other hand, the non-simultaneous NVSS flux density measurement seems to be in-compatible with self-absorbed synchrotron radiation. Although this could be due to intrinsic variability of the source, this would require variations of an order of magnitude in flux. This discrepancy can be explained if we assume a thermal origin for the radio emission and if we attribute the drop in flux density in our VLA A configuration observations due to over resolution when compared to the NVSS VLA D configuration observa-tions. The optical counterpart to the radio source has a nearby
field object at ∼ 3′′ to the west, marginally visible in Fig. 2,
which is ∼ 2 magnitudes fainter in the I band. The optical mag-nitudes in Table 3 correspond to the sum of both objects (unre-solved in the OAN 1.5 m images), although the nearby one is not expected to contaminate appreciably, and are again typical of low latitude highly absorbed sources. Although at first sight
Table 3. Optical astrometric and photometric results for all sources listed in Table 2. Accurate positions were obtained from the
I Johnson filter CAHA 2.2 m telescope observations carried out on 1999 December 11. Magnitudes in V, R and I Johnson filters
were obtained in different dates of November 1998 using the OAN 1.5 m telescope. Note that two positions are given for the source 1RXS J072418.3−071508.
1RXS name α(2000) δ(2000) Day Magnitude
[h, m, s] [◦,′,′′] Nov. 1998 V R I J001442.2+580201 00 14 42.111 +58 02 01.32 25 - - >19.0 ±0.038 ±0.30 27 - - 20.1 ± 0.4 27 - - 19.7 ± 0.2 J013106.4+612035 01 31 07.267 +61 20 33.60 27 19.5 ± 0.1 18.8 ± 0.1 17.9 ± 0.1 ±0.042 ±0.30 J042201.0+485610 04 22 00.533 +48 56 03.84 28 20.4 ± 0.2 18.8 ± 0.1 17.4 ± 0.1 ±0.030 ±0.30 29 - - 17.5 ± 0.1 J062148.1+174736 06 21 47.748 +17 47 35.23 28 19.8 ± 0.1 18.6 ± 0.1 17.5 ± 0.1 ±0.021 ±0.30 29 - - 17.6 ± 0.1 J072259.5−073131 07 22 59.689 −07 31 34.78 28 18.5 ± 0.1 - -±0.020 ±0.30 29 18.3 ± 0.1 17.7 ± 0.1 16.8 ± 0.1 J072418.3−071508 (NW) 07 24 17.299 −07 15 20.46 29 18.8 ± 0.1 18.0 ± 0.1 17.2 ± 0.1 ±0.020 ±0.30 (SE) 07 24 17.387 −07 15 22.33 ±0.020 ±0.30
Table 4. Offsets from the radio to the optical positions in right ascension, in declination and the total offset. The limiting I
magnitude of our CAHA 2.2 m images and the probability of a random coincidence are listed in the last two columns.
1RXS name αo−αr[′′] δo−δr[′′] o-r [′′] Limiting I mag. Probability [%]
J001442.2+580201 −0.12 0.10 0.16 22 0.3 J013106.4+612035 0.29 0.22 0.37 21 0.3 J042201.0+485610 0.08 0.21 0.22 20 0.2 J062148.1+174736 −0.06 0.15 0.16 20 0.2 J072259.5−073131 0.12 0.02 0.12 19 0.2 J072418.3−071508 0.12 −0.12 0.17 18 0.2
our target appears as a point-like source in Fig. 2, if we per-form Gaussian fits to field objects with similar magnitudes, we find our target to have a Full Width at Half Maximum (FWHM)
∼15% greater, suggesting that it is in fact an extended optical
object. In summary, the high spectral index and the extended optical emission indicate that this source is not a very promis-ing REXB candidate.
1RXS J062148.1+174736. In the radio domain, this source displays an inverted or flat spectrum, which could account for a partially self-absorbed jet. On the other hand, the moder-ate variability observed, around 10%, could explain the higher non-simultaneous NVSS flux density measurement. In the op-tical domain, this source appears as a point-like object with magnitudes typical of low latitude highly absorbed sources. However, a careful inspection of the optical image, reveals that the FWHM of a Gaussian fit to our target source is ∼ 30% greater than those of other sources with similar magnitudes. This fact points to an extragalactic nature for this source. It is
worth to mention that this source is the only one in our sample present in the second incremental release of the Two Micron All Sky Survey (2MASS) (Cutri et al. 2000). Its position, ob-tained from images taken in October 1997, is there listed as
α = 6h21m47.749s±0.009s, δ = +17◦ 47′35.07′′±0.13′′,
in very good agreement with our obtained coordinates. Finally, we would like to point out that Motch et al. (1998) list 3 stars within the ray error box as possible counterparts to the X-ray source. Our proposed optical counterpart on the basis of the radio position, would rule out any of these 3 stars as the optical counterpart of this X-ray source. Overall, it looks like an extragalactic object because of its optical extension.
1RXS J072259.5−073131. The radio counterpart presents an extended structure towards the east, marginally present in the 3.6 and 6 cm maps, and visible as a one-sided jet in the 30 July 4 minute snapshot observation at 20 cm wavelength (see Fig. 4). Although the one-sided morphology is suggestive of an extragalactic nature for this source, specially if we take into
account that we are mapping the source at arcsecond scales, we cannot rule out a possible galactic nature on the basis of the detected morphology. The source also shows a moderate degree of variability, displaying most of time a negative spec-tral index but also close to 0 in the July 22 observation. As can be seen in Fig. 3, the non-simultaneous NVSS flux density measurement at 20 cm wavelength could be compatible with a non-thermal optically thin spectrum. However, simultaneous observations during July 30 show a flattening of the spectrum at higher wavelengths, which could be due to self-absorption in this energy range. The difference between the NVSS and our flux density measurement at 20 cm wavelength could be due to intrinsic variability and/or to the different VLA configurations used. Anyway, non-thermal synchrotron radiation remains as the most plausible interpretation for the radio emission of this source, specially at higher frequencies. The optical counterpart appears as a point-like object with the magnitudes of an ab-sorbed object at low galactic latitudes. These properties are in good agreement with the expected ones for a microquasar, al-though the one-sided radio jet at arcsecond scales is most com-mon in extragalactic objects.
1RXS J072418.3−071508. This source has been recently (March 2002) classified as a quasar in the SIMBAD database, and it is not any more a REXB candidate. It is listed as PMN J0724−0715 in the NED database, and is the source WGA J0724.3−0715 in Perlman et al. (1998), who reported
a faint and quite broad Hα emission line (rest-frame Wλ =
30.3 Å, FWHM=4000 km s−1), and classified it as a flat
spec-trum radio quasar with z = 0.270. Nevertheless, we have re-ported here our observational results for this source, since it was a candidate when we performed the observations. In the radio it displays a low degree of variability of 3% at 3.6 cm and 4% at 6 cm, with a flat or even inverted spectrum. In the optical it appears as a complex double object, with a NW and a SE components, being the first one the counterpart to the radio source. Magnitudes in V, R and I typical of absorbed objects at low galactic latitudes were found. On the other hand, it appears
catalogued with an X-ray extension of 40′′in the RBSC.
6. Conclusions
We have presented a cross-identification method to search for REXBs, which are potential microquasar sources. The obtained results give confidence to the proposed method, since the out-put list of objects included all but one known persistent HMXB
microquasars within |b| < 5◦. The unidentified sources in the
list were divided in two groups, depending on the offset be-tween the RBSC and NVSS positions. The Group 1 source list contained 8 objects, of which 1RXS J181119.4−275939 and 1RXS J185002.8−075833 were not studied because they were not visible during our observations. We studied the remaining 6 radio sources of Group 1, and found optical counterparts to all of them. We obtained accurate positions at both radio and op-tical wavelengths, perfectly compatible between them. We also obtained radio spectra and optical magnitudes of the sources.
After a detailed analysis of the obtained data, we conclude that 1RXS J001442.2+580201 and 1RXS J013106.4+612035 are good REXB candidates, while 1RXS J042201.0+485610 is not so promising due to its highly inverted spectrum at high frequencies and its optical extended emission. A careful study of the optical counterpart of 1RXS J062148.1+174736 reveals it is extended, which points towards an extragalactic nature for this object. The situation is not clear in the case of 1RXS J072259.5−073131, because the optical data agrees with a microquasar nature, while the detected one-sided radio jet reaching arcsecond scales is most common in extragalactic sources. The last studied source, 1RXS J072418.3−071508, is an already identified quasar. Hence, two sources in our sample are very promising to be new microquasars in the Galaxy.
Optical spectroscopic observations, intended to unveil the nature of the optical counterparts, were attempted in autumn 2000 and 2001, and were not carried out due to bad weather conditions. A new attempt is in progress for autumn 2002. On the other hand, VLBI observations of these sources will be re-ported soon (Rib ´o et al. 2002a).
The two sources belonging to Group 1 not yet
observed, namely 1RXS J181119.4−275939 and
1RXS J185002.8−075833 will be eventually studied in the future, together with Group 2 sources. Finally, since some microquasars could have been ejected from the galactic plane (Rib ´o et al. 2002b), we are planning to extend this project up to higher galactic latitudes (5◦< |b| < 10◦).
Acknowledgements. We acknowledge useful comments and
discus-sions with O. Fors, X. Otazu and I. Ribas. We also acknowledge J. S. Bloom for reading through a draft version of this work and for his useful suggestions. We acknowledge detailed and useful com-ments from H. Falcke, the referee of this paper. We acknowledge partial support by DGI of the Ministerio de Ciencia y Tecnolog´ıa (Spain) under grant AYA2001-3092. We also acknowledge partial sup-port by the European Regional Development Fund (ERDF/FEDER). M. R. is supported by a fellowship from CIRIT (Generalitat de Catalunya, ref. 1999 FI 00199). J. M. is partially supported by Junta de Andaluc´ıa (Spain) and has also been aided in this work by an Henri Chr´etien International Research Grant administered by the American Astronomical Society. The authors were Visiting Astronomers at German-Spanish Astronomical Centre, Calar Alto, operated by the Max-Planck-Institute for Astronomy, Heidelberg, jointly with the Spanish National Commission for Astronomy. This research has made use of the NASA’s Astrophysics Data System Abstract Service, of the SIMBAD database, operated at CDS, Strasbourg, France, and of the NASA/IPAC Extragalactic Database (NED) which is operated by the Jet Propulsion Laboratory, California Institute of Technology, under contract with the National Aeronautics and Space Administration. The Digitized Sky Survey was produced at the Space Telescope Science Institute under U.S. Government grant NAG W-2166.
References
Castro-Tirado, A. J., Greiner, J., & Paredes, J. M. 2001, Proc. of the Third Microquasar Workshop on ‘Galactic Relativistic Jet Sources’, ed. A. J. Castro-Tirado, J. Greiner, & J. M. Paredes (Kluwer Academic Publishers), Ap&SS, 276
Condon, J. J., Cotton, W. D., Greisen, E. W., et al. 1998, AJ, 115, 1693 Cutri, R. M., Skrutskie, M. F., Van Dyk, S., et al. 2000, Explanatory Supplement to the 2MASS, Second
Incremental Data Release, Caltech (available at
http://www.ipac.caltech.edu/2mass/releases/second/doc/explsup.html)
Deutsch, E. W. 1999, AJ, 118, 1882
Fender, R. P., & Hendry, M. A. 2000, MNRAS, 317, 1 Fender, R. P. 2001, MNRAS, 322, 31
Fomalont, E. B., Geldzahler, B. J., & Bradshaw, C. F. 2001, ApJ, 558, 283
Gregory, P. C., & Condon, J. J. 1991, ApJS, 75, 1011
Gregory, P. C., Scott, W. K., Douglas, K., & Condon, J. J. 1996, ApJS, 103, 427
Hannikainen, D., Campbell-Wilson, D., Hunstead, R., et al. 2001, in Proc. of the Third Microquasar Workshop ‘Galactic Relativistic Jet Sources’, ed. A. J. Castro-Tirado, J. Greiner, & J. M. Paredes (Kluwer Academic Publishers), Ap&SS, 276, 45
Hartman, R. C., Bertsch, D. L., Bloom, S. D., et al. 1999, ApJS, 123, 79
Kniffen, D. A., Alberts, W. C. K., Bertsch, D. L., et al. 1997, ApJ, 486, 126
Landolt, A.U. 1992, AJ, 104, 340
Laurent-Muehleisen, S. A., Kollgaard, R. I., Ryan, P. J., et al. 1997, A&AS, 122, 235
Liu, Q. Z., van Paradijs, J., & van den Heuvel, E. P. J. 2000, A&AS, 147, 25
Liu, Q. Z., van Paradijs, J., & van den Heuvel, E. P. J. 2001, A&A, 368, 1021
Mart´ı, J., Paredes, J. M., & Peracaula, M. 2001, A&A, 375, 476 Massi, M., Rib´o, M., Paredes, J. M., Peracaula, M., & Estalella, R.
2001, A&A, 376, 217
Mirabel, I. F., & Rodr´ıguez, L. F. 1999, ARA&A, 37, 409
Monet, D. G., Bird, A., Canzian, B., et al. 1999, USNO-A2.0 CD-ROM (U.S. Naval Observatory, Washington DC)
Motch, C., Guillout, P., Haberl, F., et al. 1998, A&AS, 132, 341 Paredes, J. M., Mart´ı, J., Rib´o, M., & Massi, M. 2000, Science, 288,
2340
Perlman, E. S., Padovani, P., Giommi, P., et al. 1998, AJ, 115, 1253 Predehl, P., Burwitz, V., Paerels, F., & Tr¨umper, J. 2000, A&A, 357,
L25
Rib´o, M., Ros, E., Paredes, J. M., Massi, M., & Mart´ı, J. 2002a, A&A, in press
Rib´o, M., Paredes, J. M., Romero, G. E., et al. 2002b, A&A, 384, 954 Rodr´ıguez, L. F., & Mirabel, I. F. 2001, in Proc. of The Nature of Unidentified Galactic High-energy Gamma-ray Sources, ed. A. Carrami˜nana, O. Reimer, & D. J. Thompson, Astrophysics and Space Science Library, vol. 267, 245
Stirling, A. M., Spencer, R. E., de la Force, C. J., et al. 2001, MNRAS, 327, 1273
Voges, W., Boller, Th., Dennerl, K., et al. 1996, in Proc. of the Conference R¨ontgenstrahlung from the Universe, MPE Report, 263, 637
Voges, W., Aschenbach, B., Boller, Th., et al. 1999, A&A, 349, 389 White, N. E., Nagase, F., & Parmar, A. N. 1995, The properties of
X-ray binaries, in X-ray Binaries, ed. W. H. G. Lewin, J. van Paradijs, & E. P. J. van den Heuvel (Cambridge Univ. Press, Cambridge), 1 6 7 8 9 16 18 20 0.3 0.5 1 2 3 8 10 12 14
Flux density [mJy]
40 60 80 100 1 2 5 8 10
Frequency [GHz]
200 300 400 500 1RXS J013106.4+612035 1RXS J001442.2+580201 1RXS J042201.0+485610 1RXS J062158.1+174736 1RXS J072259.5−073131 1RXS J072418.3−071508Fig. 3. Radio spectra of the six sources listed in Table 2 at
dif-ferent epochs. The VLA data from July 9, 22 and 30 are de-noted by filled circles, open circles and open triangles, respec-tively. The non-simultaneous NVSS data, at 20 cm wavelength, are plotted as filled squares. Both axes are in logarithmic scale. Error bars not visible are smaller than the symbol’s size.
1RXS J072259.5-073131 VLA 20cm DECLINATION (J2000) RIGHT ASCENSION (J2000) 07 23 00.2 00.0 22 59.8 59.6 59.4 59.2 -07 31 28 30 32 34 36 38 40 42 44
Fig. 4. Natural weighted map of the self-calibrated 20 cm data
of 1RXS J072259.5−073131 obtained on the July 30 snapshot observation. Contours correspond to −3, 3, 4, 5, 7, 10, 15, 25,